
|
|||||
|
 | |
| |
| |
| |
| |
| |
|
Gene: UGCG |
Gene summary for UGCG |
| Gene information | Species | Human | Gene symbol | UGCG | Gene ID | 7357 |
| Gene name | UDP-glucose ceramide glucosyltransferase | |
| Gene Alias | GCS | |
| Cytomap | 9q31.3 | |
| Gene Type | protein-coding | GO ID | GO:0003008 | UniProtAcc | A0A024R157 |
Top |
Malignant transformation analysis |
| Identification of the aberrant gene expression in precancerous and cancerous lesions by comparing the gene expression of stem-like cells in diseased tissues with normal stem cells |
| Entrez ID | Symbol | Replicates | Species | Organ | Tissue | Adj P-value | Log2FC | Malignancy |
| 7357 | UGCG | CA_HPV_1 | Human | Cervix | CC | 7.00e-11 | 4.94e-01 | 0.0264 |
| 7357 | UGCG | CCI_1 | Human | Cervix | CC | 2.03e-02 | 8.91e-01 | 0.528 |
| 7357 | UGCG | CCI_2 | Human | Cervix | CC | 3.32e-08 | 1.08e+00 | 0.5249 |
| 7357 | UGCG | CCI_3 | Human | Cervix | CC | 9.96e-09 | 8.33e-01 | 0.516 |
| 7357 | UGCG | sample3 | Human | Cervix | CC | 6.56e-06 | 3.00e-01 | 0.1387 |
| 7357 | UGCG | T3 | Human | Cervix | CC | 1.43e-03 | 2.94e-01 | 0.1389 |
| 7357 | UGCG | AEH-subject4 | Human | Endometrium | AEH | 1.80e-13 | 6.21e-01 | -0.2657 |
| 7357 | UGCG | EEC-subject1 | Human | Endometrium | EEC | 7.96e-05 | 4.21e-01 | -0.2682 |
| 7357 | UGCG | EEC-subject3 | Human | Endometrium | EEC | 1.78e-09 | 2.33e-01 | -0.2525 |
| 7357 | UGCG | GSM5276934 | Human | Endometrium | EEC | 1.83e-05 | 3.73e-01 | -0.0913 |
| 7357 | UGCG | GSM5276937 | Human | Endometrium | EEC | 1.62e-11 | 5.17e-01 | -0.0897 |
| 7357 | UGCG | GSM6177620_NYU_UCEC1_lib1_lib1 | Human | Endometrium | EEC | 4.22e-08 | -3.96e-02 | -0.1869 |
| 7357 | UGCG | GSM6177620_NYU_UCEC1_lib2_lib2 | Human | Endometrium | EEC | 9.89e-06 | -5.58e-02 | -0.1875 |
| 7357 | UGCG | GSM6177620_NYU_UCEC1_lib3_lib3 | Human | Endometrium | EEC | 9.24e-08 | -1.74e-01 | -0.1883 |
| 7357 | UGCG | GSM6177621_NYU_UCEC2_lib1_lib1 | Human | Endometrium | EEC | 8.71e-07 | 6.23e-02 | -0.1934 |
| 7357 | UGCG | GSM6177622_NYU_UCEC3_lib1_lib1 | Human | Endometrium | EEC | 2.93e-15 | -1.55e-01 | -0.1917 |
| 7357 | UGCG | GSM6177622_NYU_UCEC3_lib2_lib2 | Human | Endometrium | EEC | 5.79e-11 | -1.70e-01 | -0.1916 |
| 7357 | UGCG | LZE4T | Human | Esophagus | ESCC | 3.30e-04 | 1.07e-01 | 0.0811 |
| 7357 | UGCG | LZE7T | Human | Esophagus | ESCC | 1.03e-02 | 1.45e-01 | 0.0667 |
| 7357 | UGCG | LZE8T | Human | Esophagus | ESCC | 7.09e-04 | 2.95e-01 | 0.067 |
| Page: 1 2 3 4 5 6 7 8 9 |
| Tissue | Expression Dynamics | Abbreviation |
| Cervix | 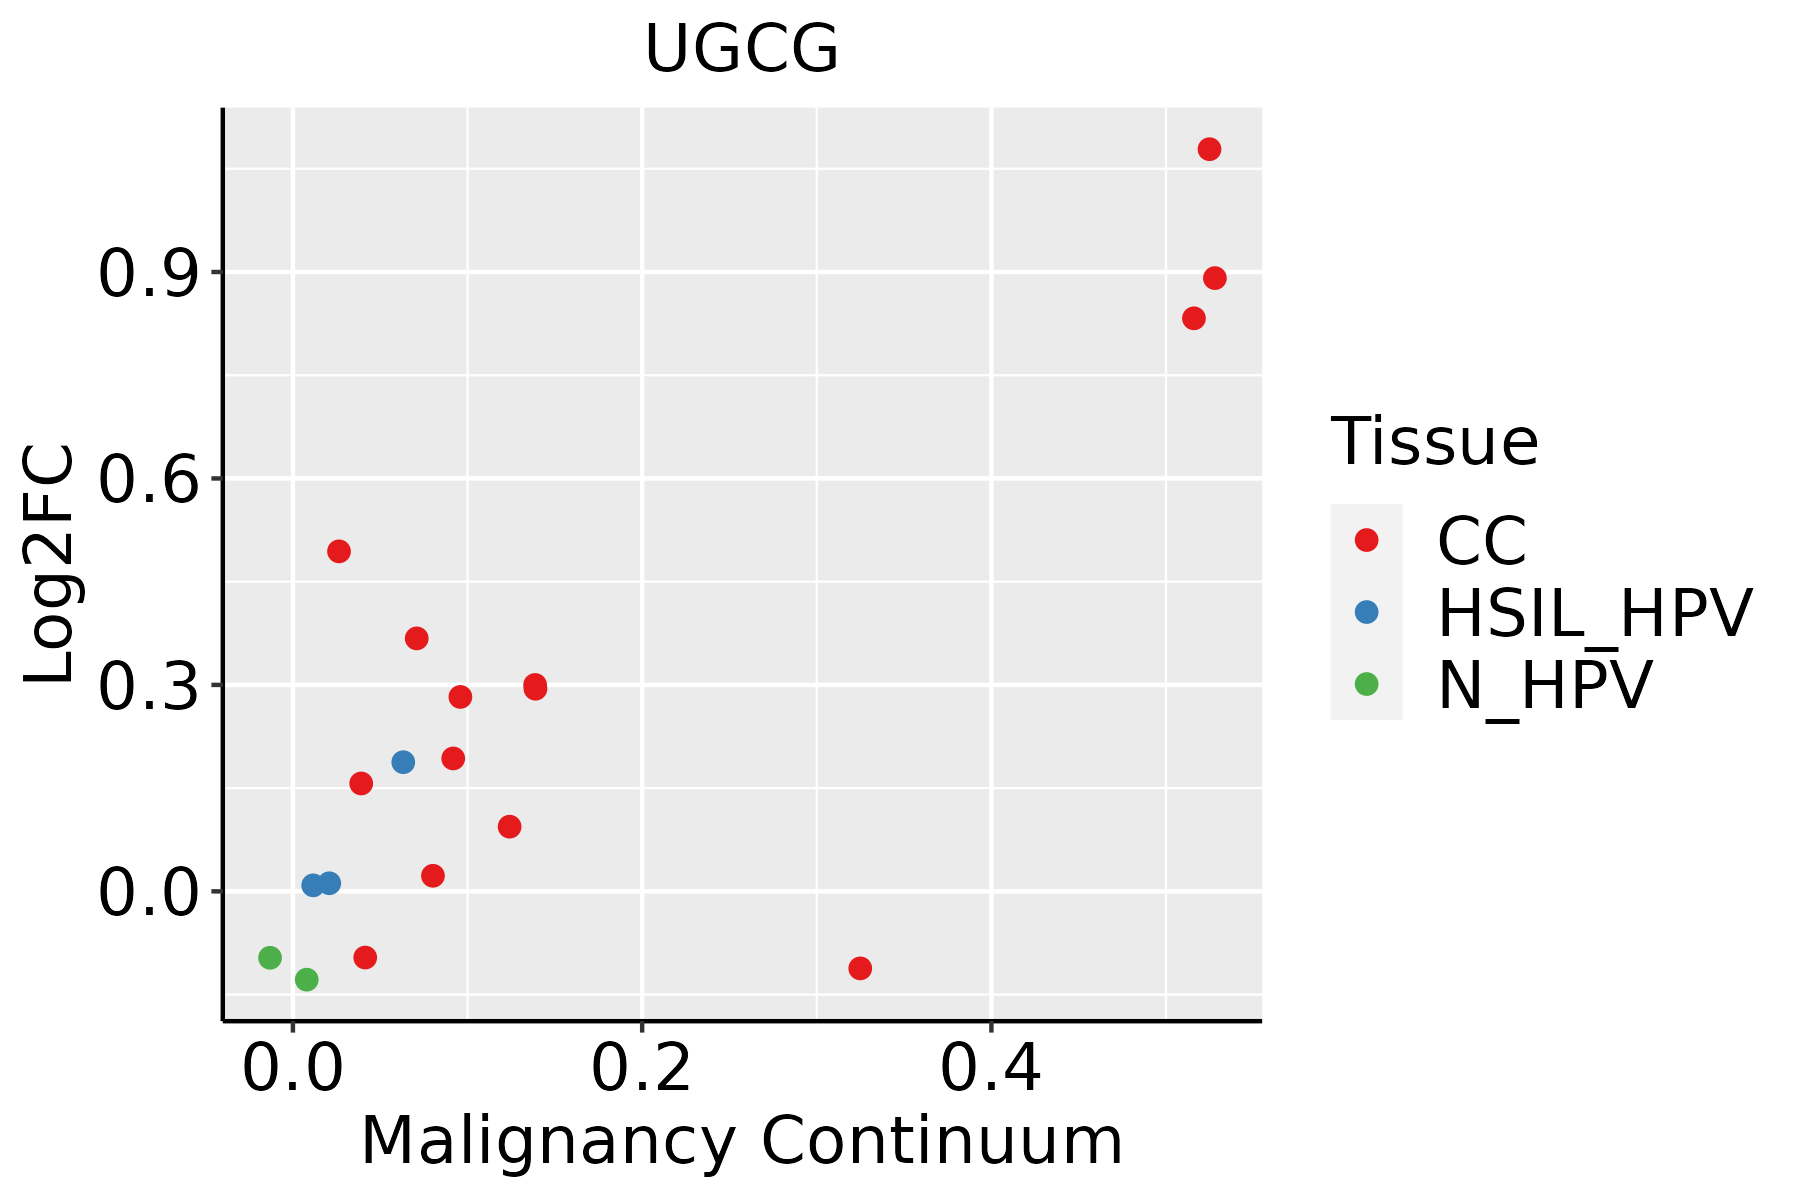 | CC: Cervix cancer |
| HSIL_HPV: HPV-infected high-grade squamous intraepithelial lesions | ||
| N_HPV: HPV-infected normal cervix | ||
| Endometrium | 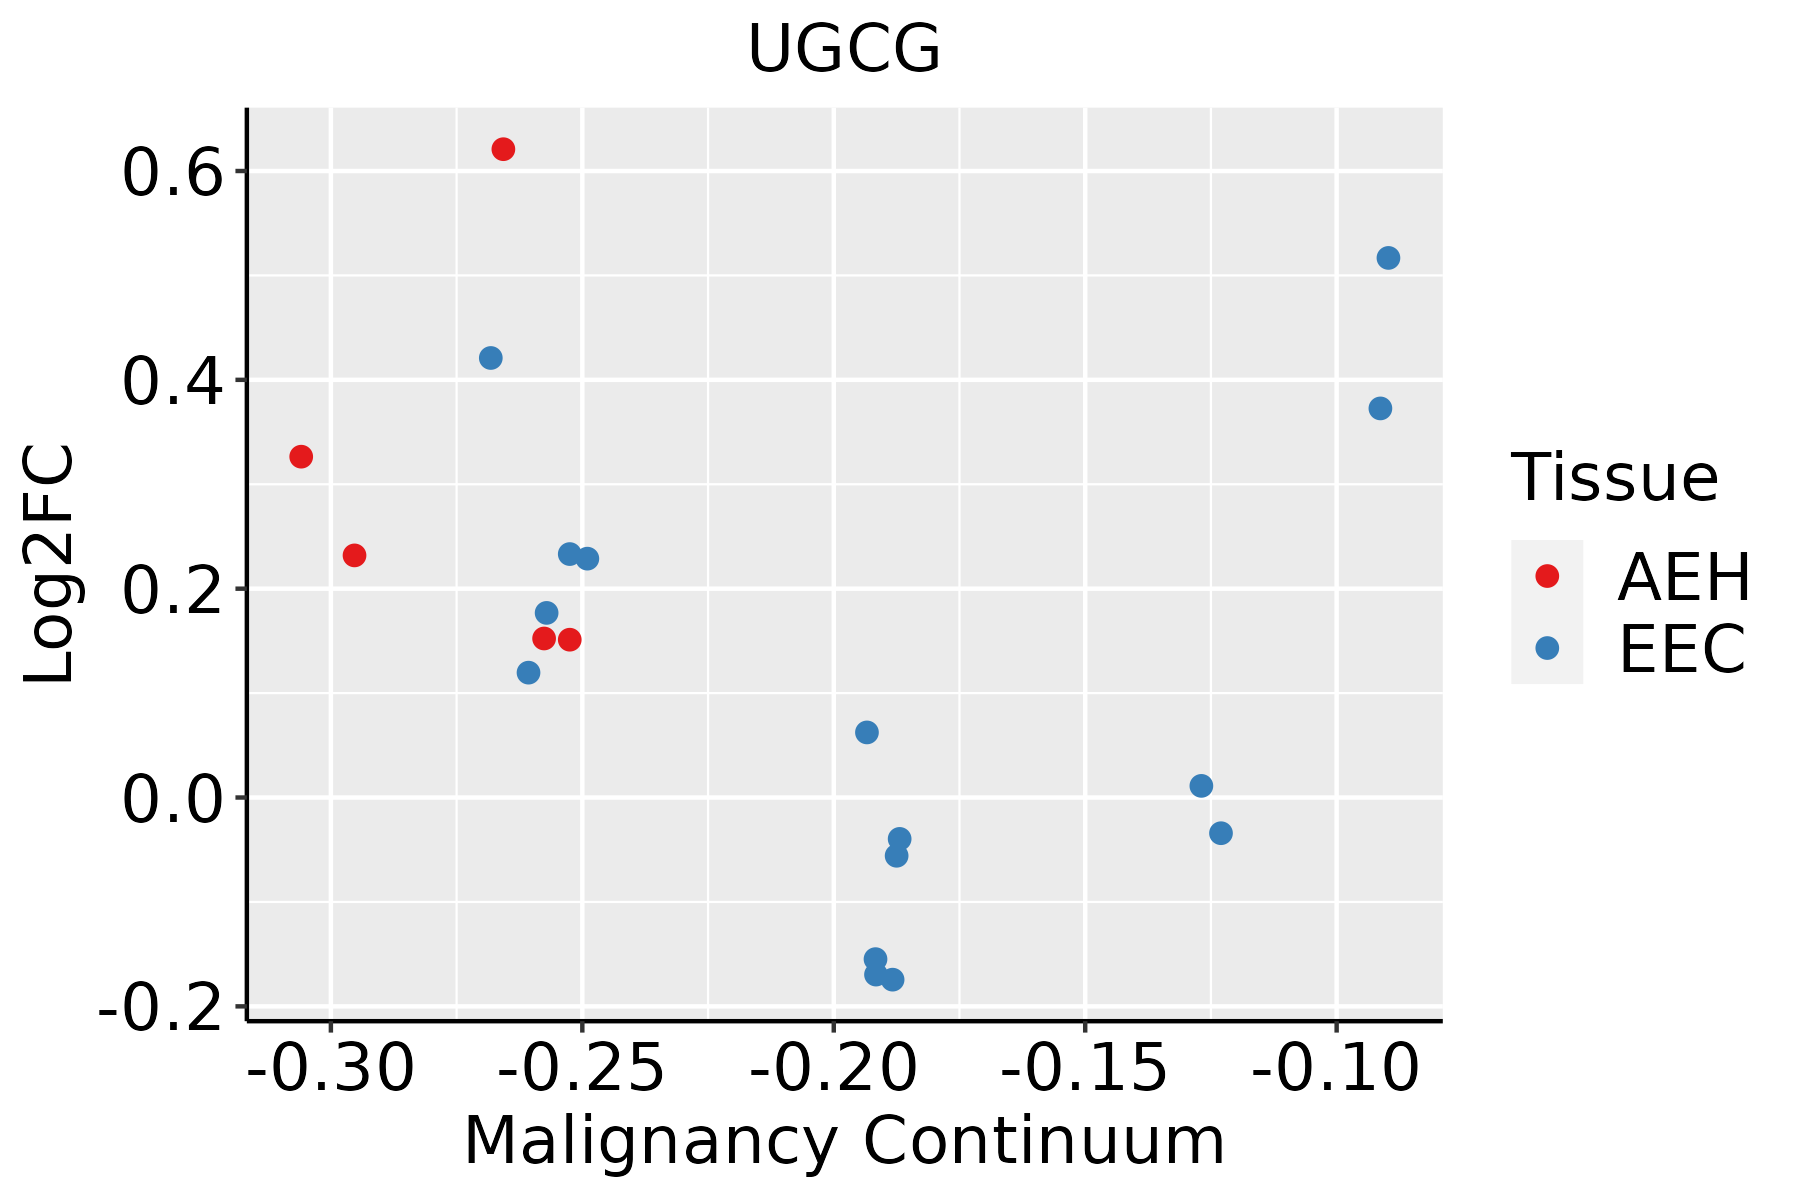 | AEH: Atypical endometrial hyperplasia |
| EEC: Endometrioid Cancer | ||
| Esophagus |  | ESCC: Esophageal squamous cell carcinoma |
| HGIN: High-grade intraepithelial neoplasias | ||
| LGIN: Low-grade intraepithelial neoplasias | ||
| GC |  | CAG: Chronic atrophic gastritis |
| CAG with IM: Chronic atrophic gastritis with intestinal metaplasia | ||
| CSG: Chronic superficial gastritis | ||
| GC: Gastric cancer | ||
| SIM: Severe intestinal metaplasia | ||
| WIM: Wild intestinal metaplasia | ||
| Liver |  | HCC: Hepatocellular carcinoma |
| NAFLD: Non-alcoholic fatty liver disease | ||
| Lung | 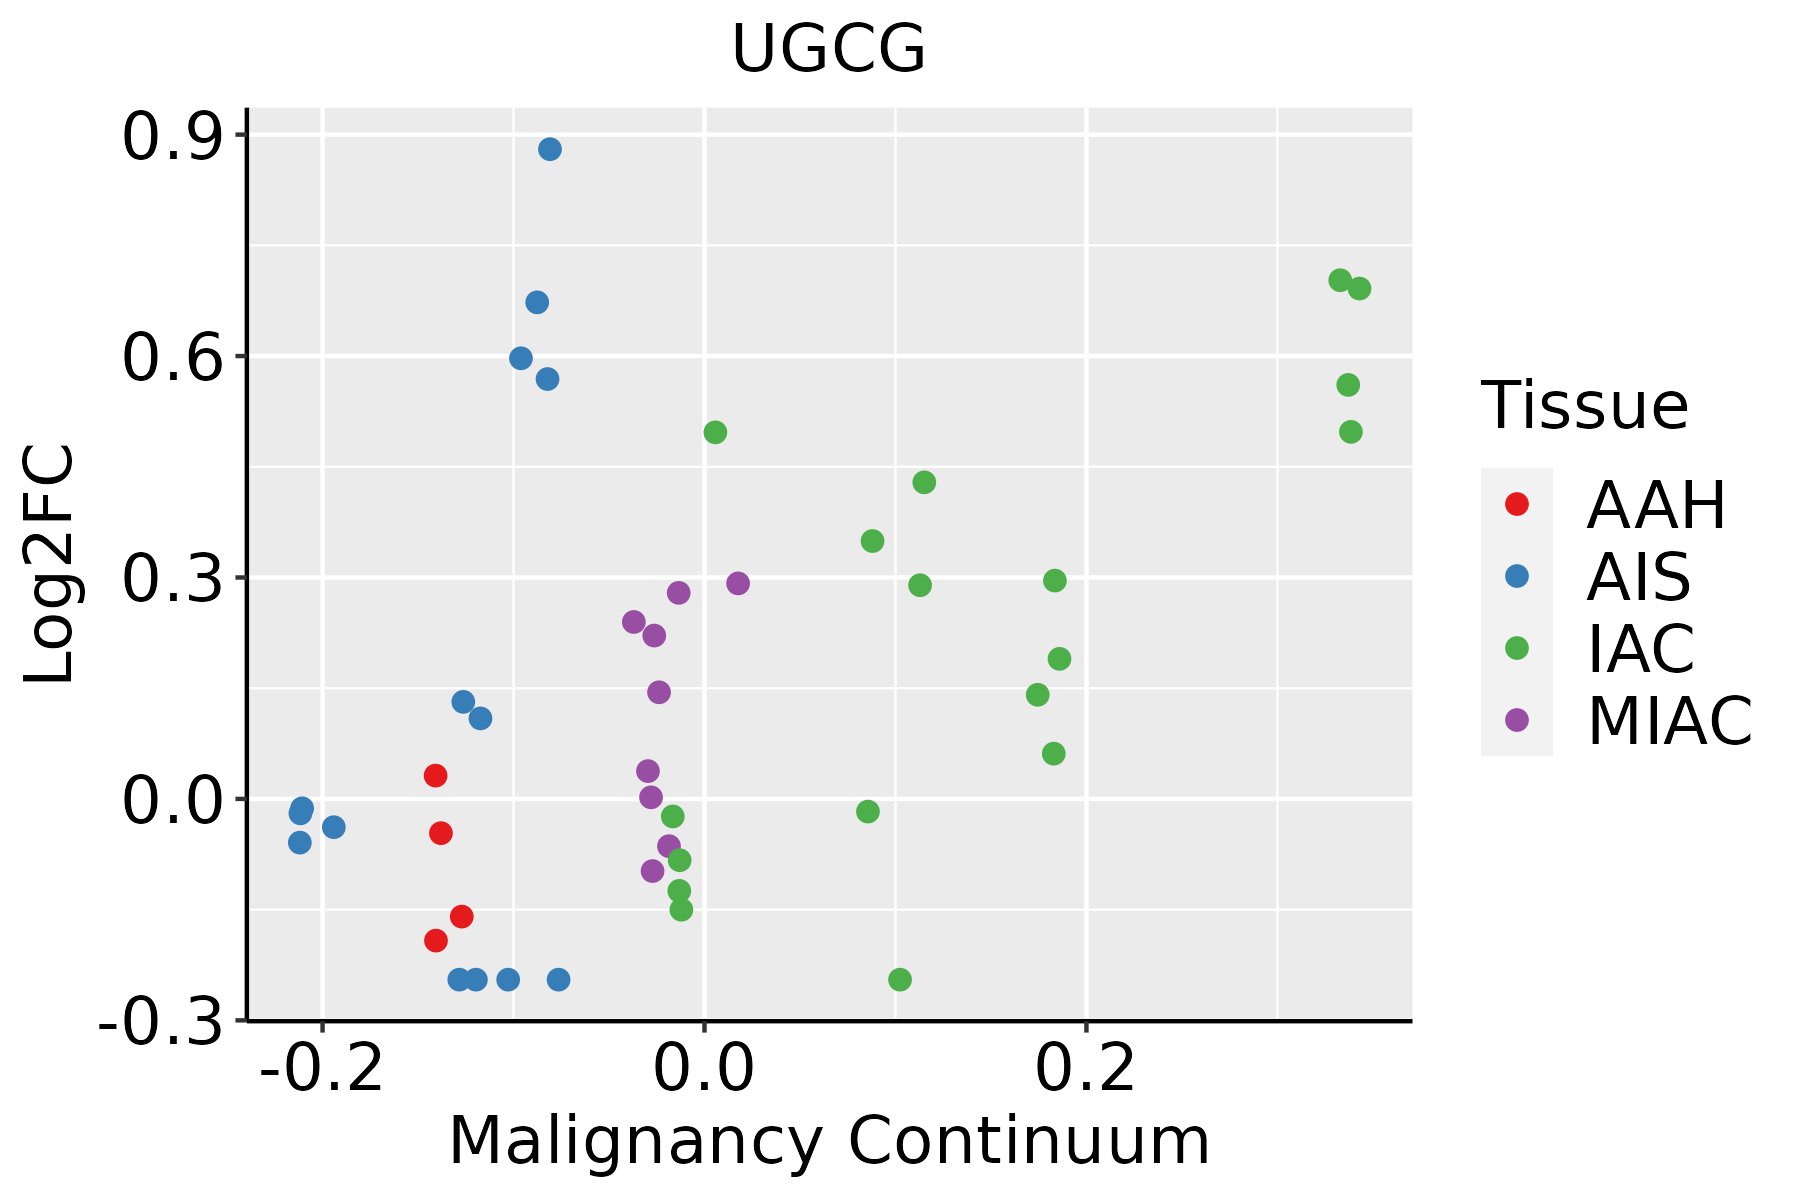 | AAH: Atypical adenomatous hyperplasia |
| AIS: Adenocarcinoma in situ | ||
| IAC: Invasive lung adenocarcinoma | ||
| MIA: Minimally invasive adenocarcinoma | ||
| Oral Cavity | 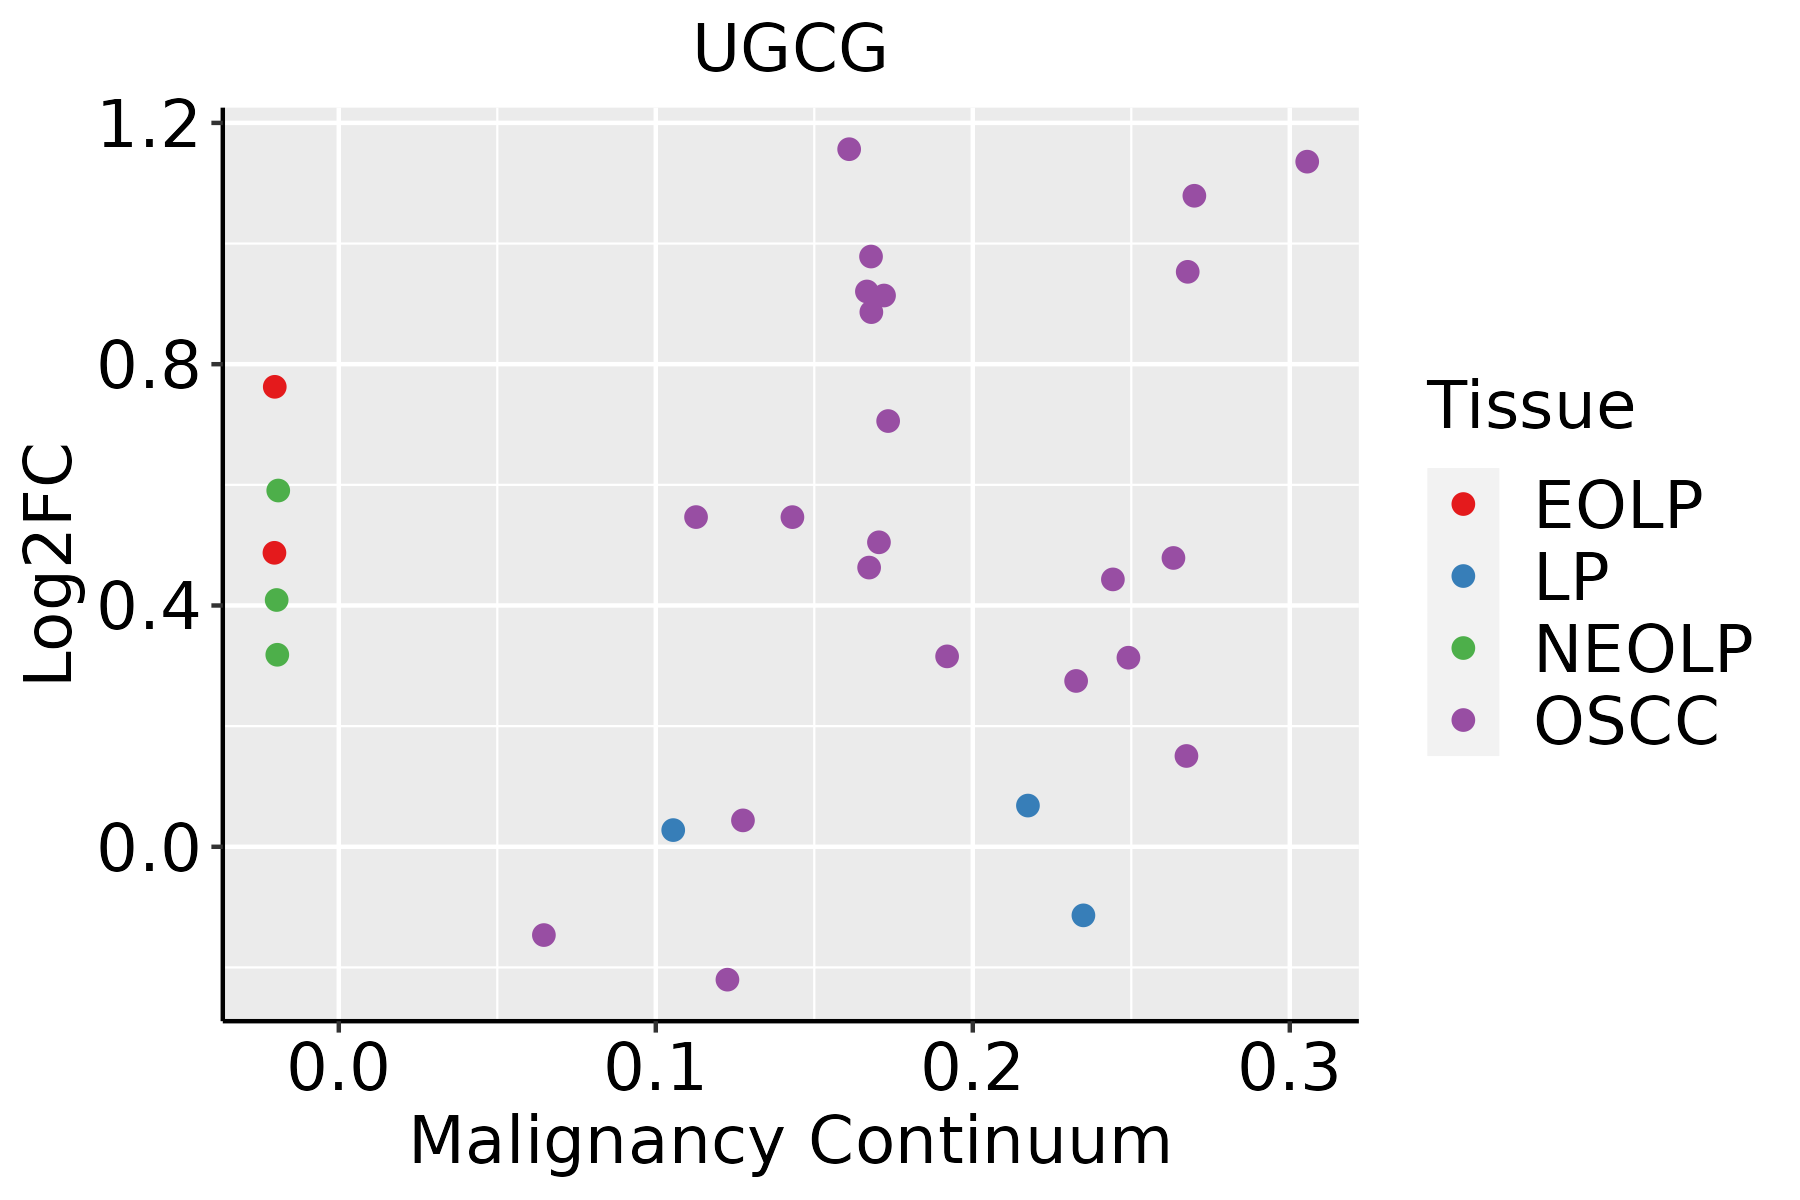 | EOLP: Erosive Oral lichen planus |
| LP: leukoplakia | ||
| NEOLP: Non-erosive oral lichen planus | ||
| OSCC: Oral squamous cell carcinoma | ||
| Prostate | 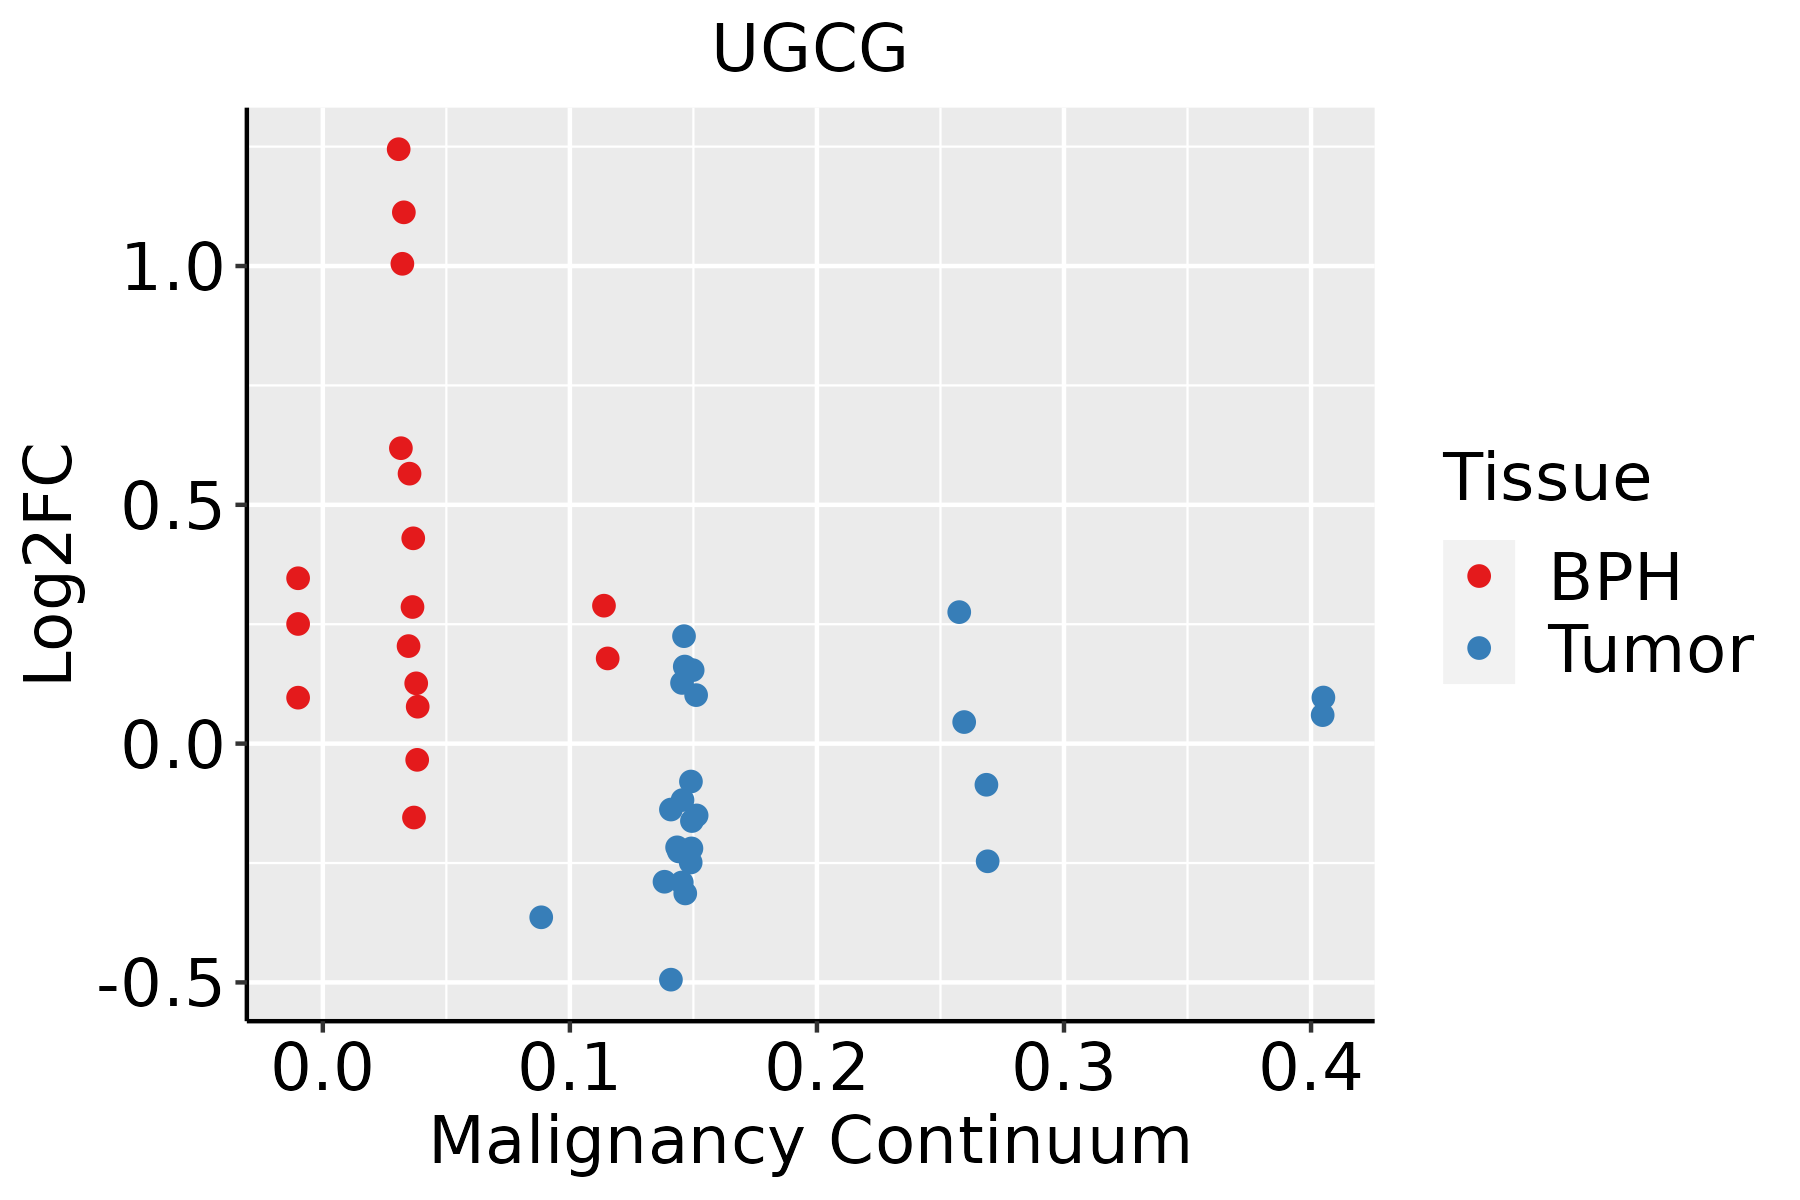 | BPH: Benign Prostatic Hyperplasia |
| Thyroid | 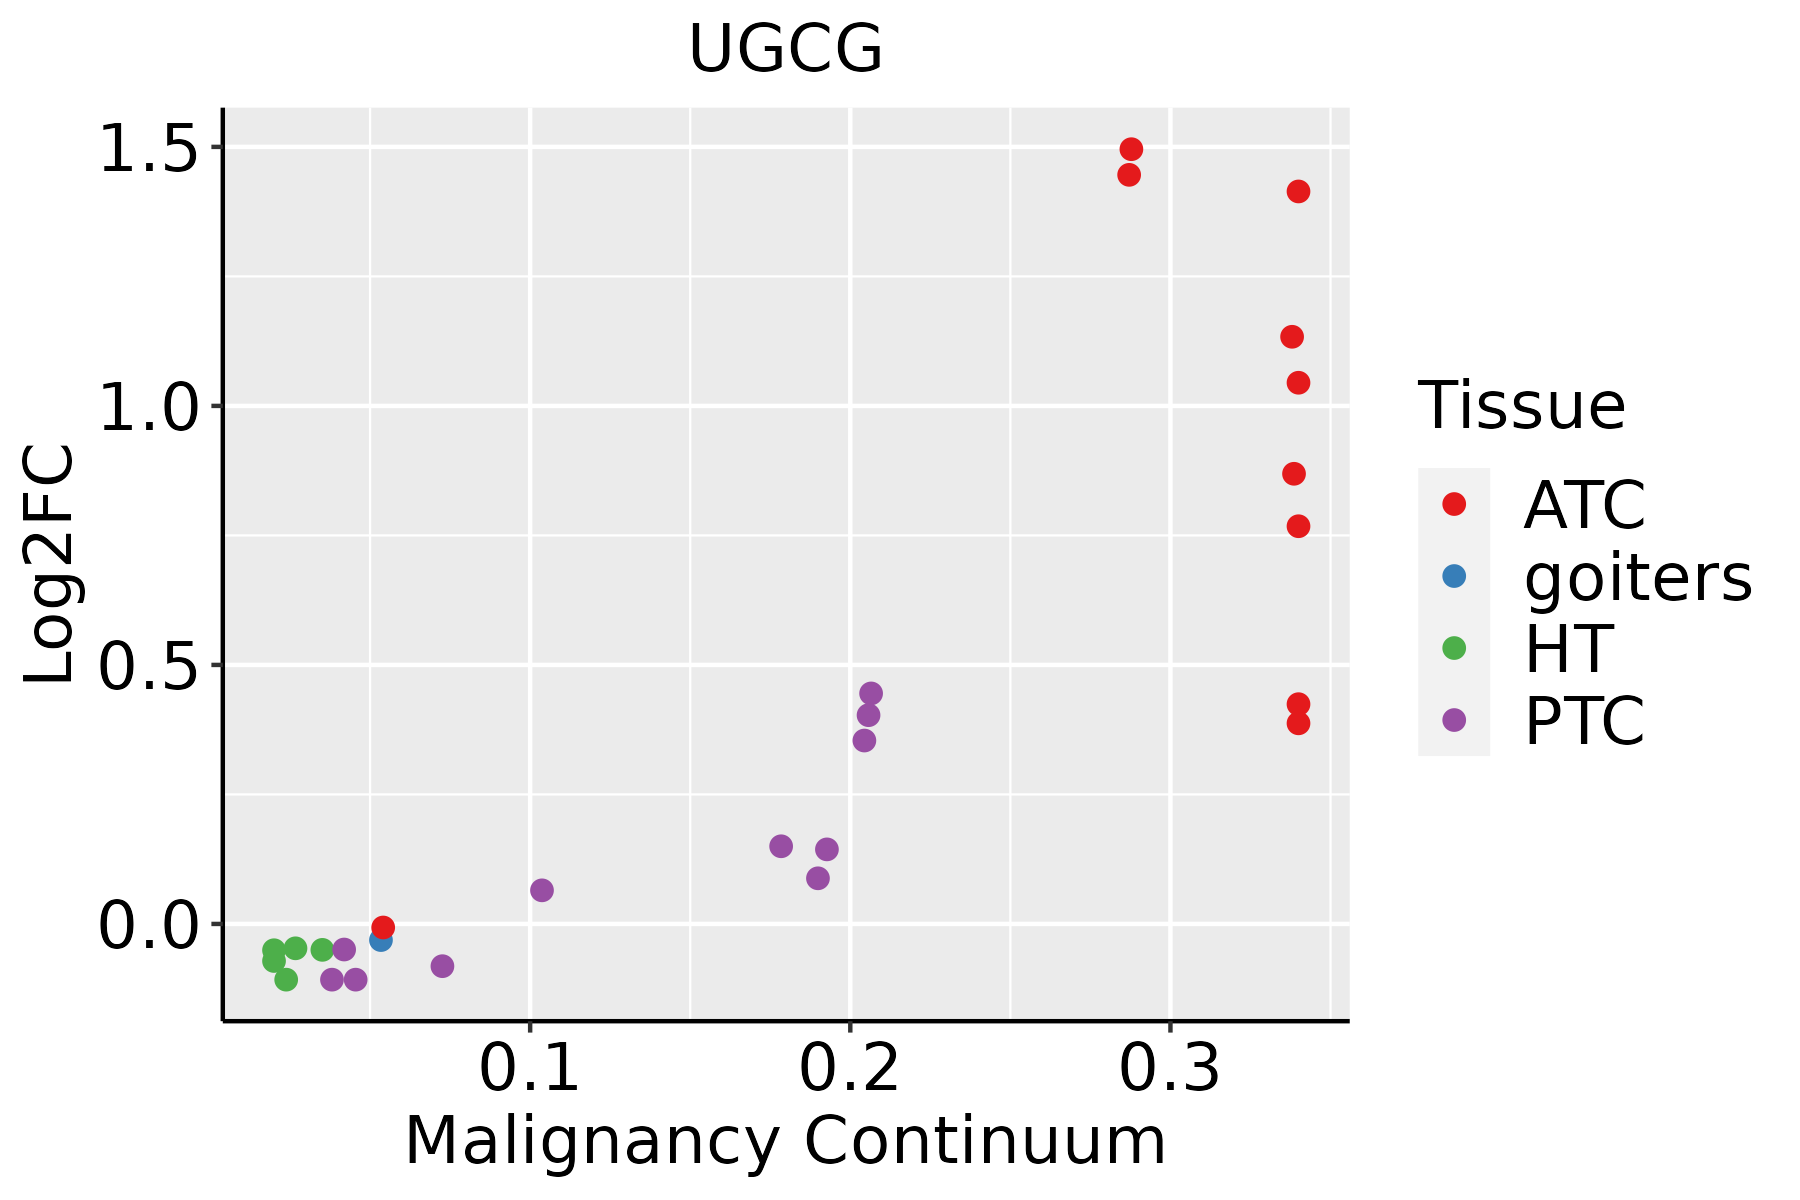 | ATC: Anaplastic thyroid cancer |
| HT: Hashimoto's thyroiditis | ||
| PTC: Papillary thyroid cancer |
| ∗log2FC in expression of this searched gene in stem-like cells from each diseased tissue sample relative to stem-like cells in normal samples in each tissue plotted against the malignancy continuum. Samples are colored based on if they are from different disease stage. |
Top |
Malignant transformation related pathway analysis |
| Find out the enriched GO biological processes and KEGG pathways involved in transition from healthy to precancer to cancer |
| Tissue | Disease Stage | Enriched GO biological Processes |
| Colorectum | AD |  |
| Colorectum | SER |  |
| Colorectum | MSS |  |
| Colorectum | MSI-H |  |
| Colorectum | FAP |  |
| ∗Top 15 enriched GO BP terms are showed in the bar plot of each disease state in each tissue. Each row represents a significant GO biological process which is colored according to the -log10(p.adjust). |
| Page: 1 2 3 4 5 6 7 8 9 |
| GO ID | Tissue | Disease Stage | Description | Gene Ratio | Bg Ratio | pvalue | p.adjust | Count |
| GO:00085446 | Cervix | CC | epidermis development | 83/2311 | 324/18723 | 3.91e-11 | 8.54e-09 | 83 |
| GO:00435884 | Cervix | CC | skin development | 71/2311 | 263/18723 | 8.04e-11 | 1.46e-08 | 71 |
| GO:00302164 | Cervix | CC | keratinocyte differentiation | 42/2311 | 139/18723 | 1.74e-08 | 1.28e-06 | 42 |
| GO:00099137 | Cervix | CC | epidermal cell differentiation | 53/2311 | 202/18723 | 5.48e-08 | 3.25e-06 | 53 |
| GO:005087810 | Cervix | CC | regulation of body fluid levels | 78/2311 | 379/18723 | 3.20e-06 | 8.77e-05 | 78 |
| GO:00192213 | Cervix | CC | cytokine-mediated signaling pathway | 84/2311 | 472/18723 | 3.25e-04 | 3.44e-03 | 84 |
| GO:00614362 | Cervix | CC | establishment of skin barrier | 10/2311 | 25/18723 | 4.52e-04 | 4.49e-03 | 10 |
| GO:00335612 | Cervix | CC | regulation of water loss via skin | 10/2311 | 27/18723 | 9.25e-04 | 7.84e-03 | 10 |
| GO:00070092 | Cervix | CC | plasma membrane organization | 28/2311 | 142/18723 | 7.85e-03 | 4.14e-02 | 28 |
| GO:005087815 | Endometrium | AEH | regulation of body fluid levels | 64/2100 | 379/18723 | 5.40e-04 | 5.44e-03 | 64 |
| GO:00435885 | Endometrium | AEH | skin development | 45/2100 | 263/18723 | 2.58e-03 | 1.90e-02 | 45 |
| GO:00085447 | Endometrium | AEH | epidermis development | 52/2100 | 324/18723 | 5.00e-03 | 3.14e-02 | 52 |
| GO:00717096 | Endometrium | AEH | membrane assembly | 12/2100 | 50/18723 | 8.00e-03 | 4.43e-02 | 12 |
| GO:005087816 | Endometrium | EEC | regulation of body fluid levels | 65/2168 | 379/18723 | 7.48e-04 | 7.05e-03 | 65 |
| GO:004358814 | Endometrium | EEC | skin development | 45/2168 | 263/18723 | 4.69e-03 | 2.99e-02 | 45 |
| GO:000854414 | Endometrium | EEC | epidermis development | 53/2168 | 324/18723 | 5.92e-03 | 3.54e-02 | 53 |
| GO:00435888 | Esophagus | ESCC | skin development | 163/8552 | 263/18723 | 6.48e-08 | 1.14e-06 | 163 |
| GO:00066433 | Esophagus | ESCC | membrane lipid metabolic process | 130/8552 | 203/18723 | 9.29e-08 | 1.54e-06 | 130 |
| GO:000854410 | Esophagus | ESCC | epidermis development | 193/8552 | 324/18723 | 2.87e-07 | 4.19e-06 | 193 |
| GO:00464673 | Esophagus | ESCC | membrane lipid biosynthetic process | 91/8552 | 142/18723 | 7.19e-06 | 7.19e-05 | 91 |
| Page: 1 2 3 4 5 6 7 8 |
| Pathway ID | Tissue | Disease Stage | Description | Gene Ratio | Bg Ratio | pvalue | p.adjust | qvalue | Count |
| hsa006003 | Esophagus | ESCC | Sphingolipid metabolism | 36/4205 | 53/8465 | 5.41e-03 | 1.36e-02 | 6.99e-03 | 36 |
| hsa0060012 | Esophagus | ESCC | Sphingolipid metabolism | 36/4205 | 53/8465 | 5.41e-03 | 1.36e-02 | 6.99e-03 | 36 |
| hsa00600 | Liver | HCC | Sphingolipid metabolism | 34/4020 | 53/8465 | 1.06e-02 | 2.71e-02 | 1.51e-02 | 34 |
| hsa006001 | Liver | HCC | Sphingolipid metabolism | 34/4020 | 53/8465 | 1.06e-02 | 2.71e-02 | 1.51e-02 | 34 |
| hsa006002 | Oral cavity | OSCC | Sphingolipid metabolism | 33/3704 | 53/8465 | 5.00e-03 | 1.20e-02 | 6.13e-03 | 33 |
| hsa0060011 | Oral cavity | OSCC | Sphingolipid metabolism | 33/3704 | 53/8465 | 5.00e-03 | 1.20e-02 | 6.13e-03 | 33 |
| Page: 1 |
Top |
Cell-cell communication analysis |
| Identification of potential cell-cell interactions between two cell types and their ligand-receptor pairs for different disease states |
| Ligand | Receptor | LRpair | Pathway | Tissue | Disease Stage |
| Page: 1 |
Top |
Single-cell gene regulatory network inference analysis |
| Find out the significant the regulons (TFs) and the target genes of each regulon across cell types for different disease states |
| TF | Cell Type | Tissue | Disease Stage | Target Gene | RSS | Regulon Activity |
| ∗The dot plots of a searched regulon are shown for all cell subpopulations in each disease state of each tissue based on the regulon specific score inferred using pySCENIC and by calculating the average expression. |
| Page: 1 |
Top |
Somatic mutation of malignant transformation related genes |
| Annotation of somatic variants for genes involved in malignant transformation |
| Hugo Symbol | Variant Class | Variant Classification | dbSNP RS | HGVSc | HGVSp | HGVSp Short | SWISSPROT | BIOTYPE | SIFT | PolyPhen | Tumor Sample Barcode | Tissue | Histology | Sex | Age | Stage | Therapy Types | Drugs | Outcome |
| UGCG | SNV | Missense_Mutation | c.706N>C | p.Asp236His | p.D236H | Q16739 | protein_coding | deleterious(0) | probably_damaging(1) | TCGA-AC-A23H-01 | Breast | breast invasive carcinoma | Female | >=65 | I/II | Unknown | Unknown | PD | |
| UGCG | SNV | Missense_Mutation | novel | c.769N>C | p.Ala257Pro | p.A257P | Q16739 | protein_coding | deleterious(0.02) | probably_damaging(0.999) | TCGA-AN-A046-01 | Breast | breast invasive carcinoma | Female | >=65 | I/II | Unknown | Unknown | SD |
| UGCG | SNV | Missense_Mutation | c.187N>T | p.Asp63Tyr | p.D63Y | Q16739 | protein_coding | deleterious(0) | probably_damaging(0.998) | TCGA-IR-A3LI-01 | Cervix | cervical & endocervical cancer | Female | <65 | I/II | Chemotherapy | cisplatin | CR | |
| UGCG | SNV | Missense_Mutation | novel | c.272N>C | p.Asp91Ala | p.D91A | Q16739 | protein_coding | tolerated(0.29) | benign(0.218) | TCGA-ZJ-AAX8-01 | Cervix | cervical & endocervical cancer | Female | <65 | III/IV | Unknown | Unknown | SD |
| UGCG | SNV | Missense_Mutation | novel | c.226N>A | p.Leu76Met | p.L76M | Q16739 | protein_coding | tolerated(0.71) | benign(0.209) | TCGA-AA-3947-01 | Colorectum | colon adenocarcinoma | Female | <65 | I/II | Unknown | Unknown | SD |
| UGCG | SNV | Missense_Mutation | novel | c.268C>A | p.His90Asn | p.H90N | Q16739 | protein_coding | tolerated(0.24) | benign(0) | TCGA-AA-A00N-01 | Colorectum | colon adenocarcinoma | Male | >=65 | I/II | Unknown | Unknown | PD |
| UGCG | SNV | Missense_Mutation | c.767T>C | p.Val256Ala | p.V256A | Q16739 | protein_coding | tolerated(0.4) | possibly_damaging(0.447) | TCGA-AD-6889-01 | Colorectum | colon adenocarcinoma | Male | >=65 | I/II | Chemotherapy | xeloda | PD | |
| UGCG | SNV | Missense_Mutation | novel | c.79T>G | p.Phe27Val | p.F27V | Q16739 | protein_coding | tolerated(0.31) | benign(0) | TCGA-CA-6717-01 | Colorectum | colon adenocarcinoma | Male | <65 | I/II | Chemotherapy | oxaliplatin | CR |
| UGCG | SNV | Missense_Mutation | c.800N>A | p.Ser267Tyr | p.S267Y | Q16739 | protein_coding | tolerated(0.05) | benign(0.011) | TCGA-AG-A002-01 | Colorectum | rectum adenocarcinoma | Male | <65 | I/II | Unknown | Unknown | SD | |
| UGCG | SNV | Missense_Mutation | novel | c.109N>A | p.Leu37Ile | p.L37I | Q16739 | protein_coding | deleterious(0.01) | possibly_damaging(0.854) | TCGA-A5-A0G1-01 | Endometrium | uterine corpus endometrioid carcinoma | Female | >=65 | I/II | Unknown | Unknown | SD |
| Page: 1 2 3 |
Top |
Related drugs of malignant transformation related genes |
| Identification of chemicals and drugs interact with genes involved in malignant transfromation |
| (DGIdb 4.0) |
| Entrez ID | Symbol | Category | Interaction Types | Drug Claim Name | Drug Name | PMIDs |
| 7357 | UGCG | ENZYME, DRUGGABLE GENOME | Eliglustat tartrate | |||
| 7357 | UGCG | ENZYME, DRUGGABLE GENOME | inhibitor | CHEMBL2103853 | ||
| 7357 | UGCG | ENZYME, DRUGGABLE GENOME | inhibitor | CHEMBL1029 | MIGLUSTAT | |
| 7357 | UGCG | ENZYME, DRUGGABLE GENOME | MIGLUSTAT | MIGLUSTAT | ||
| 7357 | UGCG | ENZYME, DRUGGABLE GENOME | ADRIAMYCIN | ADRIAMYCIN | 10702281 | |
| 7357 | UGCG | ENZYME, DRUGGABLE GENOME | ELIGLUSTAT | ELIGLUSTAT | ||
| 7357 | UGCG | ENZYME, DRUGGABLE GENOME | Miglustat | MIGLUSTAT | ||
| 7357 | UGCG | ENZYME, DRUGGABLE GENOME | GZ402671 | VENGLUSTAT | ||
| 7357 | UGCG | ENZYME, DRUGGABLE GENOME | Venglustat | VENGLUSTAT | ||
| 7357 | UGCG | ENZYME, DRUGGABLE GENOME | Genz-682452 | VENGLUSTAT |
| Page: 1 2 |

Copyright 2023-Present -The University of Texas Health Science Center at Houston |