
|
|||||
|
 | |
| |
| |
| |
| |
| |
|
Gene: UFSP2 |
Gene summary for UFSP2 |
| Gene information | Species | Human | Gene symbol | UFSP2 | Gene ID | 55325 |
| Gene name | UFM1 specific peptidase 2 | |
| Gene Alias | BHD | |
| Cytomap | 4q35.1 | |
| Gene Type | protein-coding | GO ID | GO:0006508 | UniProtAcc | B3KRI4 |
Top |
Malignant transformation analysis |
| Identification of the aberrant gene expression in precancerous and cancerous lesions by comparing the gene expression of stem-like cells in diseased tissues with normal stem cells |
| Entrez ID | Symbol | Replicates | Species | Organ | Tissue | Adj P-value | Log2FC | Malignancy |
| 55325 | UFSP2 | LZE4T | Human | Esophagus | ESCC | 1.31e-13 | 3.67e-01 | 0.0811 |
| 55325 | UFSP2 | LZE5T | Human | Esophagus | ESCC | 1.75e-02 | 3.07e-01 | 0.0514 |
| 55325 | UFSP2 | LZE8T | Human | Esophagus | ESCC | 4.13e-02 | 3.97e-02 | 0.067 |
| 55325 | UFSP2 | LZE20T | Human | Esophagus | ESCC | 3.38e-02 | 3.77e-02 | 0.0662 |
| 55325 | UFSP2 | LZE24T | Human | Esophagus | ESCC | 1.19e-11 | 2.54e-01 | 0.0596 |
| 55325 | UFSP2 | P1T-E | Human | Esophagus | ESCC | 6.01e-11 | 4.89e-01 | 0.0875 |
| 55325 | UFSP2 | P2T-E | Human | Esophagus | ESCC | 2.15e-29 | 5.16e-01 | 0.1177 |
| 55325 | UFSP2 | P4T-E | Human | Esophagus | ESCC | 1.09e-22 | 4.31e-01 | 0.1323 |
| 55325 | UFSP2 | P5T-E | Human | Esophagus | ESCC | 3.87e-19 | 3.24e-01 | 0.1327 |
| 55325 | UFSP2 | P8T-E | Human | Esophagus | ESCC | 3.74e-15 | 2.91e-01 | 0.0889 |
| 55325 | UFSP2 | P9T-E | Human | Esophagus | ESCC | 2.24e-13 | 2.63e-01 | 0.1131 |
| 55325 | UFSP2 | P10T-E | Human | Esophagus | ESCC | 1.46e-21 | 2.85e-01 | 0.116 |
| 55325 | UFSP2 | P11T-E | Human | Esophagus | ESCC | 1.28e-17 | 5.15e-01 | 0.1426 |
| 55325 | UFSP2 | P12T-E | Human | Esophagus | ESCC | 9.22e-30 | 6.14e-01 | 0.1122 |
| 55325 | UFSP2 | P15T-E | Human | Esophagus | ESCC | 2.15e-21 | 3.67e-01 | 0.1149 |
| 55325 | UFSP2 | P16T-E | Human | Esophagus | ESCC | 2.40e-20 | 5.30e-01 | 0.1153 |
| 55325 | UFSP2 | P17T-E | Human | Esophagus | ESCC | 2.66e-07 | 3.61e-01 | 0.1278 |
| 55325 | UFSP2 | P19T-E | Human | Esophagus | ESCC | 1.15e-10 | 5.92e-01 | 0.1662 |
| 55325 | UFSP2 | P20T-E | Human | Esophagus | ESCC | 1.56e-16 | 2.87e-01 | 0.1124 |
| 55325 | UFSP2 | P21T-E | Human | Esophagus | ESCC | 3.77e-28 | 3.92e-01 | 0.1617 |
| Page: 1 2 3 4 5 6 |
| Tissue | Expression Dynamics | Abbreviation |
| Esophagus | 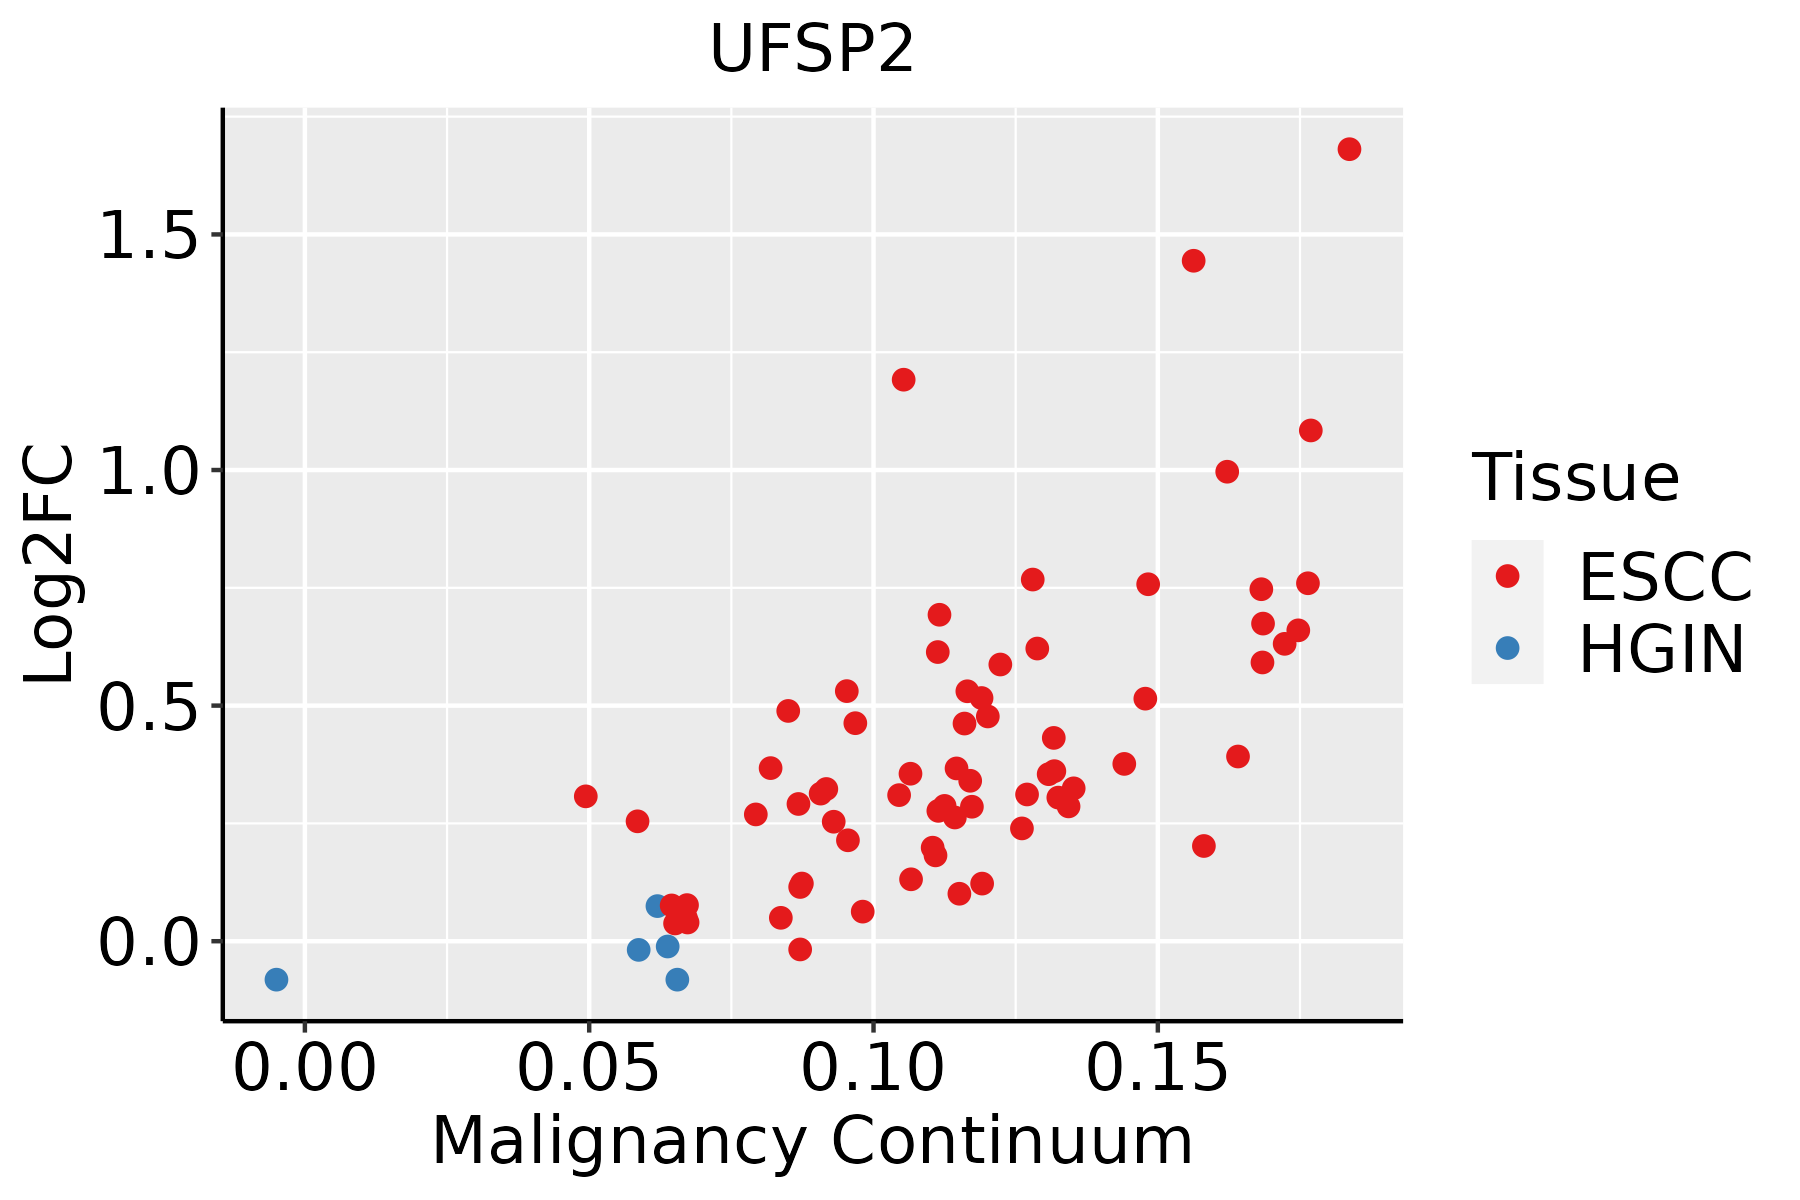 | ESCC: Esophageal squamous cell carcinoma |
| HGIN: High-grade intraepithelial neoplasias | ||
| LGIN: Low-grade intraepithelial neoplasias | ||
| Liver | 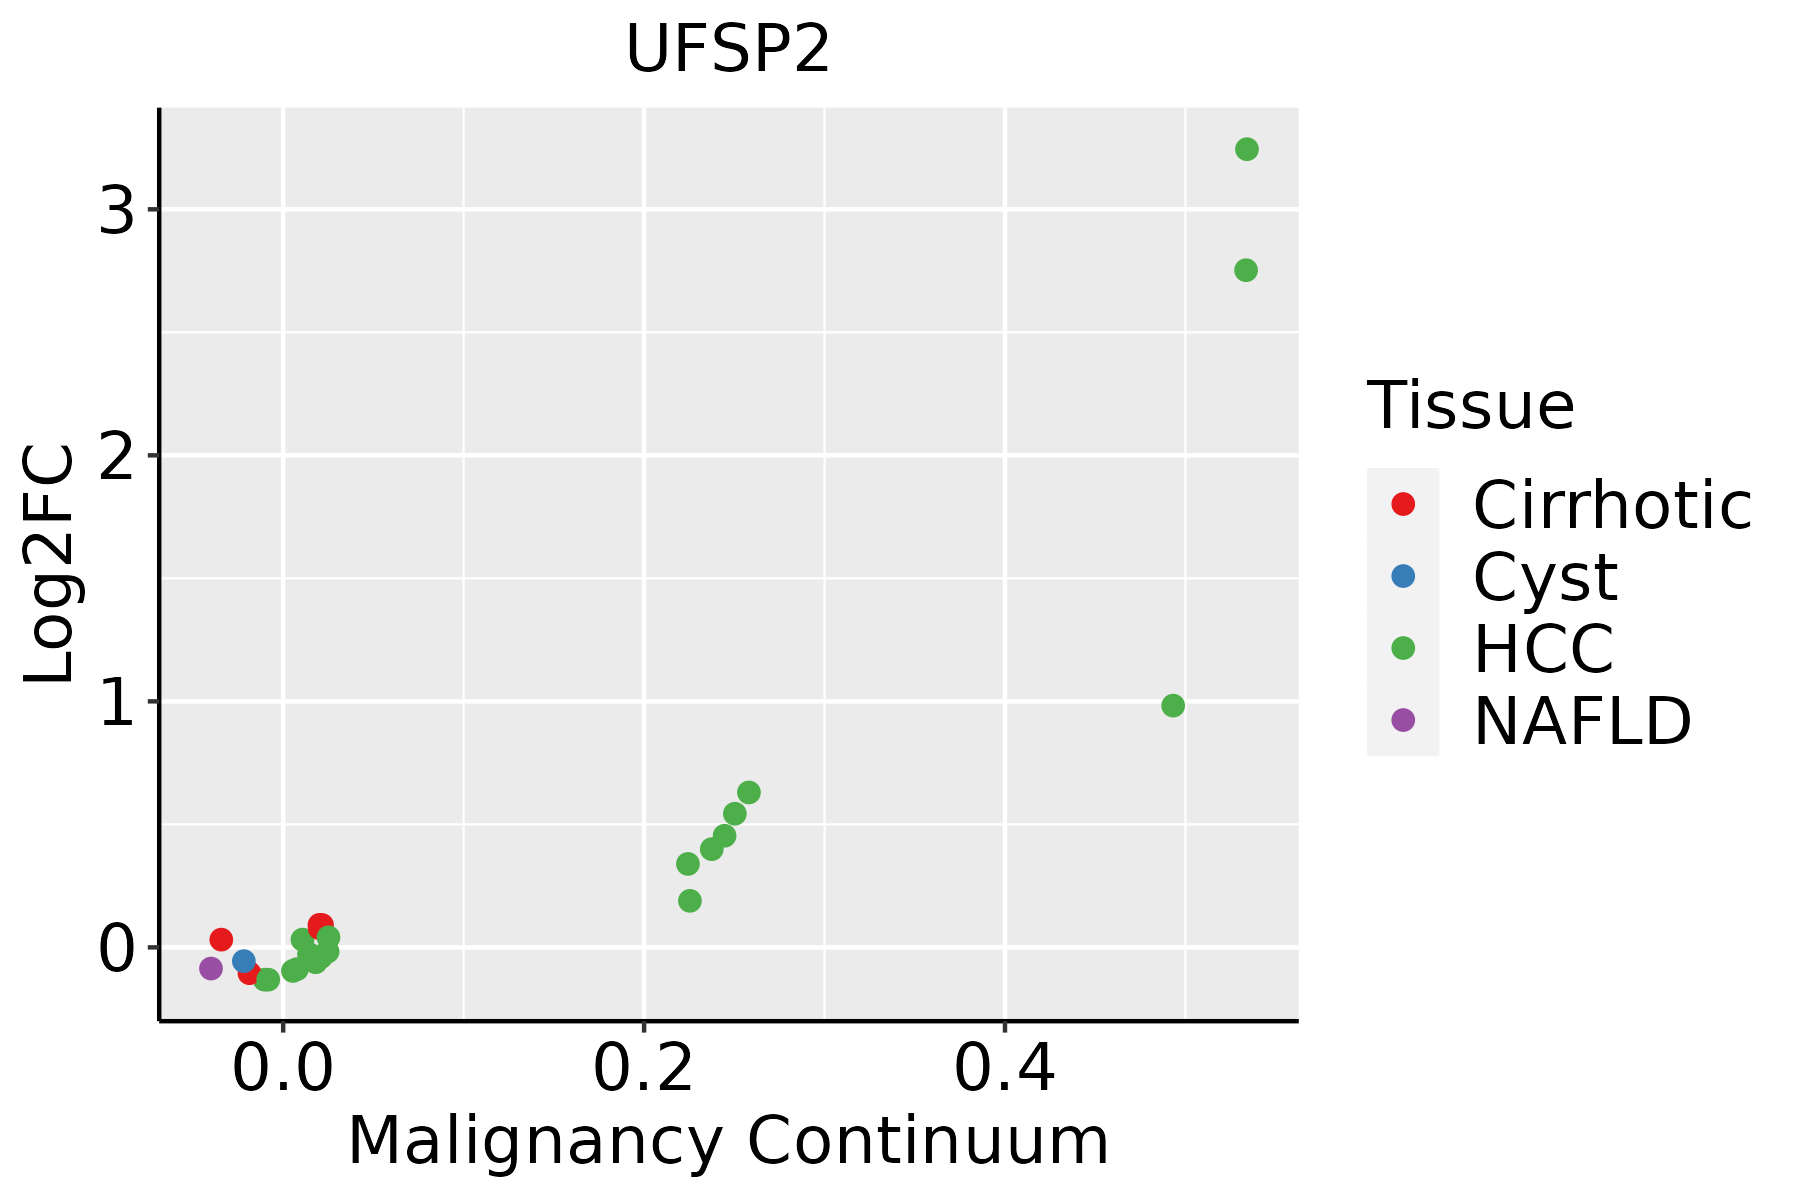 | HCC: Hepatocellular carcinoma |
| NAFLD: Non-alcoholic fatty liver disease | ||
| Oral Cavity |  | EOLP: Erosive Oral lichen planus |
| LP: leukoplakia | ||
| NEOLP: Non-erosive oral lichen planus | ||
| OSCC: Oral squamous cell carcinoma | ||
| Skin | 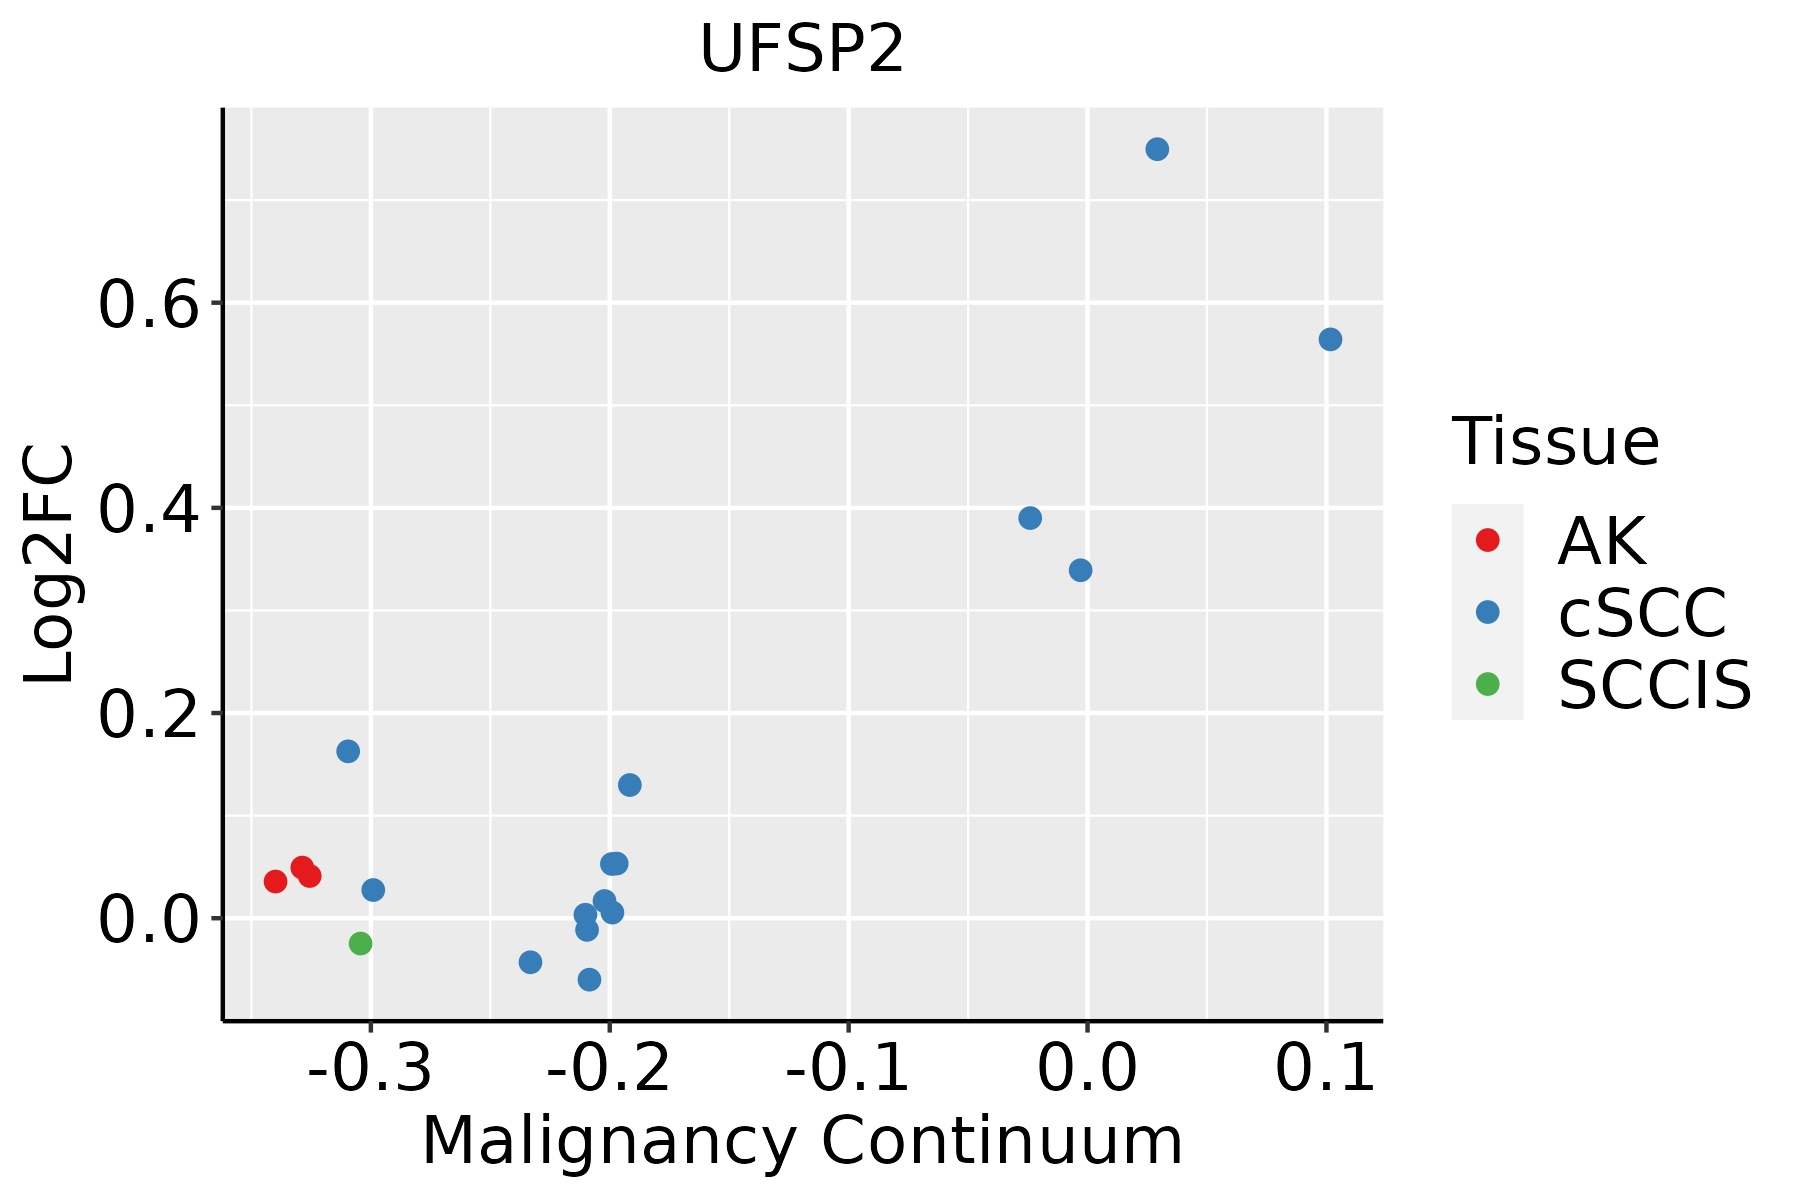 | AK: Actinic keratosis |
| cSCC: Cutaneous squamous cell carcinoma | ||
| SCCIS:squamous cell carcinoma in situ | ||
| Thyroid | 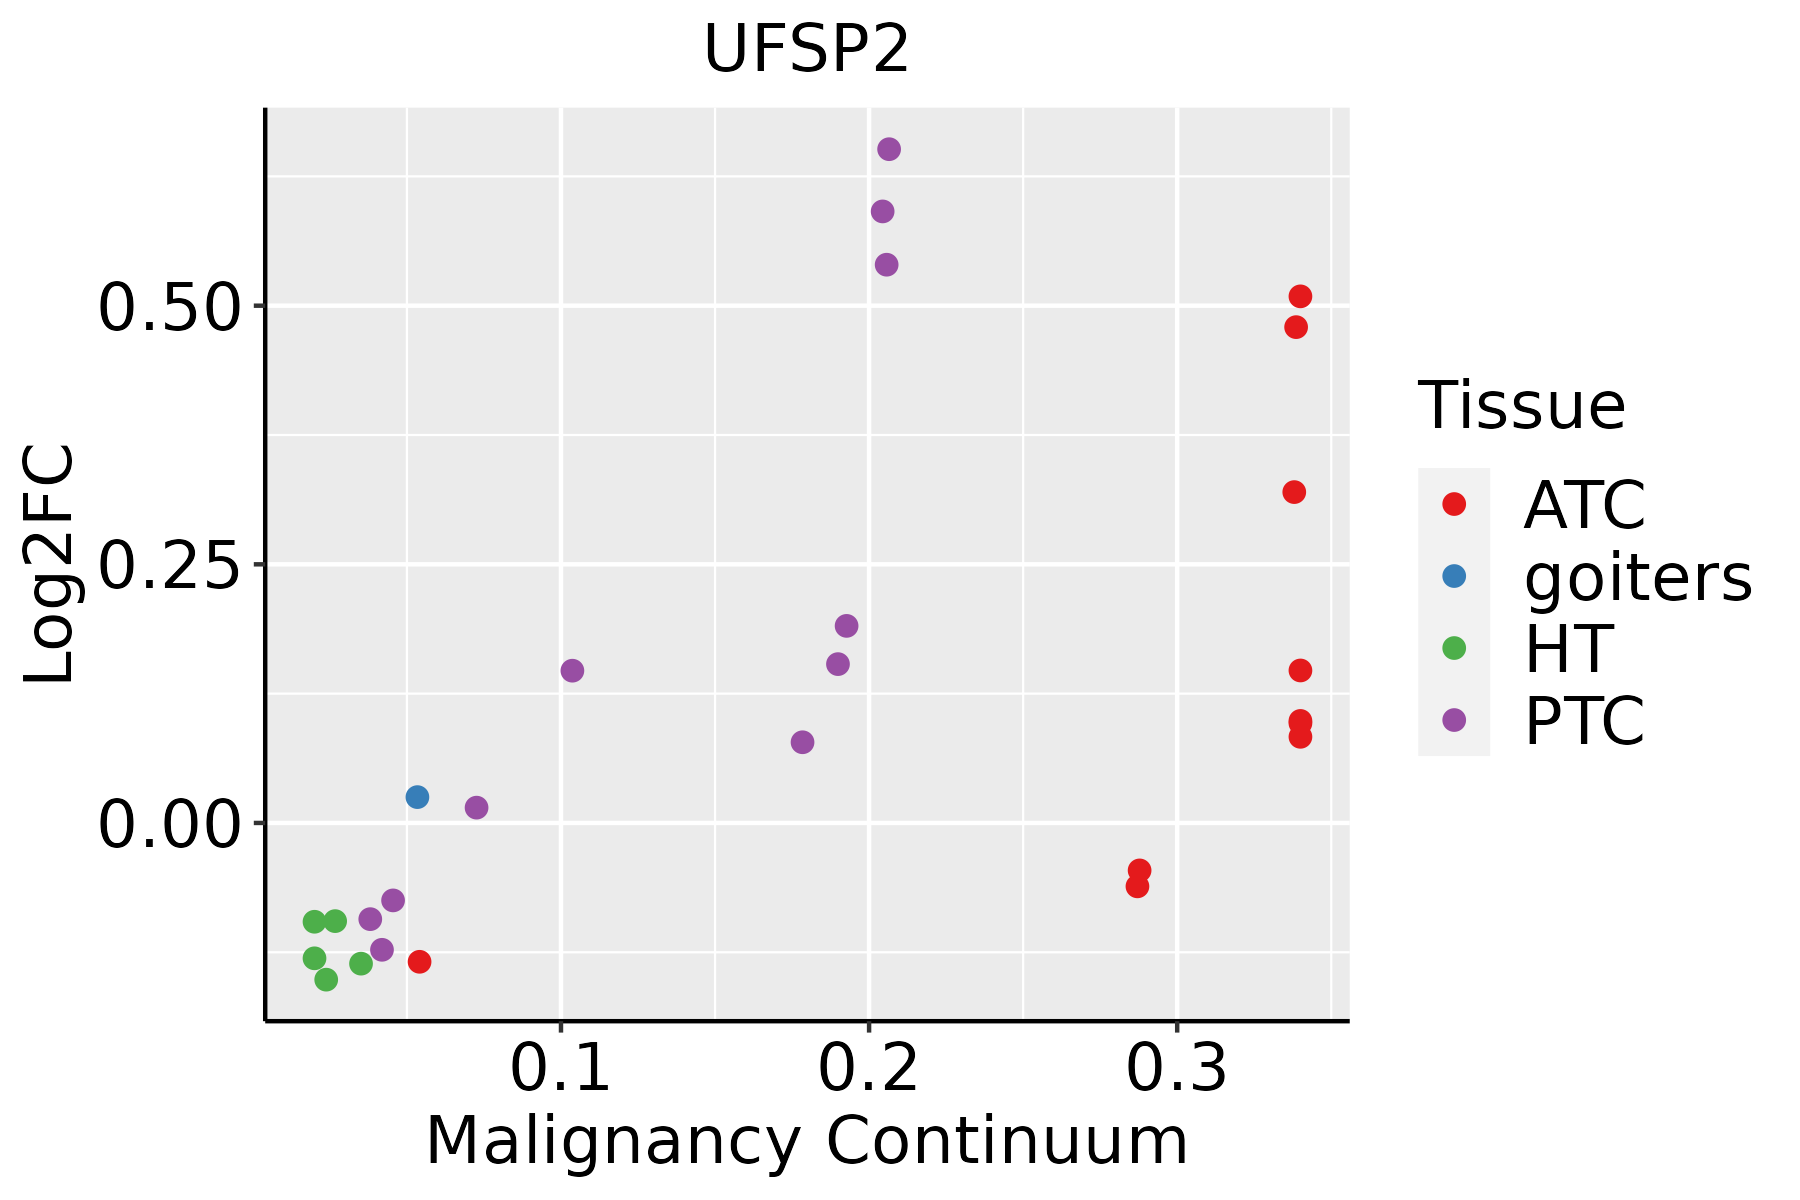 | ATC: Anaplastic thyroid cancer |
| HT: Hashimoto's thyroiditis | ||
| PTC: Papillary thyroid cancer |
| ∗log2FC in expression of this searched gene in stem-like cells from each diseased tissue sample relative to stem-like cells in normal samples in each tissue plotted against the malignancy continuum. Samples are colored based on if they are from different disease stage. |
Top |
Malignant transformation related pathway analysis |
| Find out the enriched GO biological processes and KEGG pathways involved in transition from healthy to precancer to cancer |
| Tissue | Disease Stage | Enriched GO biological Processes |
| Colorectum | AD |  |
| Colorectum | SER |  |
| Colorectum | MSS |  |
| Colorectum | MSI-H |  |
| Colorectum | FAP |  |
| ∗Top 15 enriched GO BP terms are showed in the bar plot of each disease state in each tissue. Each row represents a significant GO biological process which is colored according to the -log10(p.adjust). |
| Page: 1 2 3 4 5 6 7 8 9 |
| GO ID | Tissue | Disease Stage | Description | Gene Ratio | Bg Ratio | pvalue | p.adjust | Count |
| GO:0030522110 | Esophagus | ESCC | intracellular receptor signaling pathway | 170/8552 | 265/18723 | 8.58e-10 | 2.09e-08 | 170 |
| GO:0048545111 | Esophagus | ESCC | response to steroid hormone | 204/8552 | 339/18723 | 4.47e-08 | 8.11e-07 | 204 |
| GO:0071383110 | Esophagus | ESCC | cellular response to steroid hormone stimulus | 127/8552 | 204/18723 | 1.26e-06 | 1.55e-05 | 127 |
| GO:003051819 | Esophagus | ESCC | intracellular steroid hormone receptor signaling pathway | 76/8552 | 116/18723 | 1.25e-05 | 1.15e-04 | 76 |
| GO:004340119 | Esophagus | ESCC | steroid hormone mediated signaling pathway | 87/8552 | 136/18723 | 1.25e-05 | 1.15e-04 | 87 |
| GO:00331438 | Esophagus | ESCC | regulation of intracellular steroid hormone receptor signaling pathway | 50/8552 | 74/18723 | 1.16e-04 | 8.04e-04 | 50 |
| GO:000975516 | Esophagus | ESCC | hormone-mediated signaling pathway | 106/8552 | 190/18723 | 3.13e-03 | 1.30e-02 | 106 |
| GO:003052014 | Esophagus | ESCC | intracellular estrogen receptor signaling pathway | 35/8552 | 54/18723 | 3.55e-03 | 1.45e-02 | 35 |
| GO:00331463 | Esophagus | ESCC | regulation of intracellular estrogen receptor signaling pathway | 23/8552 | 35/18723 | 1.34e-02 | 4.38e-02 | 23 |
| GO:004854512 | Liver | Cirrhotic | response to steroid hormone | 146/4634 | 339/18723 | 7.87e-14 | 6.76e-12 | 146 |
| GO:007138312 | Liver | Cirrhotic | cellular response to steroid hormone stimulus | 90/4634 | 204/18723 | 1.04e-09 | 4.70e-08 | 90 |
| GO:003052212 | Liver | Cirrhotic | intracellular receptor signaling pathway | 105/4634 | 265/18723 | 5.44e-08 | 1.69e-06 | 105 |
| GO:004340111 | Liver | Cirrhotic | steroid hormone mediated signaling pathway | 58/4634 | 136/18723 | 3.44e-06 | 5.95e-05 | 58 |
| GO:003051811 | Liver | Cirrhotic | intracellular steroid hormone receptor signaling pathway | 50/4634 | 116/18723 | 1.11e-05 | 1.59e-04 | 50 |
| GO:000975511 | Liver | Cirrhotic | hormone-mediated signaling pathway | 71/4634 | 190/18723 | 7.09e-05 | 7.98e-04 | 71 |
| GO:003314311 | Liver | Cirrhotic | regulation of intracellular steroid hormone receptor signaling pathway | 30/4634 | 74/18723 | 1.97e-03 | 1.23e-02 | 30 |
| GO:003052011 | Liver | Cirrhotic | intracellular estrogen receptor signaling pathway | 23/4634 | 54/18723 | 3.02e-03 | 1.72e-02 | 23 |
| GO:003052222 | Liver | HCC | intracellular receptor signaling pathway | 171/7958 | 265/18723 | 3.00e-13 | 1.61e-11 | 171 |
| GO:004854522 | Liver | HCC | response to steroid hormone | 206/7958 | 339/18723 | 6.81e-12 | 2.92e-10 | 206 |
| GO:007138322 | Liver | HCC | cellular response to steroid hormone stimulus | 128/7958 | 204/18723 | 3.92e-09 | 1.04e-07 | 128 |
| Page: 1 2 3 4 |
| Pathway ID | Tissue | Disease Stage | Description | Gene Ratio | Bg Ratio | pvalue | p.adjust | qvalue | Count |
| Page: 1 |
Top |
Cell-cell communication analysis |
| Identification of potential cell-cell interactions between two cell types and their ligand-receptor pairs for different disease states |
| Ligand | Receptor | LRpair | Pathway | Tissue | Disease Stage |
| Page: 1 |
Top |
Single-cell gene regulatory network inference analysis |
| Find out the significant the regulons (TFs) and the target genes of each regulon across cell types for different disease states |
| TF | Cell Type | Tissue | Disease Stage | Target Gene | RSS | Regulon Activity |
| ∗The dot plots of a searched regulon are shown for all cell subpopulations in each disease state of each tissue based on the regulon specific score inferred using pySCENIC and by calculating the average expression. |
| Page: 1 |
Top |
Somatic mutation of malignant transformation related genes |
| Annotation of somatic variants for genes involved in malignant transformation |
| Hugo Symbol | Variant Class | Variant Classification | dbSNP RS | HGVSc | HGVSp | HGVSp Short | SWISSPROT | BIOTYPE | SIFT | PolyPhen | Tumor Sample Barcode | Tissue | Histology | Sex | Age | Stage | Therapy Types | Drugs | Outcome |
| UFSP2 | SNV | Missense_Mutation | c.403G>A | p.Glu135Lys | p.E135K | Q9NUQ7 | protein_coding | tolerated(0.56) | benign(0.006) | TCGA-BH-A2L8-01 | Breast | breast invasive carcinoma | Female | <65 | I/II | Chemotherapy | cytoxan | CR | |
| UFSP2 | SNV | Missense_Mutation | rs147049967 | c.402T>G | p.Ile134Met | p.I134M | Q9NUQ7 | protein_coding | deleterious(0) | benign(0.246) | TCGA-BH-A2L8-01 | Breast | breast invasive carcinoma | Female | <65 | I/II | Chemotherapy | cytoxan | CR |
| UFSP2 | SNV | Missense_Mutation | novel | c.52N>C | p.Asp18His | p.D18H | Q9NUQ7 | protein_coding | deleterious(0.04) | possibly_damaging(0.554) | TCGA-BH-A5IZ-01 | Breast | breast invasive carcinoma | Female | <65 | I/II | Chemotherapy | adriamycin | CR |
| UFSP2 | insertion | Nonsense_Mutation | novel | c.103_104insATTTATAATA | p.Leu35HisfsTer3 | p.L35Hfs*3 | Q9NUQ7 | protein_coding | TCGA-AC-A3QQ-01 | Breast | breast invasive carcinoma | Female | <65 | I/II | Unknown | Unknown | SD | ||
| UFSP2 | SNV | Missense_Mutation | novel | c.835T>C | p.Tyr279His | p.Y279H | Q9NUQ7 | protein_coding | tolerated(0.28) | benign(0.011) | TCGA-2W-A8YY-01 | Cervix | cervical & endocervical cancer | Female | <65 | I/II | Chemotherapy | cisplatin | CR |
| UFSP2 | SNV | Missense_Mutation | rs781397551 | c.84N>C | p.Glu28Asp | p.E28D | Q9NUQ7 | protein_coding | tolerated(0.39) | benign(0) | TCGA-FU-A3HZ-01 | Cervix | cervical & endocervical cancer | Female | <65 | I/II | Chemotherapy | cisplatin | CR |
| UFSP2 | SNV | Missense_Mutation | novel | c.277G>A | p.Glu93Lys | p.E93K | Q9NUQ7 | protein_coding | deleterious(0.02) | benign(0.156) | TCGA-VS-A9V5-01 | Cervix | cervical & endocervical cancer | Female | <65 | I/II | Chemotherapy | carboplatin | PD |
| UFSP2 | SNV | Missense_Mutation | c.620A>C | p.Lys207Thr | p.K207T | Q9NUQ7 | protein_coding | tolerated(0.51) | benign(0.015) | TCGA-AA-3510-01 | Colorectum | colon adenocarcinoma | Male | >=65 | I/II | Unknown | Unknown | SD | |
| UFSP2 | SNV | Missense_Mutation | c.620N>C | p.Lys207Thr | p.K207T | Q9NUQ7 | protein_coding | tolerated(0.51) | benign(0.015) | TCGA-AA-A00N-01 | Colorectum | colon adenocarcinoma | Male | >=65 | I/II | Unknown | Unknown | PD | |
| UFSP2 | SNV | Missense_Mutation | c.1198G>A | p.Gly400Arg | p.G400R | Q9NUQ7 | protein_coding | deleterious(0) | probably_damaging(1) | TCGA-AD-6889-01 | Colorectum | colon adenocarcinoma | Male | >=65 | I/II | Chemotherapy | xeloda | PD |
| Page: 1 2 3 4 5 6 |
Top |
Related drugs of malignant transformation related genes |
| Identification of chemicals and drugs interact with genes involved in malignant transfromation |
| (DGIdb 4.0) |
| Entrez ID | Symbol | Category | Interaction Types | Drug Claim Name | Drug Name | PMIDs |
| Page: 1 |

Copyright 2023-Present -The University of Texas Health Science Center at Houston |