Schematic overview of the cellular and molecular mechanisms involved in the cancer progression, including the proposed cellular and molecular mechanisms in cancer cells trajectory. AT1: alveolar type 1 cells; AT2: alveolar type 2 cells; AAH: atypical adenomatous hyperplasia; AIS: adenocarcinoma in situ; MIA: minimally invasive adenocarcinoma; IA: invasive adenocarcinoma; EMT: epithelial-mesenchymal transition

Home

Download

Statistics

Help

Contact

Center for Computational Systems Medicine
leaf

Gene summary

leaf

Malignant transformation analysis

leaf

Malignant transformation related pathway analysis

leaf

Cell-cell communication analysis

leaf

Single-cell gene regulatory network inference analysis

leaf

Somatic mutation of malignant transformation related genes

leaf

Related drugs of malignant transformation related genes

Gene: UFL1

Gene summary for UFL1

check button Gene summary.

Gene informationSpeciesHuman
Gene symbol

UFL1

Gene ID

23376

Gene nameUFM1 specific ligase 1
Gene AliasKIAA0776
Cytomap6q16.1
Gene Typeprotein-coding
GO ID

GO:0001101

UniProtAcc

O94874


Top

Malignant transformation analysis

check button Identification of the aberrant gene expression in precancerous and cancerous lesions by comparing the gene expression of stem-like cells in diseased tissues with normal stem cells
check button Malignant transformation involving gene list.
Entrez IDSymbolReplicatesSpeciesOrganTissueAdj P-valueLog2FCMalignancy
23376UFL1LZE4THumanEsophagusESCC1.27e-155.12e-010.0811
23376UFL1LZE7THumanEsophagusESCC2.77e-024.03e-010.0667
23376UFL1LZE8THumanEsophagusESCC6.64e-072.02e-010.067
23376UFL1LZE20THumanEsophagusESCC1.17e-031.98e-010.0662
23376UFL1LZE24THumanEsophagusESCC1.36e-114.11e-010.0596
23376UFL1LZE21THumanEsophagusESCC2.69e-043.14e-010.0655
23376UFL1P1T-EHumanEsophagusESCC1.97e-085.40e-010.0875
23376UFL1P2T-EHumanEsophagusESCC1.54e-398.06e-010.1177
23376UFL1P4T-EHumanEsophagusESCC4.33e-296.27e-010.1323
23376UFL1P5T-EHumanEsophagusESCC1.08e-204.64e-010.1327
23376UFL1P8T-EHumanEsophagusESCC3.25e-325.92e-010.0889
23376UFL1P9T-EHumanEsophagusESCC1.72e-082.53e-010.1131
23376UFL1P10T-EHumanEsophagusESCC5.17e-305.84e-010.116
23376UFL1P11T-EHumanEsophagusESCC3.79e-177.24e-010.1426
23376UFL1P12T-EHumanEsophagusESCC5.28e-387.66e-010.1122
23376UFL1P15T-EHumanEsophagusESCC1.26e-143.98e-010.1149
23376UFL1P16T-EHumanEsophagusESCC1.92e-559.89e-010.1153
23376UFL1P17T-EHumanEsophagusESCC2.87e-043.69e-010.1278
23376UFL1P20T-EHumanEsophagusESCC2.38e-173.49e-010.1124
23376UFL1P21T-EHumanEsophagusESCC1.48e-356.85e-010.1617
Page: 1 2 3 4 5 6 

check button Transcriptomic changes along malignancy continuum.
TissueExpression DynamicsAbbreviation
EsophagusThe image shows the transcriptomic changes along malignancy continuum.log2FC in expression of this searched gene in stem-like cells from each diseased tissue sample relative to stem-like cells in normal samples in each tissue plotted against the malignancy continuum. Samples are colored based on if they are from different disease stage.
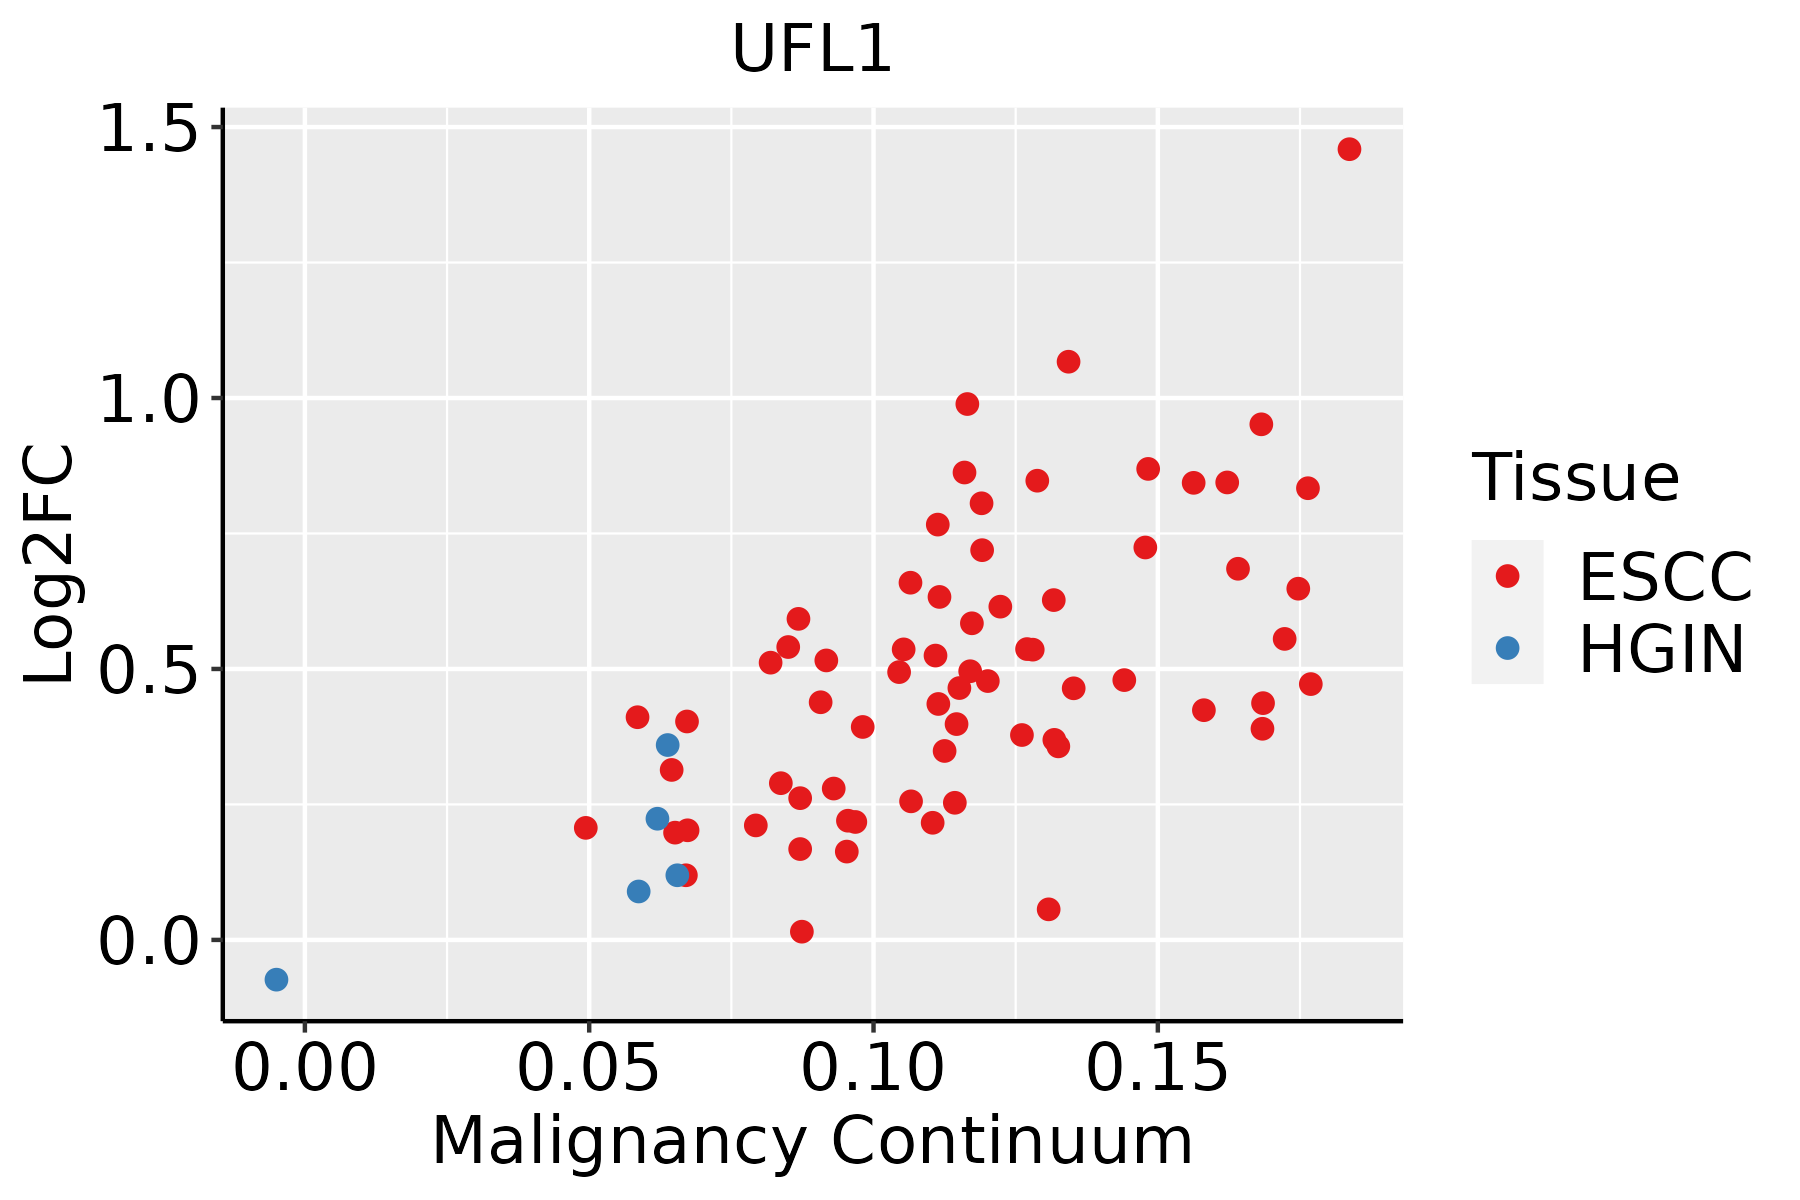
ESCC: Esophageal squamous cell carcinoma
HGIN: High-grade intraepithelial neoplasias
LGIN: Low-grade intraepithelial neoplasias
LiverThe image shows the transcriptomic changes along malignancy continuum.log2FC in expression of this searched gene in stem-like cells from each diseased tissue sample relative to stem-like cells in normal samples in each tissue plotted against the malignancy continuum. Samples are colored based on if they are from different disease stage.
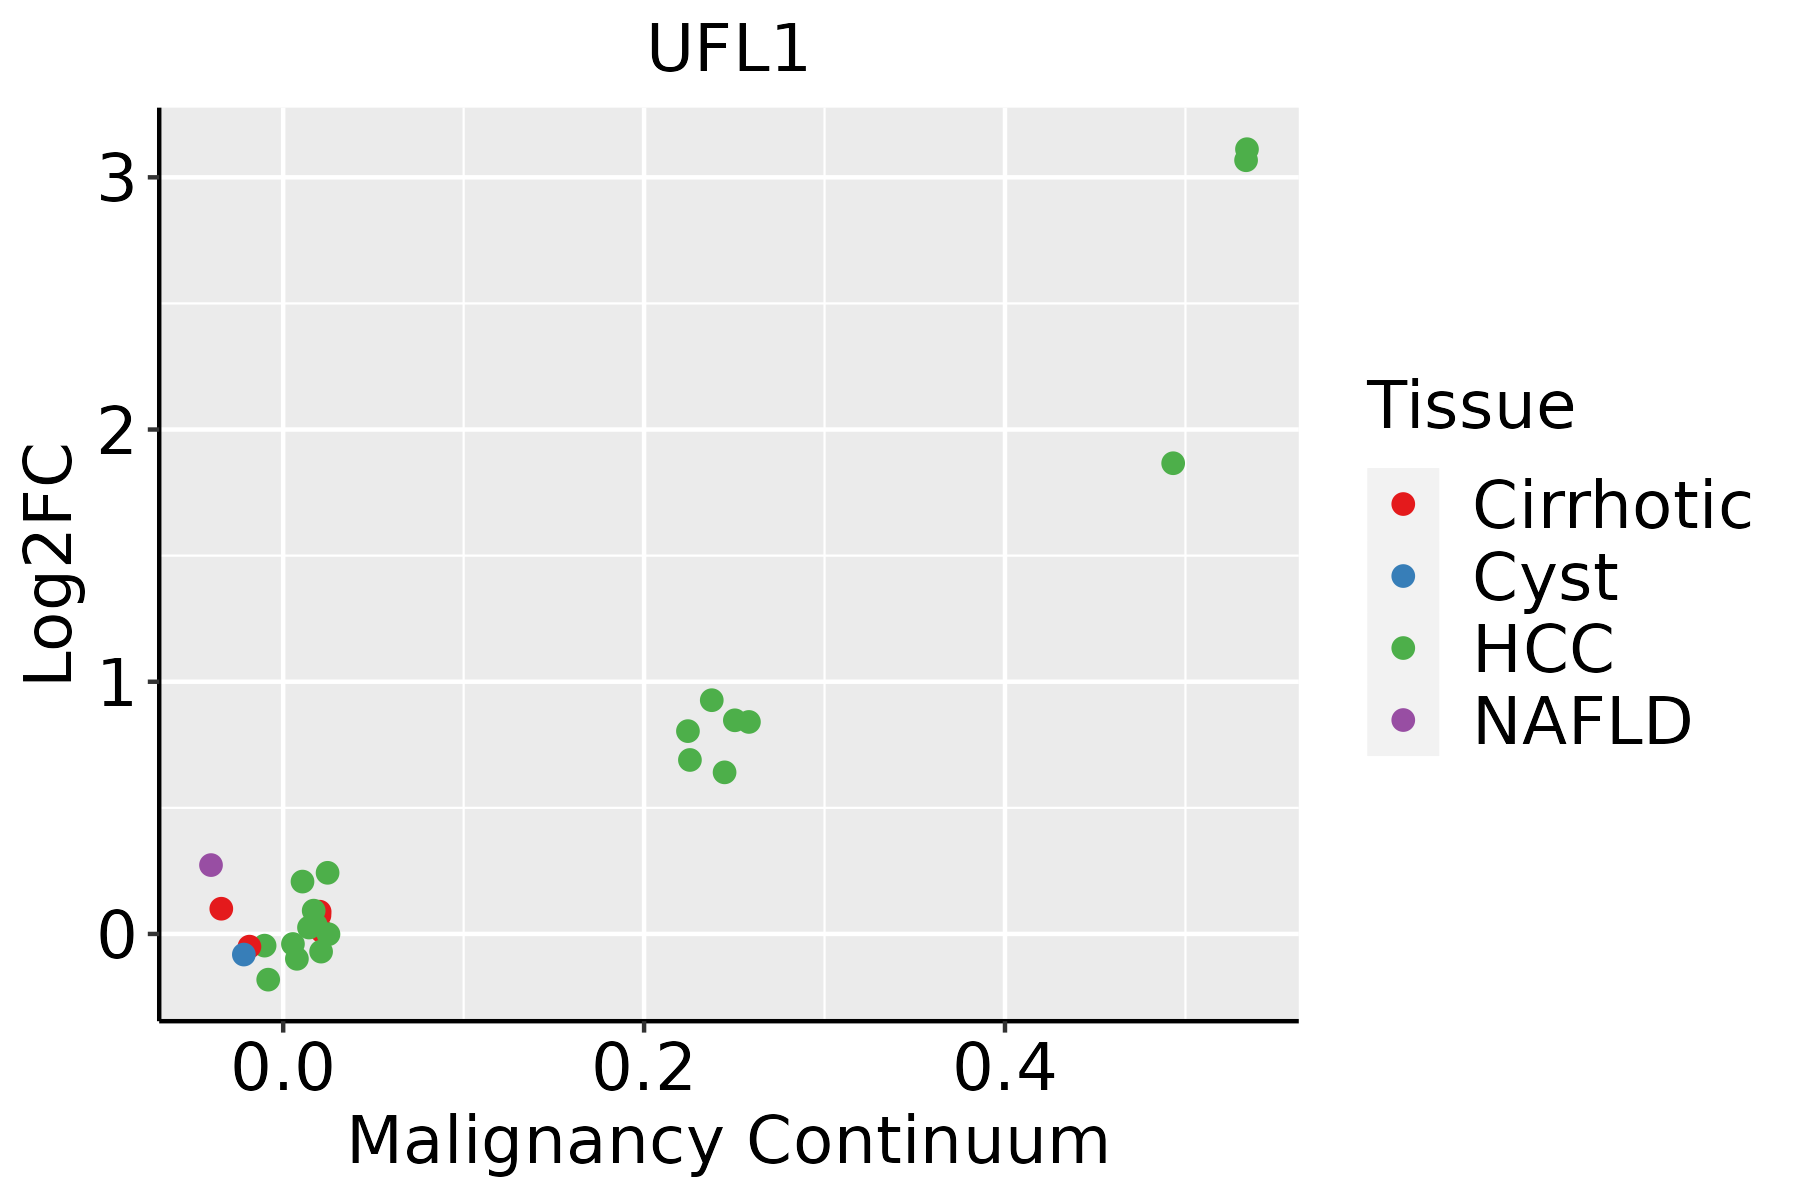
HCC: Hepatocellular carcinoma
NAFLD: Non-alcoholic fatty liver disease
Oral CavityThe image shows the transcriptomic changes along malignancy continuum.log2FC in expression of this searched gene in stem-like cells from each diseased tissue sample relative to stem-like cells in normal samples in each tissue plotted against the malignancy continuum. Samples are colored based on if they are from different disease stage.
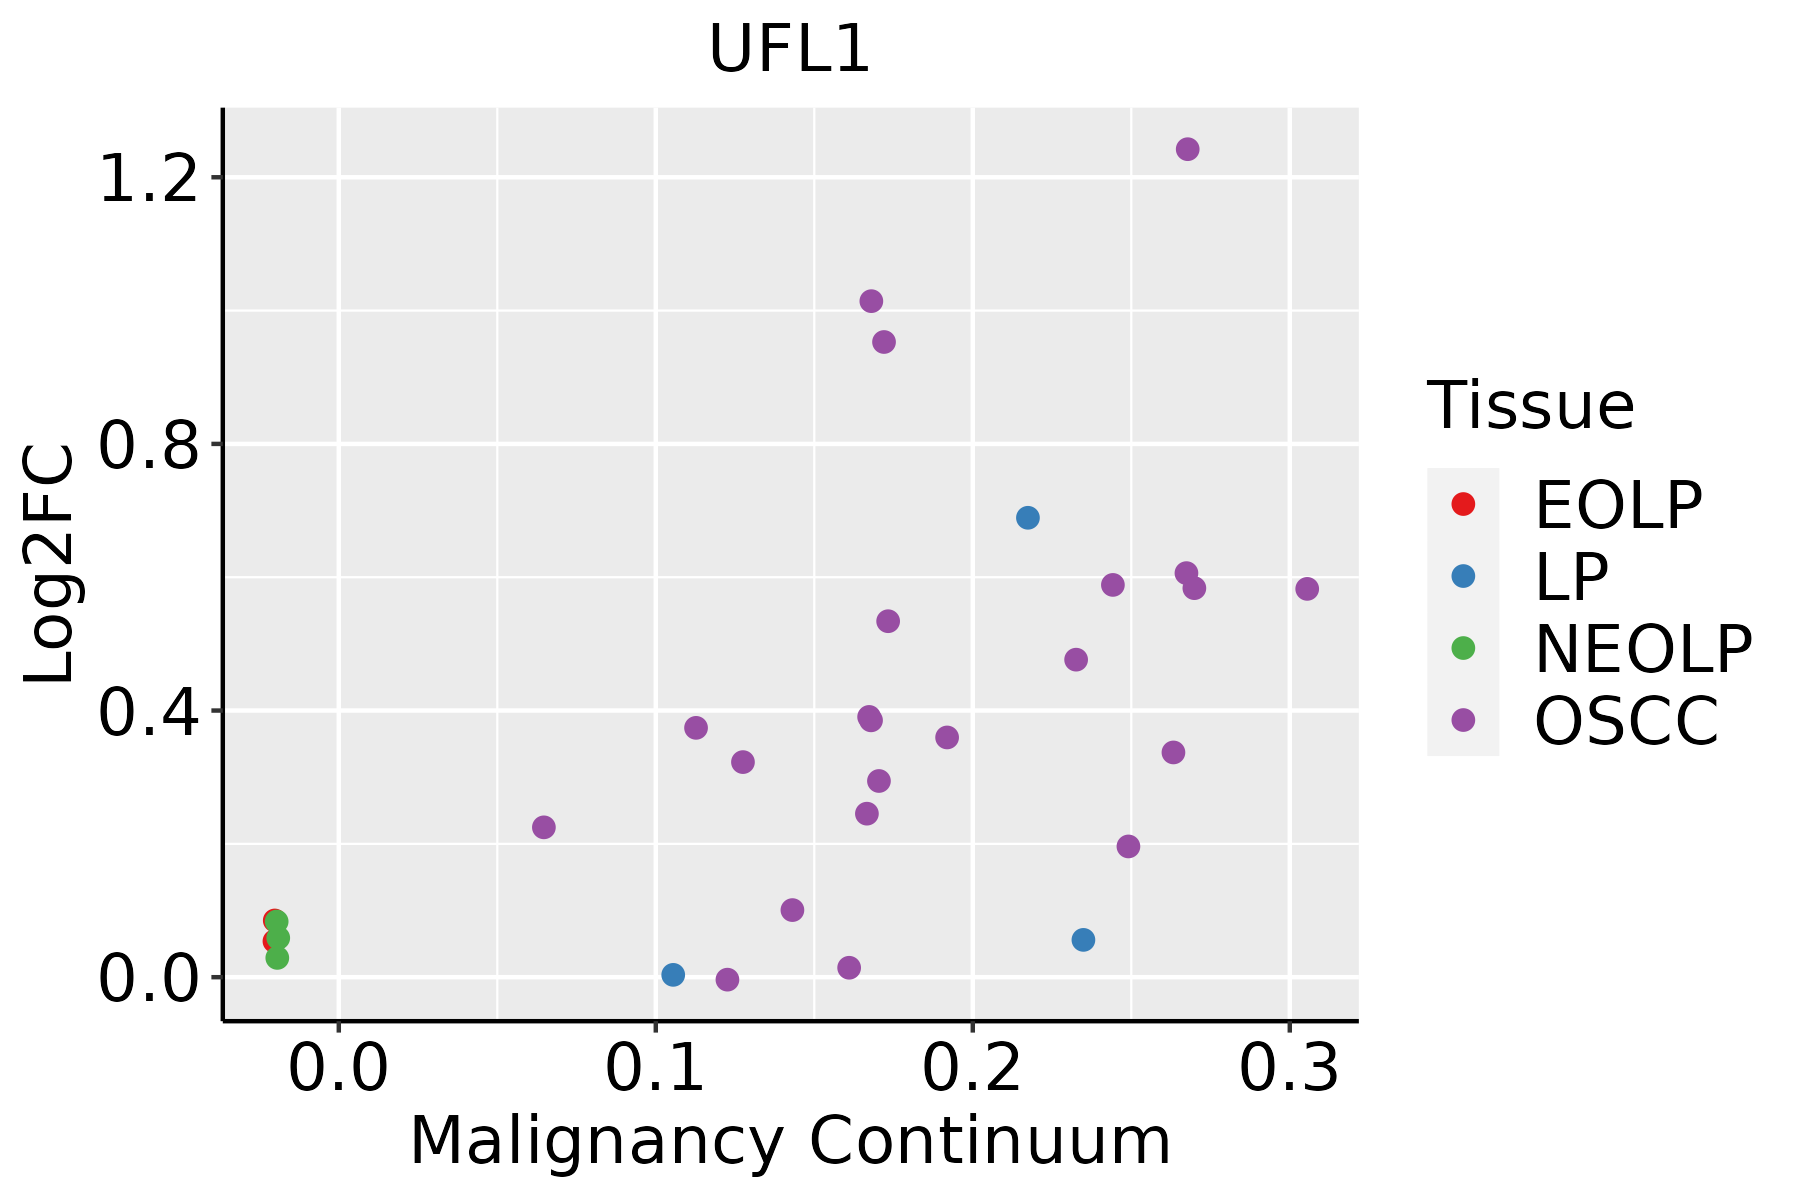
EOLP: Erosive Oral lichen planus
LP: leukoplakia
NEOLP: Non-erosive oral lichen planus
OSCC: Oral squamous cell carcinoma
SkinThe image shows the transcriptomic changes along malignancy continuum.log2FC in expression of this searched gene in stem-like cells from each diseased tissue sample relative to stem-like cells in normal samples in each tissue plotted against the malignancy continuum. Samples are colored based on if they are from different disease stage.
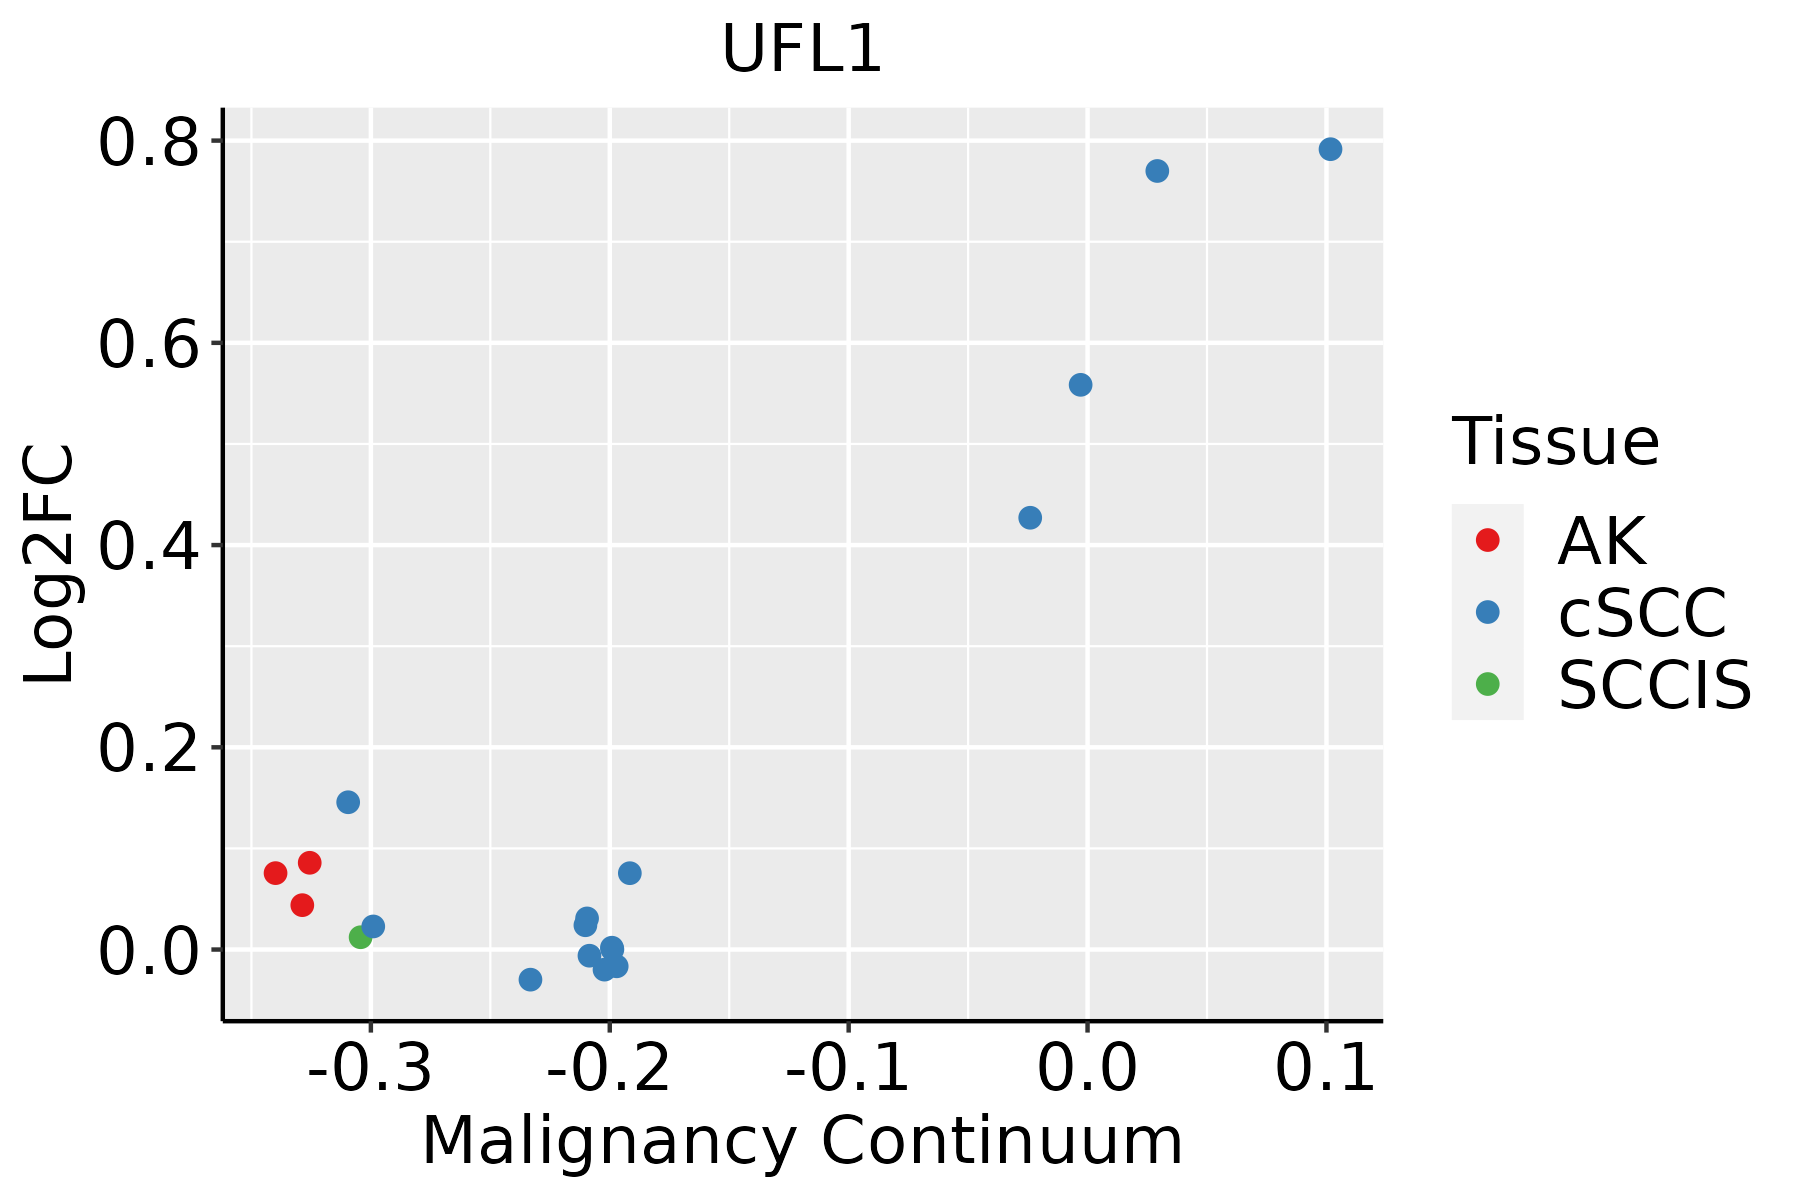
AK: Actinic keratosis
cSCC: Cutaneous squamous cell carcinoma
SCCIS:squamous cell carcinoma in situ
ThyroidThe image shows the transcriptomic changes along malignancy continuum.log2FC in expression of this searched gene in stem-like cells from each diseased tissue sample relative to stem-like cells in normal samples in each tissue plotted against the malignancy continuum. Samples are colored based on if they are from different disease stage.ATC: Anaplastic thyroid cancer
HT: Hashimoto's thyroiditis
PTC: Papillary thyroid cancer
∗log2FC in expression of this searched gene in stem-like cells from each diseased tissue sample relative to stem-like cells in normal samples in each tissue plotted against the malignancy continuum. Samples are colored based on if they are from different disease stage.

Top

Malignant transformation related pathway analysis

check buttonFind out the enriched GO biological processes and KEGG pathways involved in transition from healthy to precancer to cancer
check button Figure of enriched GO biological processes.
TissueDisease StageEnriched GO biological Processes
ColorectumADGO analysis - Figure of enriched GO biological processes: Top 15 enriched GO BP terms are showed in the bar plot of each disease state in each tissue. Each row represents a significant GO biological process which is colored according to the -log10(p.adjust).
ColorectumSERGO analysis - Figure of enriched GO biological processes: Top 15 enriched GO BP terms are showed in the bar plot of each disease state in each tissue. Each row represents a significant GO biological process which is colored according to the -log10(p.adjust).
ColorectumMSSGO analysis - Figure of enriched GO biological processes: Top 15 enriched GO BP terms are showed in the bar plot of each disease state in each tissue. Each row represents a significant GO biological process which is colored according to the -log10(p.adjust).
ColorectumMSI-HGO analysis - Figure of enriched GO biological processes: Top 15 enriched GO BP terms are showed in the bar plot of each disease state in each tissue. Each row represents a significant GO biological process which is colored according to the -log10(p.adjust).
ColorectumFAPGO analysis - Figure of enriched GO biological processes: Top 15 enriched GO BP terms are showed in the bar plot of each disease state in each tissue. Each row represents a significant GO biological process which is colored according to the -log10(p.adjust).
∗Top 15 enriched GO BP terms are showed in the bar plot of each disease state in each tissue. Each row represents a significant GO biological process which is colored according to the -log10(p.adjust).
Page: 1 2 3 4 5 6 7 8 9 

check button Enriched GO biological processes.
GO IDTissueDisease StageDescriptionGene RatioBg Ratiopvaluep.adjustCount
GO:0010498111EsophagusESCCproteasomal protein catabolic process369/8552490/187231.13e-411.80e-38369
GO:0043161111EsophagusESCCproteasome-mediated ubiquitin-dependent protein catabolic process312/8552412/187233.53e-364.48e-33312
GO:001657015EsophagusESCChistone modification323/8552463/187232.61e-267.88e-24323
GO:0042176111EsophagusESCCregulation of protein catabolic process280/8552391/187238.65e-262.39e-23280
GO:001623617EsophagusESCCmacroautophagy216/8552291/187231.94e-234.57e-21216
GO:0022411111EsophagusESCCcellular component disassembly305/8552443/187231.94e-234.57e-21305
GO:0009896111EsophagusESCCpositive regulation of catabolic process332/8552492/187234.36e-239.22e-21332
GO:0034976111EsophagusESCCresponse to endoplasmic reticulum stress192/8552256/187237.15e-221.30e-19192
GO:0031331111EsophagusESCCpositive regulation of cellular catabolic process292/8552427/187238.67e-221.53e-19292
GO:1903320111EsophagusESCCregulation of protein modification by small protein conjugation or removal181/8552242/187231.80e-202.60e-18181
GO:1903362111EsophagusESCCregulation of cellular protein catabolic process188/8552255/187235.12e-206.62e-18188
GO:001050617EsophagusESCCregulation of autophagy220/8552317/187236.72e-186.36e-16220
GO:0035966111EsophagusESCCresponse to topologically incorrect protein125/8552159/187231.44e-171.27e-15125
GO:1903050111EsophagusESCCregulation of proteolysis involved in cellular protein catabolic process163/8552221/187231.44e-171.27e-15163
GO:0061136111EsophagusESCCregulation of proteasomal protein catabolic process142/8552187/187232.40e-172.00e-15142
GO:0031396111EsophagusESCCregulation of protein ubiquitination154/8552210/187232.70e-162.04e-14154
GO:0032434111EsophagusESCCregulation of proteasomal ubiquitin-dependent protein catabolic process107/8552134/187234.06e-162.93e-14107
GO:2000058111EsophagusESCCregulation of ubiquitin-dependent protein catabolic process125/8552164/187231.17e-157.76e-14125
GO:0006986111EsophagusESCCresponse to unfolded protein107/8552137/187237.01e-153.87e-13107
GO:190300816EsophagusESCCorganelle disassembly89/8552114/187231.36e-125.80e-1189
Page: 1 2 3 4 5 6 7 8 9 10 11 12 13 14 15 16 17 18 19 20 21 22 23 24 

check button Enriched KEGG pathways.
Pathway IDTissueDisease StageDescriptionGene RatioBg Ratiopvaluep.adjustqvalueCount
Page: 1 

Top

Cell-cell communication analysis

check buttonIdentification of potential cell-cell interactions between two cell types and their ligand-receptor pairs for different disease states
LigandReceptorLRpairPathwayTissueDisease Stage
Page: 1 

Top

Single-cell gene regulatory network inference analysis

check buttonFind out the significant the regulons (TFs) and the target genes of each regulon across cell types for different disease states
TFCell TypeTissueDisease StageTarget GeneRSSRegulon Activity
∗The dot plots of a searched regulon are shown for all cell subpopulations in each disease state of each tissue based on the regulon specific score inferred using pySCENIC and by calculating the average expression.
Page: 1 

Top

Somatic mutation of malignant transformation related genes

check buttonAnnotation of somatic variants for genes involved in malignant transformation
Hugo SymbolVariant ClassVariant ClassificationdbSNP RSHGVScHGVSpHGVSp ShortSWISSPROTBIOTYPESIFTPolyPhenTumor Sample BarcodeTissueHistologySexAgeStageTherapy TypesDrugsOutcome
UFL1SNVMissense_Mutationrs749425862c.1609N>Gp.Ile537Valp.I537VO94874protein_codingtolerated(0.53)benign(0.024)TCGA-A2-A04P-01Breastbreast invasive carcinomaFemale<65III/IVChemotherapytaxolPD
UFL1SNVMissense_Mutationc.1139T>Cp.Met380Thrp.M380TO94874protein_codingdeleterious(0)possibly_damaging(0.526)TCGA-A2-A1FV-01Breastbreast invasive carcinomaFemale>=65I/IIChemotherapycyclophosphamideSD
UFL1SNVMissense_Mutationc.2232N>Cp.Lys744Asnp.K744NO94874protein_codingdeleterious(0.05)benign(0.185)TCGA-AR-A1AI-01Breastbreast invasive carcinomaFemale<65I/IIChemotherapycytoxanPD
UFL1SNVMissense_Mutationc.1525N>Gp.Leu509Valp.L509VO94874protein_codingdeleterious(0)possibly_damaging(0.784)TCGA-C8-A1HM-01Breastbreast invasive carcinomaFemale>=65I/IIChemotherapydoxorubicinCR
UFL1SNVMissense_Mutationc.1884C>Gp.Asn628Lysp.N628KO94874protein_codingtolerated(0.64)benign(0.003)TCGA-D8-A1JK-01Breastbreast invasive carcinomaFemale>=65I/IIUnknownUnknownSD
UFL1SNVMissense_Mutationc.1309N>Ap.Gly437Argp.G437RO94874protein_codingdeleterious(0.01)possibly_damaging(0.804)TCGA-E9-A22H-01Breastbreast invasive carcinomaFemale<65I/IIChemotherapydoxorubicinSD
UFL1SNVMissense_Mutationrs777997396c.2375N>Tp.Thr792Metp.T792MO94874protein_codingdeleterious(0.01)possibly_damaging(0.791)TCGA-EW-A1IZ-01Breastbreast invasive carcinomaFemale<65III/IVChemotherapytaxotereSD
UFL1insertionIn_Frame_Insrs775473285c.1752_1753insGAGp.Leu584_Ile585insGlup.L584_I585insEO94874protein_codingTCGA-BH-A0HN-01Breastbreast invasive carcinomaFemale>=65I/IIHormone TherapyarimidexSD
UFL1insertionIn_Frame_Insrs762826701c.1754_1755insAAGp.Ile585_Phe586insSerp.I585_F586insSO94874protein_codingTCGA-BH-A0HN-01Breastbreast invasive carcinomaFemale>=65I/IIHormone TherapyarimidexSD
UFL1SNVMissense_Mutationc.1507G>Cp.Glu503Glnp.E503QO94874protein_codingtolerated(0.2)benign(0.1)TCGA-UC-A7PF-01Cervixcervical & endocervical cancerFemale<65I/IIUnknownUnknownSD
Page: 1 2 3 4 5 6 7 8 9 10 11 

Top

Related drugs of malignant transformation related genes

check buttonIdentification of chemicals and drugs interact with genes involved in malignant transfromation
(DGIdb 4.0)
Entrez IDSymbolCategoryInteraction TypesDrug Claim NameDrug NamePMIDs
Page: 1