
|
|||||
|
 | |
| |
| |
| |
| |
| |
|
Gene: UCP2 |
Gene summary for UCP2 |
| Gene information | Species | Human | Gene symbol | UCP2 | Gene ID | 7351 |
| Gene name | uncoupling protein 2 | |
| Gene Alias | BMIQ4 | |
| Cytomap | 11q13.4 | |
| Gene Type | protein-coding | GO ID | GO:0000003 | UniProtAcc | A0A024R5N5 |
Top |
Malignant transformation analysis |
| Identification of the aberrant gene expression in precancerous and cancerous lesions by comparing the gene expression of stem-like cells in diseased tissues with normal stem cells |
| Entrez ID | Symbol | Replicates | Species | Organ | Tissue | Adj P-value | Log2FC | Malignancy |
| 7351 | UCP2 | GSM4909288 | Human | Breast | IDC | 4.04e-05 | 1.70e-01 | 0.0988 |
| 7351 | UCP2 | GSM4909290 | Human | Breast | IDC | 8.76e-11 | 4.50e-01 | 0.2096 |
| 7351 | UCP2 | GSM4909291 | Human | Breast | IDC | 2.73e-13 | 5.52e-01 | 0.1753 |
| 7351 | UCP2 | GSM4909297 | Human | Breast | IDC | 4.70e-02 | -8.43e-02 | 0.1517 |
| 7351 | UCP2 | GSM4909308 | Human | Breast | IDC | 2.54e-07 | 3.41e-01 | 0.158 |
| 7351 | UCP2 | GSM4909311 | Human | Breast | IDC | 2.31e-04 | -6.56e-02 | 0.1534 |
| 7351 | UCP2 | GSM4909312 | Human | Breast | IDC | 2.71e-04 | 2.66e-01 | 0.1552 |
| 7351 | UCP2 | GSM4909313 | Human | Breast | IDC | 1.70e-08 | 4.08e-01 | 0.0391 |
| 7351 | UCP2 | GSM4909316 | Human | Breast | IDC | 1.66e-07 | 5.51e-01 | 0.21 |
| 7351 | UCP2 | GSM4909319 | Human | Breast | IDC | 5.94e-07 | -9.74e-02 | 0.1563 |
| 7351 | UCP2 | GSM4909321 | Human | Breast | IDC | 2.98e-03 | 1.65e-01 | 0.1559 |
| 7351 | UCP2 | brca2 | Human | Breast | Precancer | 3.69e-10 | 4.51e-01 | -0.024 |
| 7351 | UCP2 | M2 | Human | Breast | IDC | 4.97e-06 | 4.94e-01 | 0.21 |
| 7351 | UCP2 | M5 | Human | Breast | IDC | 6.07e-07 | 6.86e-01 | 0.1598 |
| 7351 | UCP2 | NCCBC11 | Human | Breast | DCIS | 2.28e-02 | 4.39e-01 | 0.1232 |
| 7351 | UCP2 | NCCBC14 | Human | Breast | DCIS | 2.16e-06 | 3.36e-01 | 0.2021 |
| 7351 | UCP2 | NCCBC3 | Human | Breast | DCIS | 7.14e-04 | 3.23e-01 | 0.1198 |
| 7351 | UCP2 | NCCBC5 | Human | Breast | DCIS | 7.88e-09 | 4.19e-01 | 0.2046 |
| 7351 | UCP2 | P2 | Human | Breast | IDC | 8.72e-10 | 5.62e-01 | 0.21 |
| 7351 | UCP2 | DCIS2 | Human | Breast | DCIS | 4.17e-03 | -1.14e-01 | 0.0085 |
| Page: 1 2 3 4 5 6 |
| Tissue | Expression Dynamics | Abbreviation |
| Breast | 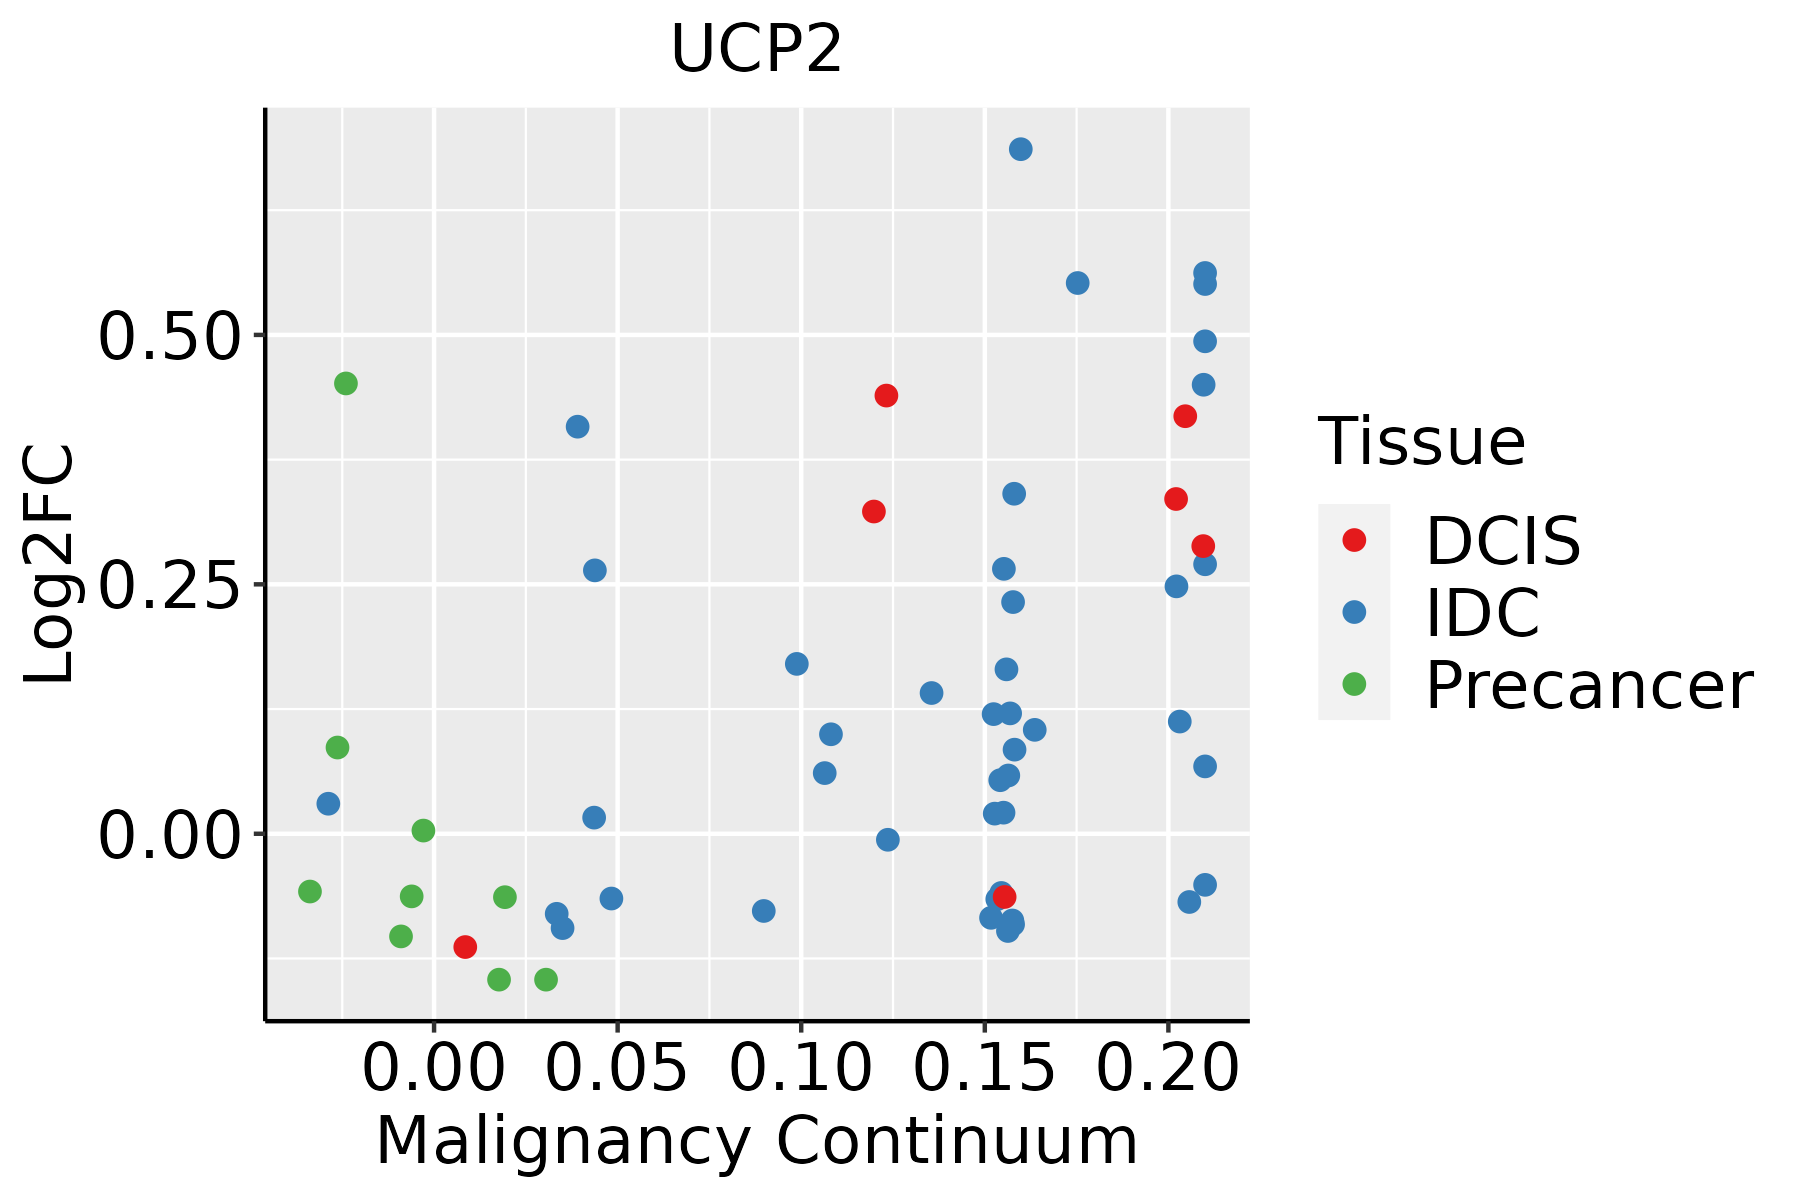 | IDC: Invasive ductal carcinoma |
| DCIS: Ductal carcinoma in situ | ||
| Precancer(BRCA1-mut): Precancerous lesion from BRCA1 mutation carriers | ||
| Colorectum (GSE201348) |  | FAP: Familial adenomatous polyposis |
| CRC: Colorectal cancer | ||
| Colorectum (HTA11) |  | AD: Adenomas |
| SER: Sessile serrated lesions | ||
| MSI-H: Microsatellite-high colorectal cancer | ||
| MSS: Microsatellite stable colorectal cancer | ||
| Endometrium |  | AEH: Atypical endometrial hyperplasia |
| EEC: Endometrioid Cancer | ||
| Esophagus | 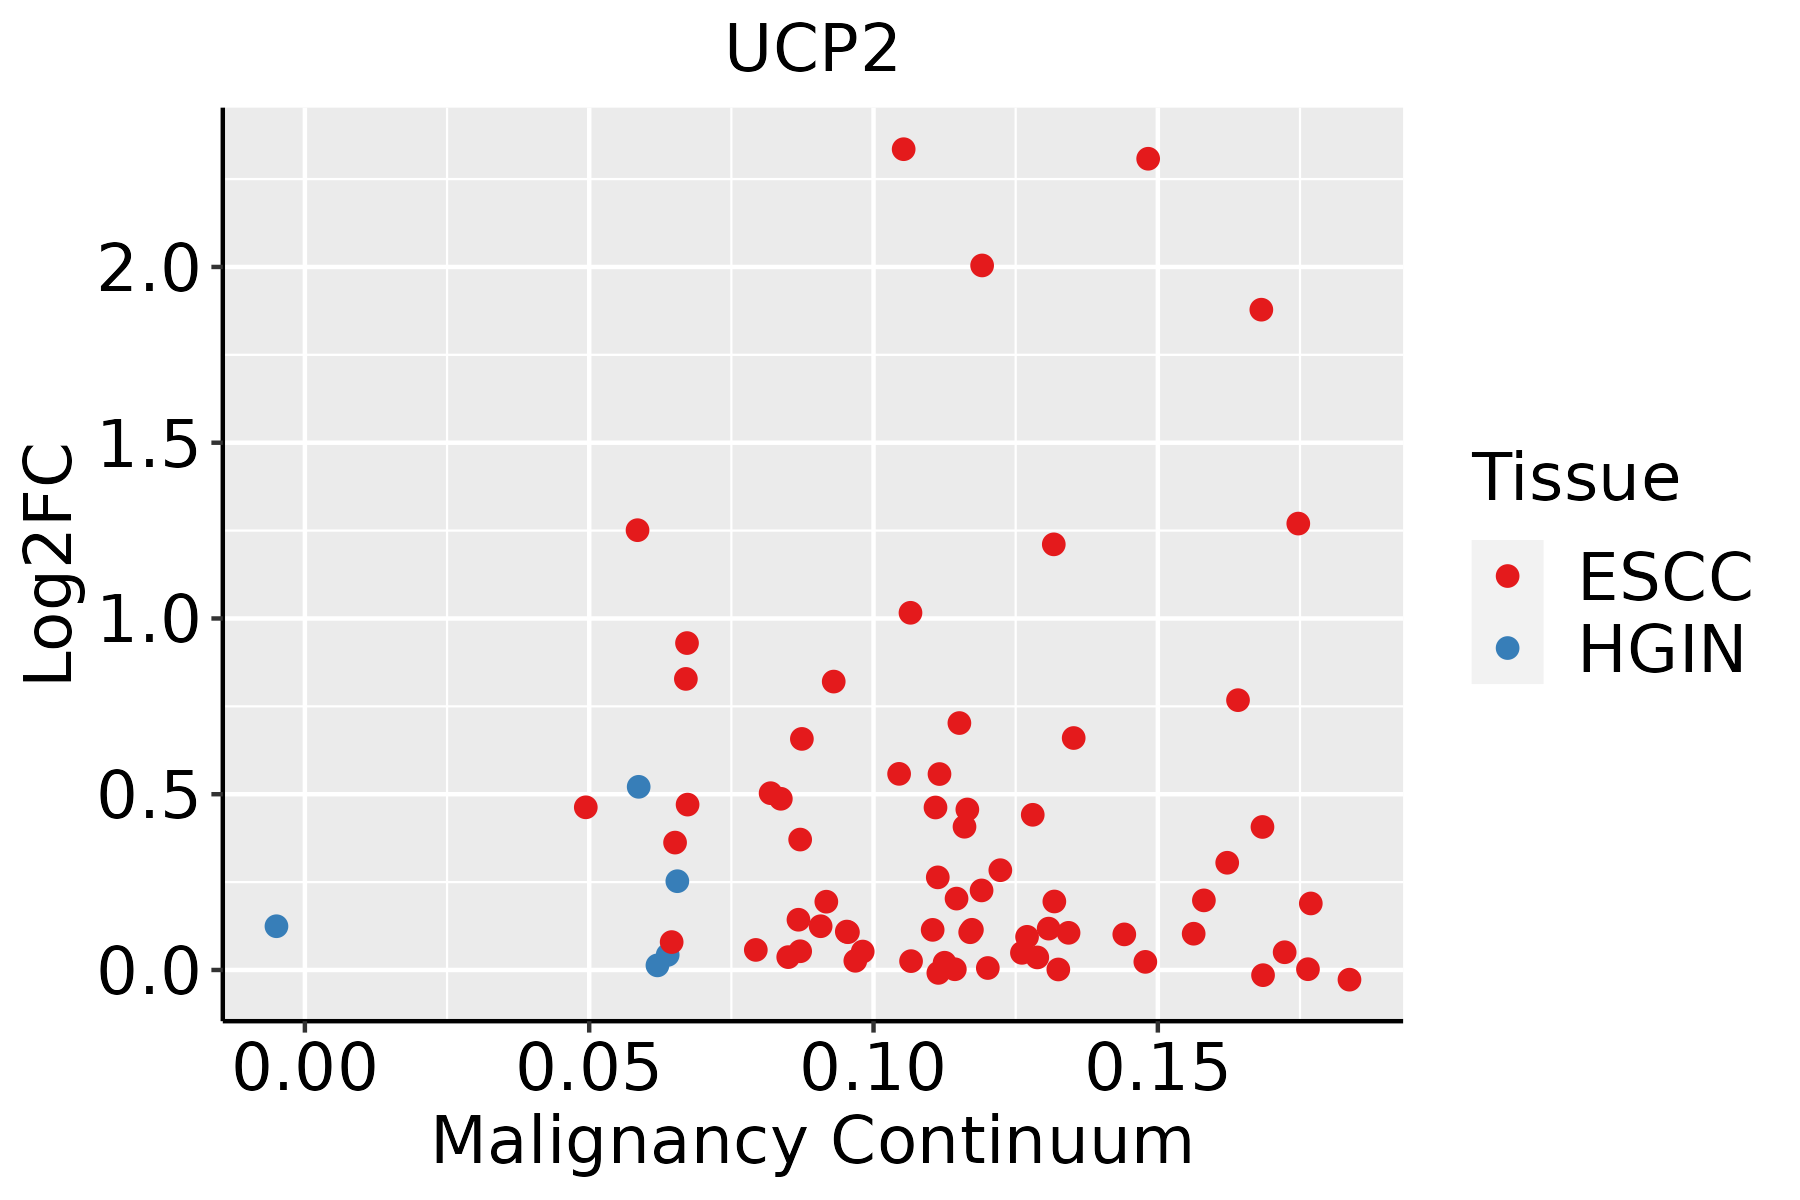 | ESCC: Esophageal squamous cell carcinoma |
| HGIN: High-grade intraepithelial neoplasias | ||
| LGIN: Low-grade intraepithelial neoplasias | ||
| Liver |  | HCC: Hepatocellular carcinoma |
| NAFLD: Non-alcoholic fatty liver disease | ||
| Oral Cavity | 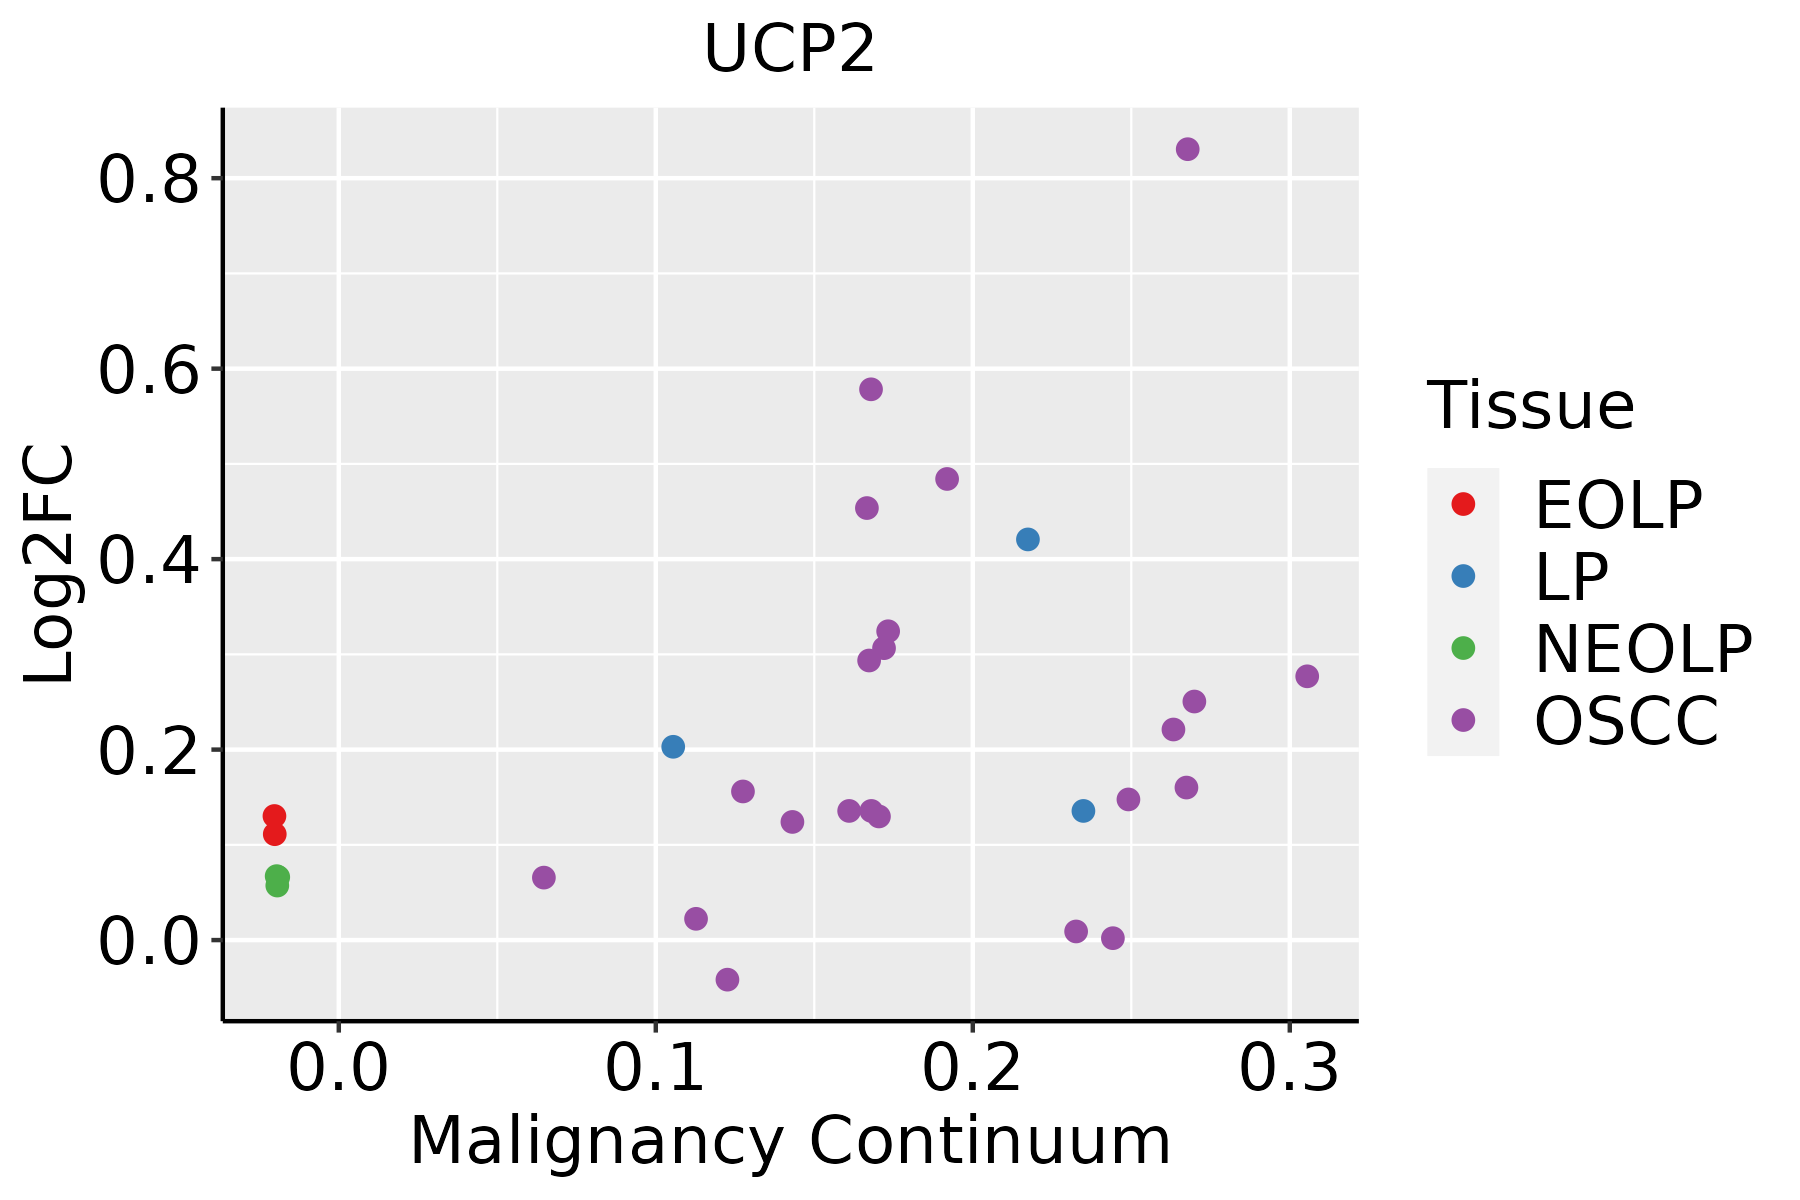 | EOLP: Erosive Oral lichen planus |
| LP: leukoplakia | ||
| NEOLP: Non-erosive oral lichen planus | ||
| OSCC: Oral squamous cell carcinoma | ||
| Thyroid | 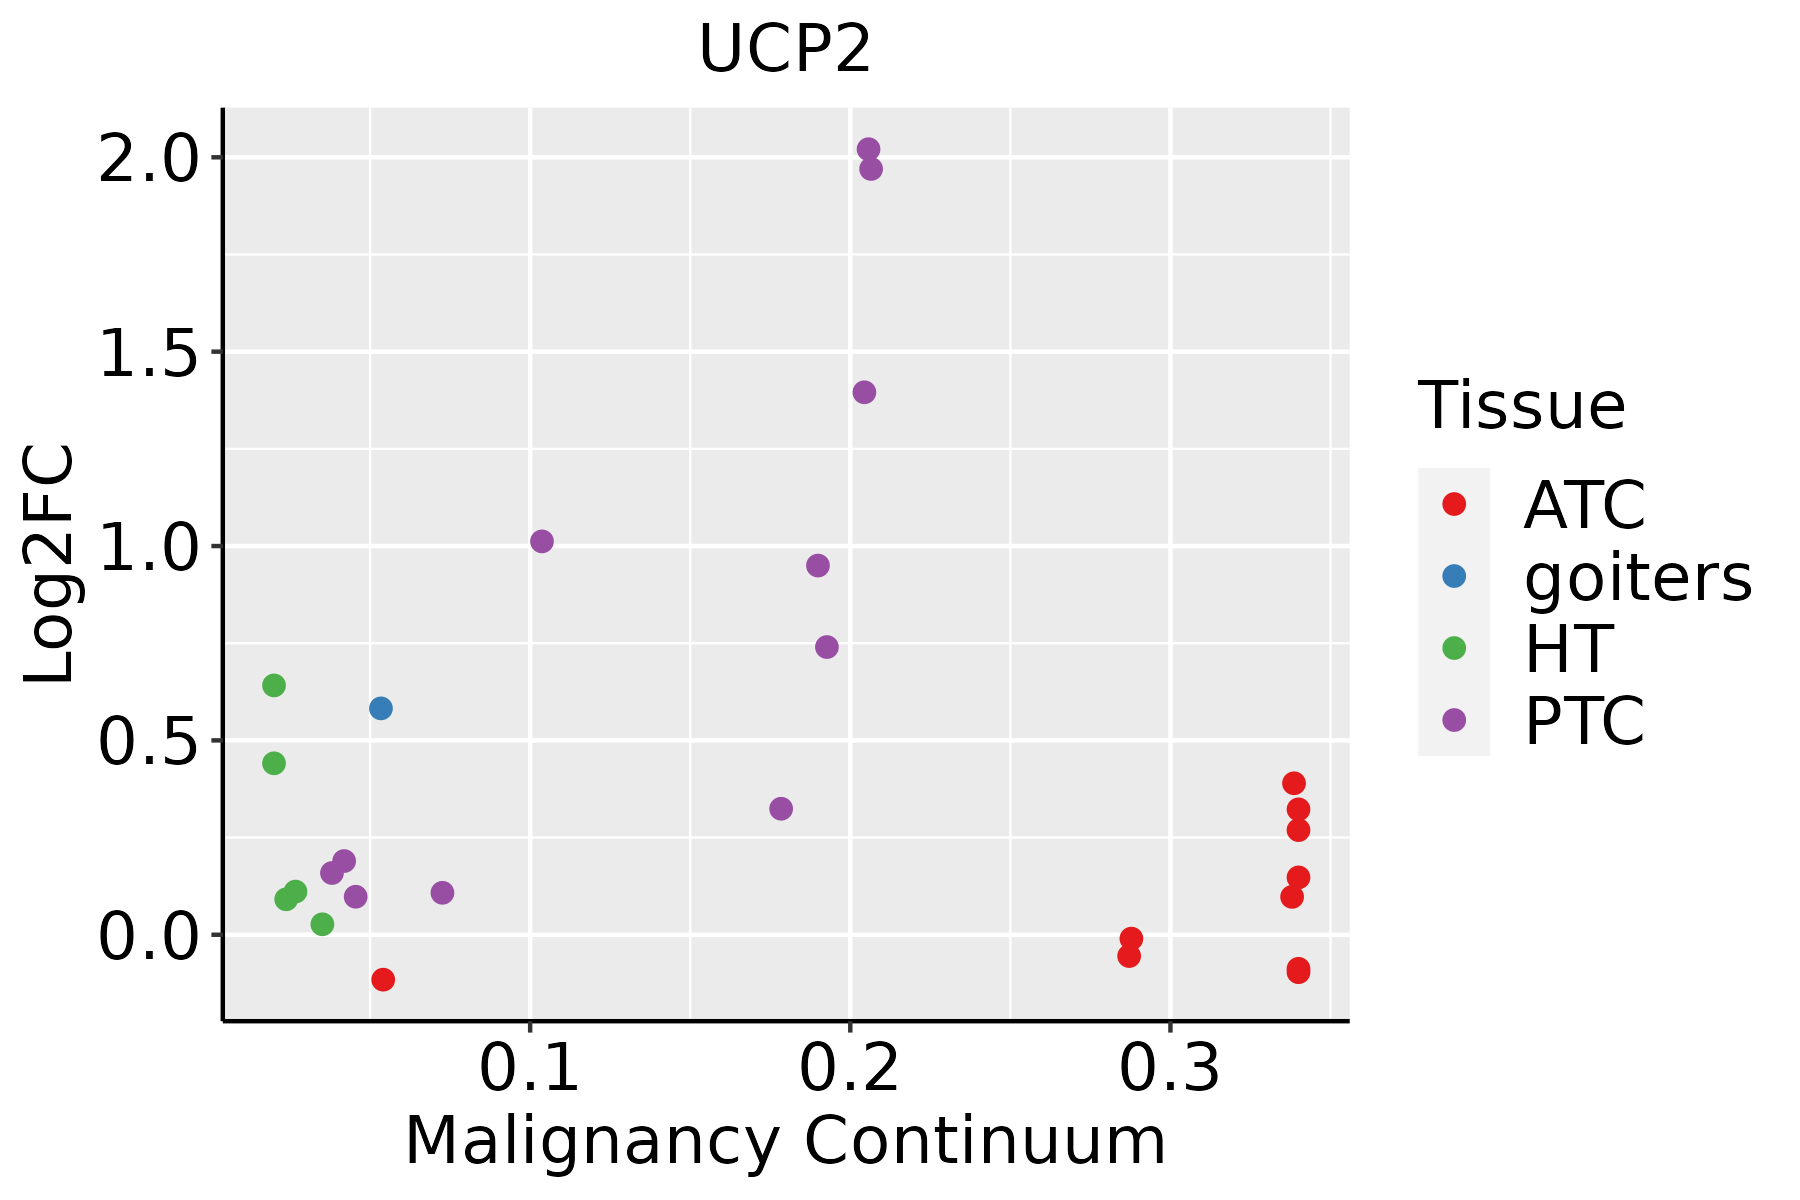 | ATC: Anaplastic thyroid cancer |
| HT: Hashimoto's thyroiditis | ||
| PTC: Papillary thyroid cancer |
| ∗log2FC in expression of this searched gene in stem-like cells from each diseased tissue sample relative to stem-like cells in normal samples in each tissue plotted against the malignancy continuum. Samples are colored based on if they are from different disease stage. |
Top |
Malignant transformation related pathway analysis |
| Find out the enriched GO biological processes and KEGG pathways involved in transition from healthy to precancer to cancer |
| Tissue | Disease Stage | Enriched GO biological Processes |
| Colorectum | AD |  |
| Colorectum | SER |  |
| Colorectum | MSS |  |
| Colorectum | MSI-H |  |
| Colorectum | FAP |  |
| ∗Top 15 enriched GO BP terms are showed in the bar plot of each disease state in each tissue. Each row represents a significant GO biological process which is colored according to the -log10(p.adjust). |
| Page: 1 2 3 4 5 6 7 8 9 |
| GO ID | Tissue | Disease Stage | Description | Gene Ratio | Bg Ratio | pvalue | p.adjust | Count |
| GO:19026008 | Breast | Precancer | proton transmembrane transport | 39/1080 | 157/18723 | 4.18e-15 | 1.18e-12 | 39 |
| GO:00069799 | Breast | Precancer | response to oxidative stress | 70/1080 | 446/18723 | 1.59e-14 | 4.26e-12 | 70 |
| GO:00362939 | Breast | Precancer | response to decreased oxygen levels | 53/1080 | 322/18723 | 4.09e-12 | 6.84e-10 | 53 |
| GO:00016669 | Breast | Precancer | response to hypoxia | 51/1080 | 307/18723 | 7.33e-12 | 1.11e-09 | 51 |
| GO:00704829 | Breast | Precancer | response to oxygen levels | 55/1080 | 347/18723 | 7.47e-12 | 1.11e-09 | 55 |
| GO:00068398 | Breast | Precancer | mitochondrial transport | 45/1080 | 254/18723 | 1.37e-11 | 1.88e-09 | 45 |
| GO:00003029 | Breast | Precancer | response to reactive oxygen species | 38/1080 | 222/18723 | 1.47e-09 | 1.23e-07 | 38 |
| GO:19905427 | Breast | Precancer | mitochondrial transmembrane transport | 22/1080 | 102/18723 | 6.38e-08 | 3.80e-06 | 22 |
| GO:00518816 | Breast | Precancer | regulation of mitochondrial membrane potential | 18/1080 | 74/18723 | 1.45e-07 | 7.82e-06 | 18 |
| GO:00075653 | Breast | Precancer | female pregnancy | 29/1080 | 193/18723 | 2.07e-06 | 7.31e-05 | 29 |
| GO:00447063 | Breast | Precancer | multi-multicellular organism process | 31/1080 | 220/18723 | 3.73e-06 | 1.19e-04 | 31 |
| GO:00092667 | Breast | Precancer | response to temperature stimulus | 27/1080 | 178/18723 | 3.85e-06 | 1.21e-04 | 27 |
| GO:00075688 | Breast | Precancer | aging | 41/1080 | 339/18723 | 5.95e-06 | 1.71e-04 | 41 |
| GO:00487329 | Breast | Precancer | gland development | 49/1080 | 436/18723 | 6.11e-06 | 1.73e-04 | 49 |
| GO:00974216 | Breast | Precancer | liver regeneration | 10/1080 | 35/18723 | 1.91e-05 | 4.52e-04 | 10 |
| GO:00342849 | Breast | Precancer | response to monosaccharide | 29/1080 | 225/18723 | 4.19e-05 | 9.00e-04 | 29 |
| GO:00097439 | Breast | Precancer | response to carbohydrate | 31/1080 | 253/18723 | 6.15e-05 | 1.25e-03 | 31 |
| GO:00425938 | Breast | Precancer | glucose homeostasis | 31/1080 | 258/18723 | 8.89e-05 | 1.69e-03 | 31 |
| GO:00335008 | Breast | Precancer | carbohydrate homeostasis | 31/1080 | 259/18723 | 9.56e-05 | 1.79e-03 | 31 |
| GO:00311004 | Breast | Precancer | animal organ regeneration | 14/1080 | 76/18723 | 9.92e-05 | 1.83e-03 | 14 |
| Page: 1 2 3 4 5 6 7 8 9 10 11 12 13 14 15 16 17 18 19 20 21 22 23 24 25 26 27 28 29 30 31 32 33 34 35 |
| Pathway ID | Tissue | Disease Stage | Description | Gene Ratio | Bg Ratio | pvalue | p.adjust | qvalue | Count |
| Page: 1 |
Top |
Cell-cell communication analysis |
| Identification of potential cell-cell interactions between two cell types and their ligand-receptor pairs for different disease states |
| Ligand | Receptor | LRpair | Pathway | Tissue | Disease Stage |
| Page: 1 |
Top |
Single-cell gene regulatory network inference analysis |
| Find out the significant the regulons (TFs) and the target genes of each regulon across cell types for different disease states |
| TF | Cell Type | Tissue | Disease Stage | Target Gene | RSS | Regulon Activity |
| ∗The dot plots of a searched regulon are shown for all cell subpopulations in each disease state of each tissue based on the regulon specific score inferred using pySCENIC and by calculating the average expression. |
| Page: 1 |
Top |
Somatic mutation of malignant transformation related genes |
| Annotation of somatic variants for genes involved in malignant transformation |
| Hugo Symbol | Variant Class | Variant Classification | dbSNP RS | HGVSc | HGVSp | HGVSp Short | SWISSPROT | BIOTYPE | SIFT | PolyPhen | Tumor Sample Barcode | Tissue | Histology | Sex | Age | Stage | Therapy Types | Drugs | Outcome |
| UCP2 | SNV | Missense_Mutation | novel | c.22N>A | p.Asp8Asn | p.D8N | P55851 | protein_coding | tolerated(0.07) | benign(0.003) | TCGA-A2-A3XZ-01 | Breast | breast invasive carcinoma | Female | <65 | I/II | Chemotherapy | carboplatin | CR |
| UCP2 | SNV | Missense_Mutation | c.452G>C | p.Gly151Ala | p.G151A | P55851 | protein_coding | tolerated(0.57) | benign(0.006) | TCGA-AC-A23H-01 | Breast | breast invasive carcinoma | Female | >=65 | I/II | Unknown | Unknown | PD | |
| UCP2 | SNV | Missense_Mutation | c.94N>A | p.Phe32Ile | p.F32I | P55851 | protein_coding | tolerated(0.51) | possibly_damaging(0.643) | TCGA-AO-A0JB-01 | Breast | breast invasive carcinoma | Female | <65 | III/IV | Chemotherapy | cyclophosphamide | SD | |
| UCP2 | SNV | Missense_Mutation | c.52N>A | p.Leu18Ile | p.L18I | P55851 | protein_coding | tolerated(0.23) | benign(0.031) | TCGA-AQ-A7U7-01 | Breast | breast invasive carcinoma | Female | <65 | III/IV | Targeted Molecular therapy | rituximab | CR | |
| UCP2 | SNV | Missense_Mutation | c.488N>T | p.Tyr163Phe | p.Y163F | P55851 | protein_coding | deleterious(0) | possibly_damaging(0.738) | TCGA-E2-A1LH-01 | Breast | breast invasive carcinoma | Female | <65 | I/II | Chemotherapy | adriamycin | SD | |
| UCP2 | deletion | Frame_Shift_Del | rs770840871 | c.143_144delAG | p.Gln48ArgfsTer25 | p.Q48Rfs*25 | P55851 | protein_coding | TCGA-EA-A410-01 | Cervix | cervical & endocervical cancer | Female | <65 | I/II | Unknown | Unknown | SD | ||
| UCP2 | SNV | Missense_Mutation | rs780835346 | c.292G>A | p.Gly98Ser | p.G98S | P55851 | protein_coding | deleterious(0.04) | probably_damaging(0.998) | TCGA-CK-4951-01 | Colorectum | colon adenocarcinoma | Female | >=65 | I/II | Unknown | Unknown | PD |
| UCP2 | SNV | Missense_Mutation | rs781271646 | c.154N>T | p.Arg52Cys | p.R52C | P55851 | protein_coding | deleterious(0.05) | benign(0.09) | TCGA-CM-6162-01 | Colorectum | colon adenocarcinoma | Female | <65 | III/IV | Chemotherapy | oxaliplatin | SD |
| UCP2 | deletion | Frame_Shift_Del | c.32delN | p.Pro11LeufsTer5 | p.P11Lfs*5 | P55851 | protein_coding | TCGA-AM-5821-01 | Colorectum | colon adenocarcinoma | Female | >=65 | I/II | Unknown | Unknown | SD | |||
| UCP2 | SNV | Missense_Mutation | rs145061662 | c.263G>A | p.Arg88His | p.R88H | P55851 | protein_coding | deleterious(0) | probably_damaging(0.997) | TCGA-A5-A0G1-01 | Endometrium | uterine corpus endometrioid carcinoma | Female | >=65 | I/II | Unknown | Unknown | SD |
| Page: 1 2 3 |
Top |
Related drugs of malignant transformation related genes |
| Identification of chemicals and drugs interact with genes involved in malignant transfromation |
| (DGIdb 4.0) |
| Entrez ID | Symbol | Category | Interaction Types | Drug Claim Name | Drug Name | PMIDs |
| 7351 | UCP2 | TRANSPORTER, DRUGGABLE GENOME | INTRALIPID | SOYBEAN OIL | 10868951 | |
| 7351 | UCP2 | TRANSPORTER, DRUGGABLE GENOME | BRL49653 | 9299560 | ||
| 7351 | UCP2 | TRANSPORTER, DRUGGABLE GENOME | HEPARIN | HEPARIN | 10868951 | |
| 7351 | UCP2 | TRANSPORTER, DRUGGABLE GENOME | ANTIOXIDANT | 15642337 | ||
| 7351 | UCP2 | TRANSPORTER, DRUGGABLE GENOME | TRIIODOTHYRONINE | LIOTHYRONINE SODIUM | 9428737,10444435 | |
| 7351 | UCP2 | TRANSPORTER, DRUGGABLE GENOME | SALINE | SODIUM CHLORIDE | 10868951 | |
| 7351 | UCP2 | TRANSPORTER, DRUGGABLE GENOME | CL-316,243 |
| Page: 1 |

Copyright 2023-Present -The University of Texas Health Science Center at Houston |