
|
|||||
|
 | |
| |
| |
| |
| |
| |
|
Gene: UCKL1 |
Gene summary for UCKL1 |
| Gene information | Species | Human | Gene symbol | UCKL1 | Gene ID | 54963 |
| Gene name | uridine-cytidine kinase 1 like 1 | |
| Gene Alias | UCK1L | |
| Cytomap | 20q13.33 | |
| Gene Type | protein-coding | GO ID | GO:0006139 | UniProtAcc | Q53HM1 |
Top |
Malignant transformation analysis |
| Identification of the aberrant gene expression in precancerous and cancerous lesions by comparing the gene expression of stem-like cells in diseased tissues with normal stem cells |
| Entrez ID | Symbol | Replicates | Species | Organ | Tissue | Adj P-value | Log2FC | Malignancy |
| 54963 | UCKL1 | LZE4T | Human | Esophagus | ESCC | 2.14e-16 | 3.77e-01 | 0.0811 |
| 54963 | UCKL1 | LZE7T | Human | Esophagus | ESCC | 2.97e-16 | 6.31e-01 | 0.0667 |
| 54963 | UCKL1 | LZE8T | Human | Esophagus | ESCC | 1.82e-10 | 2.47e-01 | 0.067 |
| 54963 | UCKL1 | LZE20T | Human | Esophagus | ESCC | 1.13e-04 | 2.01e-01 | 0.0662 |
| 54963 | UCKL1 | LZE24T | Human | Esophagus | ESCC | 2.07e-11 | 2.80e-01 | 0.0596 |
| 54963 | UCKL1 | LZE6T | Human | Esophagus | ESCC | 1.99e-04 | 2.74e-01 | 0.0845 |
| 54963 | UCKL1 | P1T-E | Human | Esophagus | ESCC | 1.27e-06 | 3.67e-01 | 0.0875 |
| 54963 | UCKL1 | P2T-E | Human | Esophagus | ESCC | 7.23e-32 | 5.33e-01 | 0.1177 |
| 54963 | UCKL1 | P4T-E | Human | Esophagus | ESCC | 2.91e-09 | 1.86e-01 | 0.1323 |
| 54963 | UCKL1 | P5T-E | Human | Esophagus | ESCC | 7.63e-27 | 5.41e-01 | 0.1327 |
| 54963 | UCKL1 | P8T-E | Human | Esophagus | ESCC | 5.16e-22 | 2.07e-01 | 0.0889 |
| 54963 | UCKL1 | P9T-E | Human | Esophagus | ESCC | 7.04e-10 | 2.04e-01 | 0.1131 |
| 54963 | UCKL1 | P10T-E | Human | Esophagus | ESCC | 9.89e-46 | 7.64e-01 | 0.116 |
| 54963 | UCKL1 | P11T-E | Human | Esophagus | ESCC | 3.52e-22 | 6.04e-01 | 0.1426 |
| 54963 | UCKL1 | P12T-E | Human | Esophagus | ESCC | 1.84e-35 | 7.21e-01 | 0.1122 |
| 54963 | UCKL1 | P15T-E | Human | Esophagus | ESCC | 2.55e-24 | 4.81e-01 | 0.1149 |
| 54963 | UCKL1 | P16T-E | Human | Esophagus | ESCC | 4.20e-30 | 4.53e-01 | 0.1153 |
| 54963 | UCKL1 | P17T-E | Human | Esophagus | ESCC | 3.13e-12 | 6.00e-01 | 0.1278 |
| 54963 | UCKL1 | P19T-E | Human | Esophagus | ESCC | 6.08e-09 | 4.65e-01 | 0.1662 |
| 54963 | UCKL1 | P20T-E | Human | Esophagus | ESCC | 1.15e-37 | 7.57e-01 | 0.1124 |
| Page: 1 2 3 4 5 |
| Tissue | Expression Dynamics | Abbreviation |
| Esophagus | 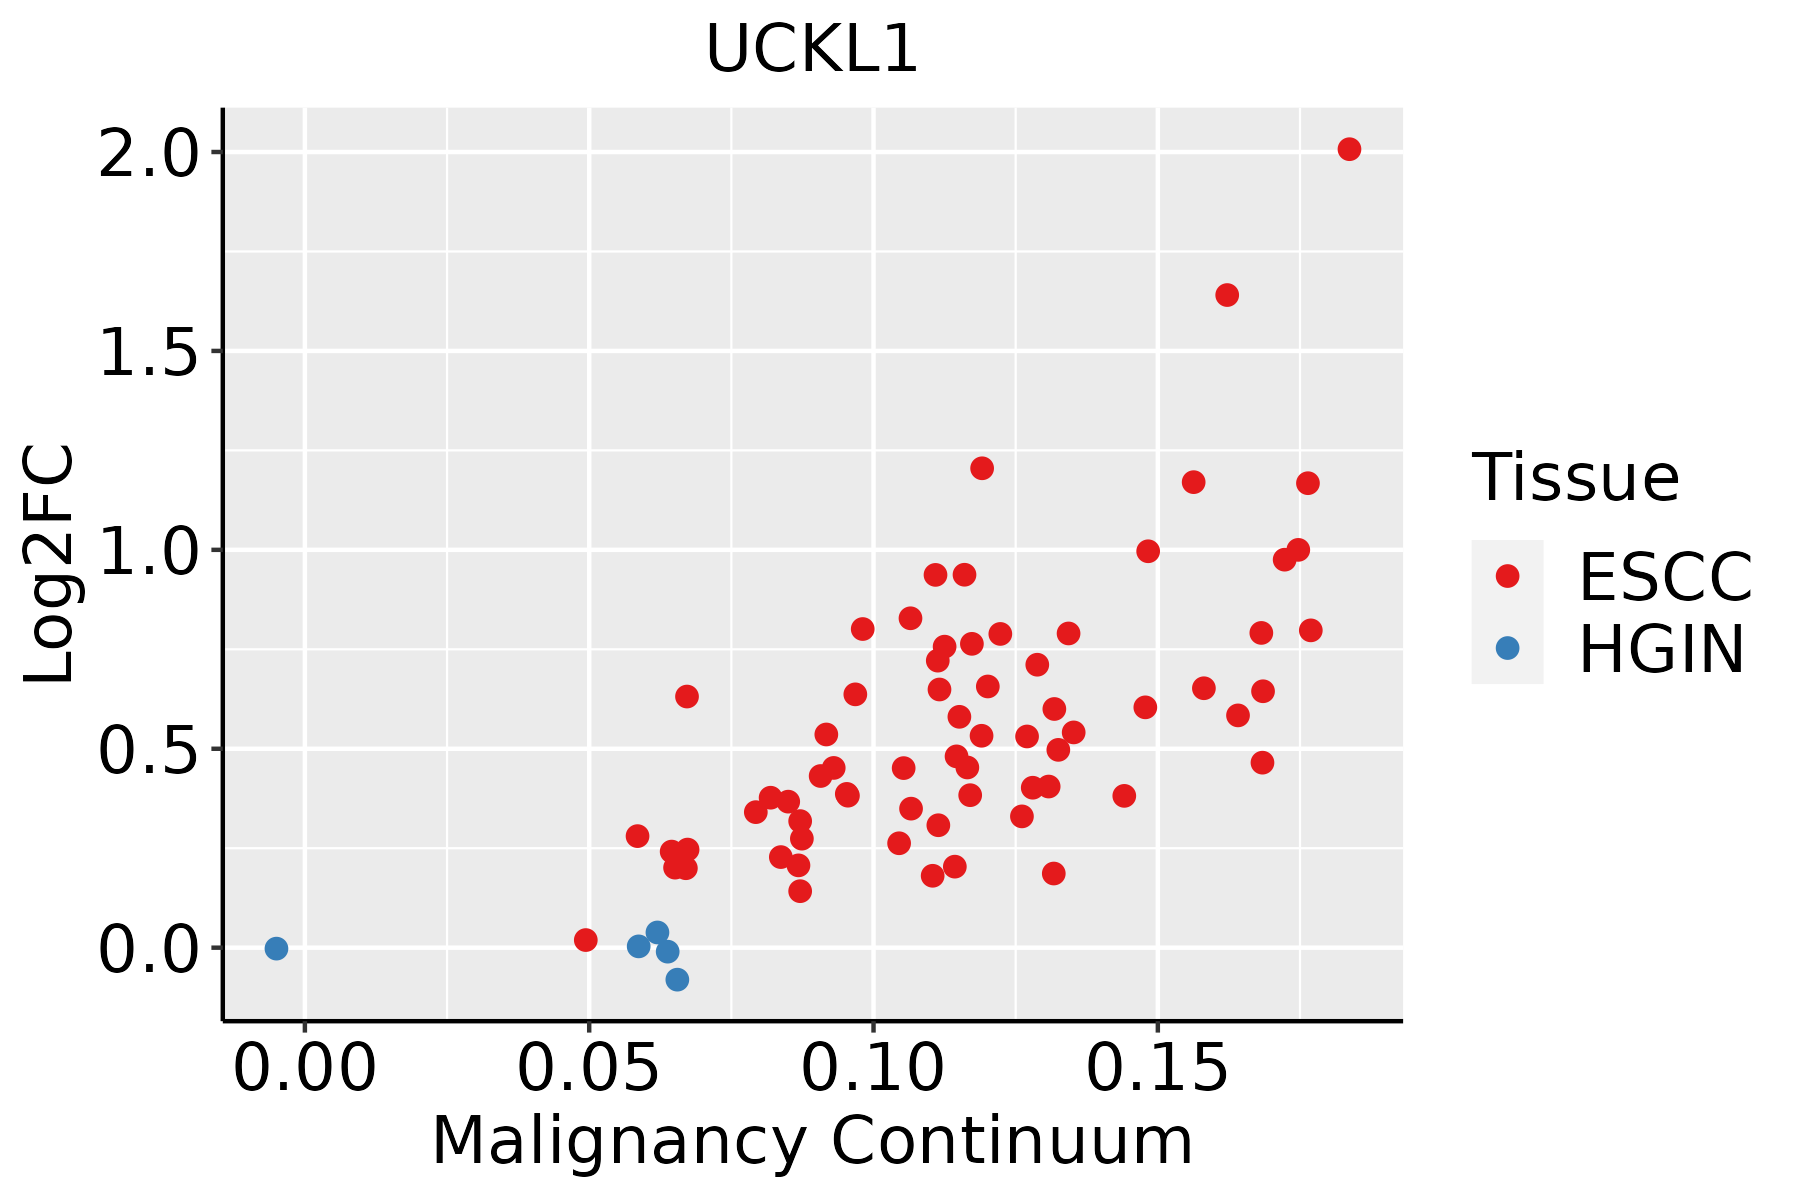 | ESCC: Esophageal squamous cell carcinoma |
| HGIN: High-grade intraepithelial neoplasias | ||
| LGIN: Low-grade intraepithelial neoplasias | ||
| Liver |  | HCC: Hepatocellular carcinoma |
| NAFLD: Non-alcoholic fatty liver disease | ||
| Oral Cavity | 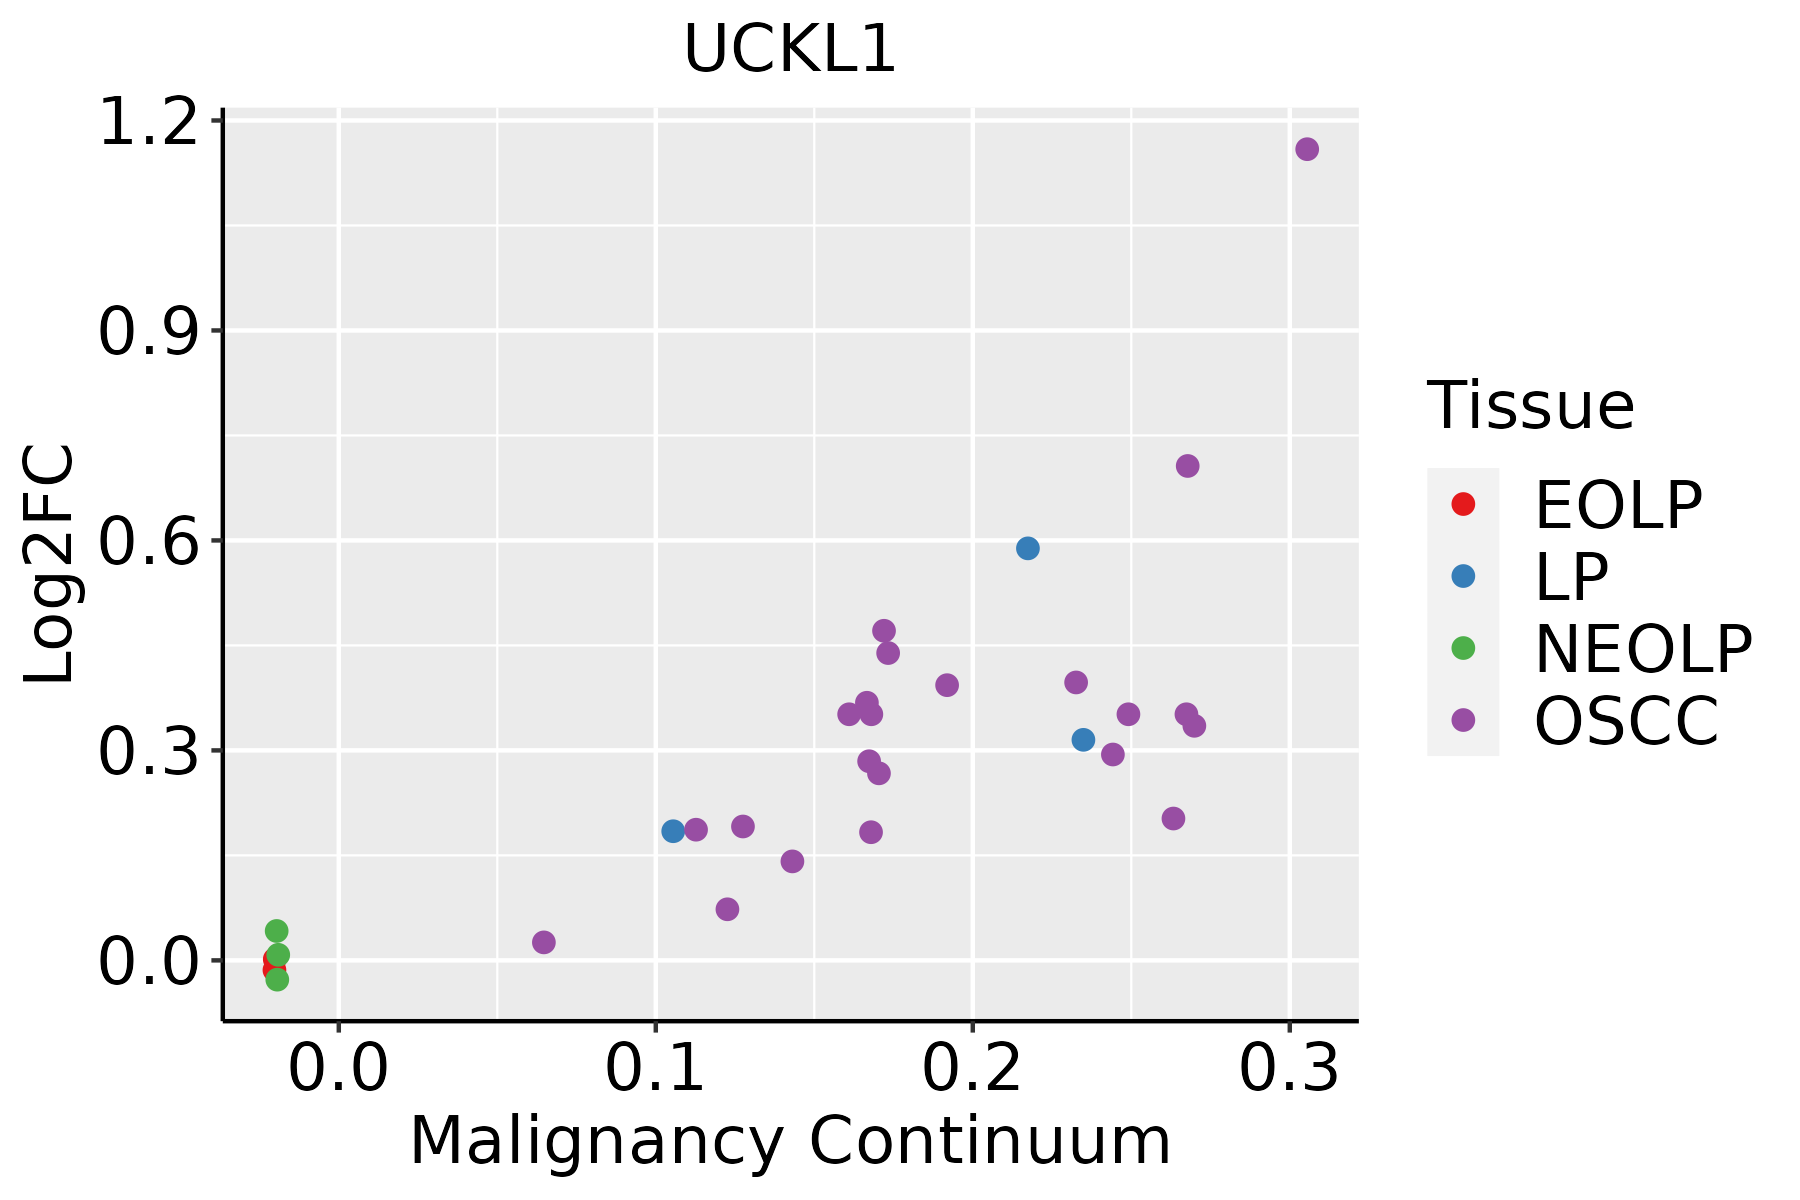 | EOLP: Erosive Oral lichen planus |
| LP: leukoplakia | ||
| NEOLP: Non-erosive oral lichen planus | ||
| OSCC: Oral squamous cell carcinoma | ||
| Skin | 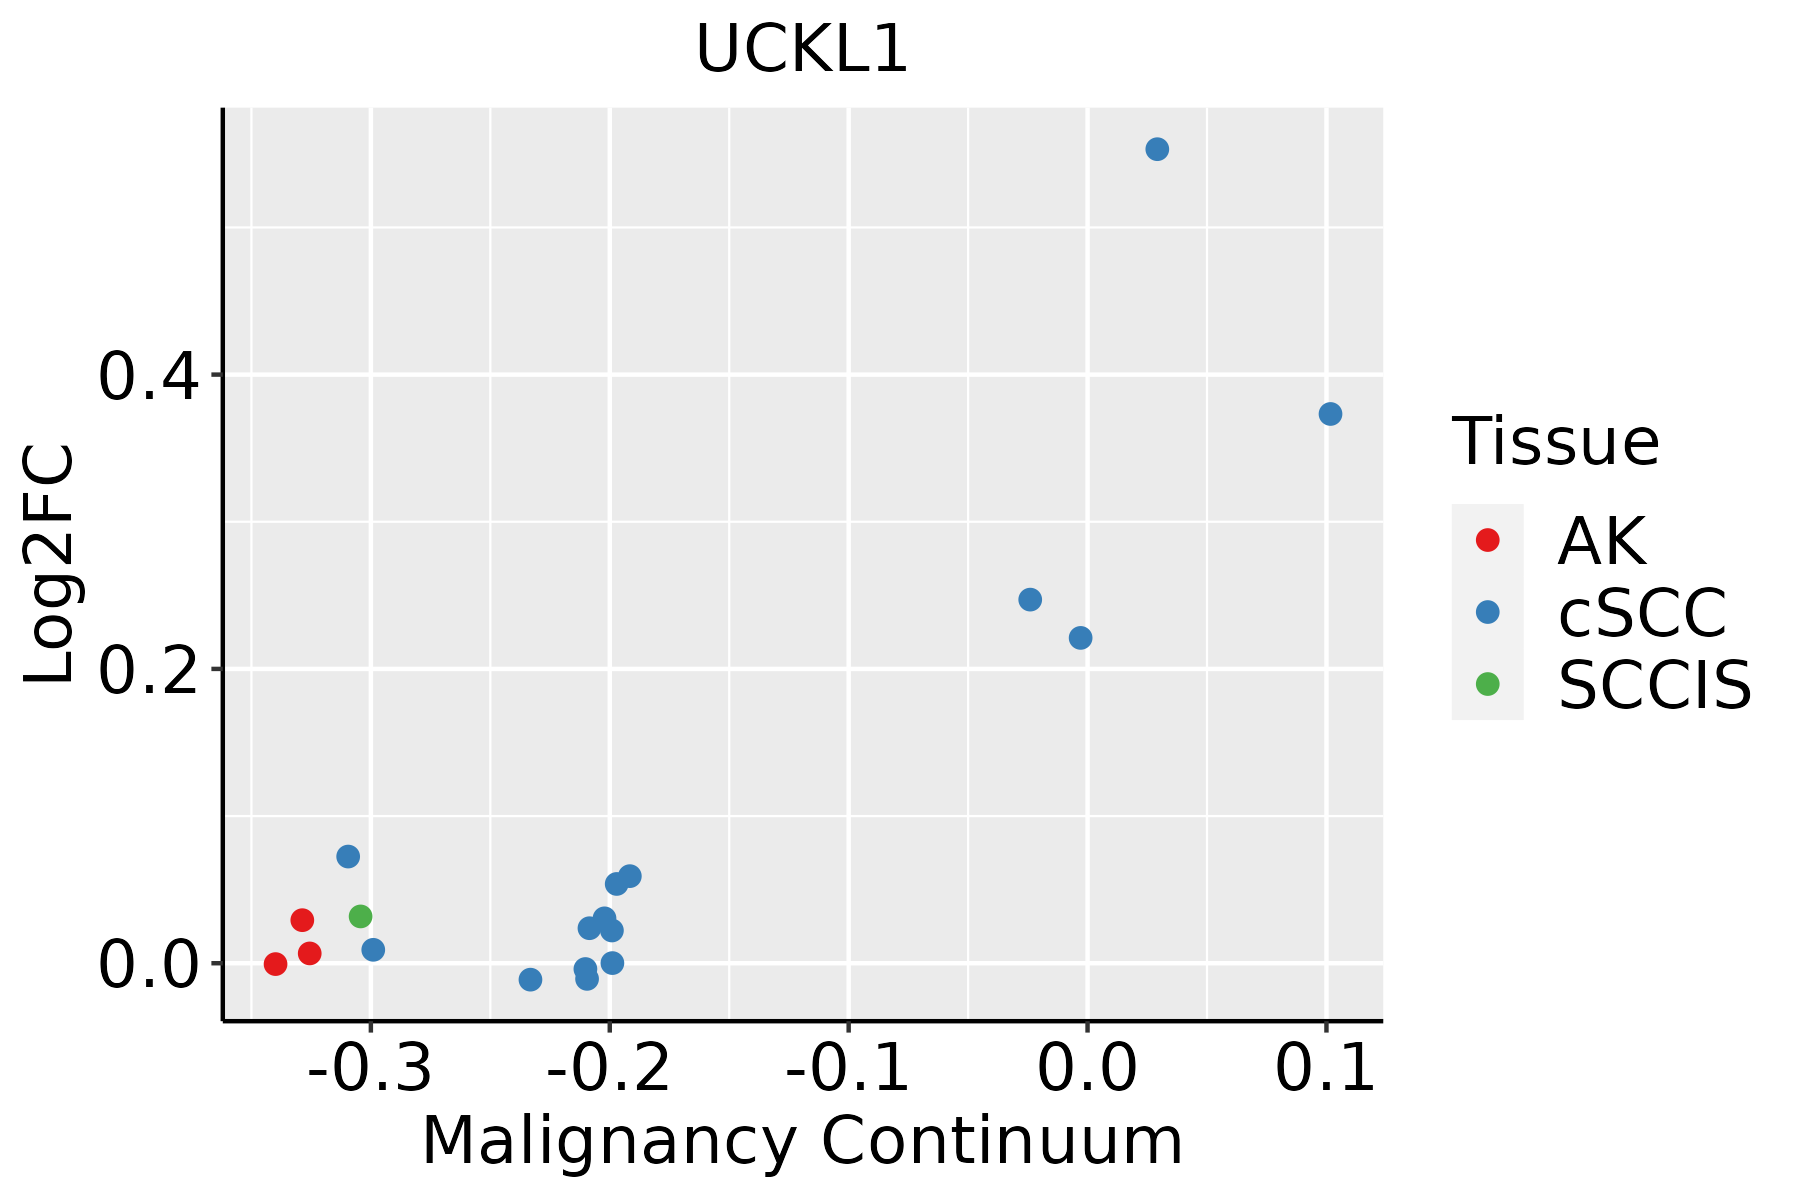 | AK: Actinic keratosis |
| cSCC: Cutaneous squamous cell carcinoma | ||
| SCCIS:squamous cell carcinoma in situ |
| ∗log2FC in expression of this searched gene in stem-like cells from each diseased tissue sample relative to stem-like cells in normal samples in each tissue plotted against the malignancy continuum. Samples are colored based on if they are from different disease stage. |
Top |
Malignant transformation related pathway analysis |
| Find out the enriched GO biological processes and KEGG pathways involved in transition from healthy to precancer to cancer |
| Tissue | Disease Stage | Enriched GO biological Processes |
| Colorectum | AD |  |
| Colorectum | SER |  |
| Colorectum | MSS |  |
| Colorectum | MSI-H |  |
| Colorectum | FAP |  |
| ∗Top 15 enriched GO BP terms are showed in the bar plot of each disease state in each tissue. Each row represents a significant GO biological process which is colored according to the -log10(p.adjust). |
| Page: 1 2 3 4 5 6 7 8 9 |
| GO ID | Tissue | Disease Stage | Description | Gene Ratio | Bg Ratio | pvalue | p.adjust | Count |
| GO:0006753110 | Esophagus | ESCC | nucleoside phosphate metabolic process | 288/8552 | 497/18723 | 1.80e-08 | 3.50e-07 | 288 |
| GO:0019693111 | Esophagus | ESCC | ribose phosphate metabolic process | 234/8552 | 396/18723 | 4.24e-08 | 7.76e-07 | 234 |
| GO:0009117111 | Esophagus | ESCC | nucleotide metabolic process | 282/8552 | 489/18723 | 4.70e-08 | 8.50e-07 | 282 |
| GO:0009141111 | Esophagus | ESCC | nucleoside triphosphate metabolic process | 78/8552 | 112/18723 | 2.36e-07 | 3.59e-06 | 78 |
| GO:0009259111 | Esophagus | ESCC | ribonucleotide metabolic process | 224/8552 | 385/18723 | 4.41e-07 | 6.00e-06 | 224 |
| GO:0046390110 | Esophagus | ESCC | ribose phosphate biosynthetic process | 119/8552 | 190/18723 | 1.73e-06 | 2.06e-05 | 119 |
| GO:000919918 | Esophagus | ESCC | ribonucleoside triphosphate metabolic process | 61/8552 | 89/18723 | 1.07e-05 | 1.01e-04 | 61 |
| GO:000916516 | Esophagus | ESCC | nucleotide biosynthetic process | 150/8552 | 254/18723 | 1.12e-05 | 1.06e-04 | 150 |
| GO:0009260110 | Esophagus | ESCC | ribonucleotide biosynthetic process | 112/8552 | 182/18723 | 1.12e-05 | 1.06e-04 | 112 |
| GO:190129316 | Esophagus | ESCC | nucleoside phosphate biosynthetic process | 151/8552 | 256/18723 | 1.15e-05 | 1.08e-04 | 151 |
| GO:000914219 | Esophagus | ESCC | nucleoside triphosphate biosynthetic process | 58/8552 | 85/18723 | 2.16e-05 | 1.87e-04 | 58 |
| GO:000920118 | Esophagus | ESCC | ribonucleoside triphosphate biosynthetic process | 50/8552 | 74/18723 | 1.16e-04 | 8.04e-04 | 50 |
| GO:19016574 | Esophagus | ESCC | glycosyl compound metabolic process | 57/8552 | 88/18723 | 2.32e-04 | 1.44e-03 | 57 |
| GO:00062203 | Esophagus | ESCC | pyrimidine nucleotide metabolic process | 35/8552 | 50/18723 | 4.33e-04 | 2.44e-03 | 35 |
| GO:00091473 | Esophagus | ESCC | pyrimidine nucleoside triphosphate metabolic process | 20/8552 | 25/18723 | 4.81e-04 | 2.69e-03 | 20 |
| GO:00091234 | Esophagus | ESCC | nucleoside monophosphate metabolic process | 49/8552 | 76/18723 | 7.30e-04 | 3.80e-03 | 49 |
| GO:00725273 | Esophagus | ESCC | pyrimidine-containing compound metabolic process | 52/8552 | 82/18723 | 9.03e-04 | 4.61e-03 | 52 |
| GO:00091615 | Esophagus | ESCC | ribonucleoside monophosphate metabolic process | 38/8552 | 58/18723 | 1.81e-03 | 8.32e-03 | 38 |
| GO:00091243 | Esophagus | ESCC | nucleoside monophosphate biosynthetic process | 29/8552 | 42/18723 | 1.87e-03 | 8.46e-03 | 29 |
| GO:00091483 | Esophagus | ESCC | pyrimidine nucleoside triphosphate biosynthetic process | 15/8552 | 19/18723 | 3.29e-03 | 1.35e-02 | 15 |
| Page: 1 2 3 4 5 6 7 |
| Pathway ID | Tissue | Disease Stage | Description | Gene Ratio | Bg Ratio | pvalue | p.adjust | qvalue | Count |
| hsa012325 | Esophagus | ESCC | Nucleotide metabolism | 59/4205 | 85/8465 | 1.67e-04 | 6.58e-04 | 3.37e-04 | 59 |
| hsa002405 | Esophagus | ESCC | Pyrimidine metabolism | 41/4205 | 58/8465 | 9.14e-04 | 2.92e-03 | 1.49e-03 | 41 |
| hsa0123212 | Esophagus | ESCC | Nucleotide metabolism | 59/4205 | 85/8465 | 1.67e-04 | 6.58e-04 | 3.37e-04 | 59 |
| hsa0024012 | Esophagus | ESCC | Pyrimidine metabolism | 41/4205 | 58/8465 | 9.14e-04 | 2.92e-03 | 1.49e-03 | 41 |
| hsa002402 | Liver | HCC | Pyrimidine metabolism | 44/4020 | 58/8465 | 9.34e-06 | 7.11e-05 | 3.95e-05 | 44 |
| hsa012322 | Liver | HCC | Nucleotide metabolism | 59/4020 | 85/8465 | 3.30e-05 | 1.88e-04 | 1.04e-04 | 59 |
| hsa009832 | Liver | HCC | Drug metabolism - other enzymes | 54/4020 | 80/8465 | 2.25e-04 | 1.09e-03 | 6.08e-04 | 54 |
| hsa002403 | Liver | HCC | Pyrimidine metabolism | 44/4020 | 58/8465 | 9.34e-06 | 7.11e-05 | 3.95e-05 | 44 |
| hsa012323 | Liver | HCC | Nucleotide metabolism | 59/4020 | 85/8465 | 3.30e-05 | 1.88e-04 | 1.04e-04 | 59 |
| hsa009833 | Liver | HCC | Drug metabolism - other enzymes | 54/4020 | 80/8465 | 2.25e-04 | 1.09e-03 | 6.08e-04 | 54 |
| hsa012324 | Oral cavity | OSCC | Nucleotide metabolism | 54/3704 | 85/8465 | 1.78e-04 | 5.95e-04 | 3.03e-04 | 54 |
| hsa002404 | Oral cavity | OSCC | Pyrimidine metabolism | 37/3704 | 58/8465 | 1.62e-03 | 4.45e-03 | 2.26e-03 | 37 |
| hsa0123211 | Oral cavity | OSCC | Nucleotide metabolism | 54/3704 | 85/8465 | 1.78e-04 | 5.95e-04 | 3.03e-04 | 54 |
| hsa0024011 | Oral cavity | OSCC | Pyrimidine metabolism | 37/3704 | 58/8465 | 1.62e-03 | 4.45e-03 | 2.26e-03 | 37 |
| hsa0123221 | Oral cavity | LP | Nucleotide metabolism | 42/2418 | 85/8465 | 3.62e-05 | 2.36e-04 | 1.52e-04 | 42 |
| hsa0024021 | Oral cavity | LP | Pyrimidine metabolism | 28/2418 | 58/8465 | 1.12e-03 | 5.02e-03 | 3.24e-03 | 28 |
| hsa0123231 | Oral cavity | LP | Nucleotide metabolism | 42/2418 | 85/8465 | 3.62e-05 | 2.36e-04 | 1.52e-04 | 42 |
| hsa0024031 | Oral cavity | LP | Pyrimidine metabolism | 28/2418 | 58/8465 | 1.12e-03 | 5.02e-03 | 3.24e-03 | 28 |
| Page: 1 |
Top |
Cell-cell communication analysis |
| Identification of potential cell-cell interactions between two cell types and their ligand-receptor pairs for different disease states |
| Ligand | Receptor | LRpair | Pathway | Tissue | Disease Stage |
| Page: 1 |
Top |
Single-cell gene regulatory network inference analysis |
| Find out the significant the regulons (TFs) and the target genes of each regulon across cell types for different disease states |
| TF | Cell Type | Tissue | Disease Stage | Target Gene | RSS | Regulon Activity |
| ∗The dot plots of a searched regulon are shown for all cell subpopulations in each disease state of each tissue based on the regulon specific score inferred using pySCENIC and by calculating the average expression. |
| Page: 1 |
Top |
Somatic mutation of malignant transformation related genes |
| Annotation of somatic variants for genes involved in malignant transformation |
| Hugo Symbol | Variant Class | Variant Classification | dbSNP RS | HGVSc | HGVSp | HGVSp Short | SWISSPROT | BIOTYPE | SIFT | PolyPhen | Tumor Sample Barcode | Tissue | Histology | Sex | Age | Stage | Therapy Types | Drugs | Outcome |
| UCKL1 | SNV | Missense_Mutation | c.604G>A | p.Val202Ile | p.V202I | Q9NWZ5 | protein_coding | tolerated(0.17) | possibly_damaging(0.9) | TCGA-AO-A128-01 | Breast | breast invasive carcinoma | Female | <65 | I/II | Chemotherapy | doxorubicin | SD | |
| UCKL1 | deletion | Frame_Shift_Del | novel | c.1452delN | p.Leu485SerfsTer17 | p.L485Sfs*17 | Q9NWZ5 | protein_coding | TCGA-D8-A27V-01 | Breast | breast invasive carcinoma | Female | <65 | I/II | Hormone Therapy | tamoxiphen | SD | ||
| UCKL1 | deletion | Frame_Shift_Del | novel | c.288delN | p.Glu97ArgfsTer21 | p.E97Rfs*21 | Q9NWZ5 | protein_coding | TCGA-D8-A27V-01 | Breast | breast invasive carcinoma | Female | <65 | I/II | Hormone Therapy | tamoxiphen | SD | ||
| UCKL1 | SNV | Missense_Mutation | novel | c.1583N>A | p.Arg528His | p.R528H | Q9NWZ5 | protein_coding | deleterious(0) | probably_damaging(0.997) | TCGA-2W-A8YY-01 | Cervix | cervical & endocervical cancer | Female | <65 | I/II | Chemotherapy | cisplatin | CR |
| UCKL1 | SNV | Missense_Mutation | c.612N>G | p.Ile204Met | p.I204M | Q9NWZ5 | protein_coding | deleterious(0) | probably_damaging(0.994) | TCGA-C5-A1MH-01 | Cervix | cervical & endocervical cancer | Female | >=65 | III/IV | Chemotherapy | cisplatin | PD | |
| UCKL1 | SNV | Missense_Mutation | novel | c.1091N>C | p.His364Pro | p.H364P | Q9NWZ5 | protein_coding | tolerated(0.1) | benign(0.285) | TCGA-DS-A1OB-01 | Cervix | cervical & endocervical cancer | Female | <65 | I/II | Chemotherapy | carboplatin | PD |
| UCKL1 | SNV | Missense_Mutation | c.1053C>G | p.Ile351Met | p.I351M | Q9NWZ5 | protein_coding | deleterious(0) | probably_damaging(0.923) | TCGA-EK-A2R7-01 | Cervix | cervical & endocervical cancer | Female | <65 | I/II | Unknown | Unknown | SD | |
| UCKL1 | insertion | Frame_Shift_Ins | novel | c.1089_1090insT | p.His364SerfsTer41 | p.H364Sfs*41 | Q9NWZ5 | protein_coding | TCGA-DS-A1OB-01 | Cervix | cervical & endocervical cancer | Female | <65 | I/II | Chemotherapy | carboplatin | PD | ||
| UCKL1 | SNV | Missense_Mutation | rs201285389 | c.487G>A | p.Asp163Asn | p.D163N | Q9NWZ5 | protein_coding | tolerated(0.06) | benign(0.373) | TCGA-AA-3984-01 | Colorectum | colon adenocarcinoma | Female | <65 | I/II | Unknown | Unknown | SD |
| UCKL1 | SNV | Missense_Mutation | novel | c.127T>C | p.Ser43Pro | p.S43P | Q9NWZ5 | protein_coding | deleterious(0.02) | benign(0.006) | TCGA-CM-5861-01 | Colorectum | colon adenocarcinoma | Female | <65 | I/II | Unknown | Unknown | PD |
| Page: 1 2 3 4 5 |
Top |
Related drugs of malignant transformation related genes |
| Identification of chemicals and drugs interact with genes involved in malignant transfromation |
| (DGIdb 4.0) |
| Entrez ID | Symbol | Category | Interaction Types | Drug Claim Name | Drug Name | PMIDs |
| Page: 1 |

Copyright 2023-Present -The University of Texas Health Science Center at Houston |