
|
|||||
|
 | |
| |
| |
| |
| |
| |
|
Gene: UCHL5 |
Gene summary for UCHL5 |
| Gene information | Species | Human | Gene symbol | UCHL5 | Gene ID | 51377 |
| Gene name | ubiquitin C-terminal hydrolase L5 | |
| Gene Alias | CGI-70 | |
| Cytomap | 1q31.2 | |
| Gene Type | protein-coding | GO ID | GO:0006139 | UniProtAcc | Q9Y5K5 |
Top |
Malignant transformation analysis |
| Identification of the aberrant gene expression in precancerous and cancerous lesions by comparing the gene expression of stem-like cells in diseased tissues with normal stem cells |
| Entrez ID | Symbol | Replicates | Species | Organ | Tissue | Adj P-value | Log2FC | Malignancy |
| 51377 | UCHL5 | LZE2T | Human | Esophagus | ESCC | 9.05e-06 | 9.70e-01 | 0.082 |
| 51377 | UCHL5 | LZE4T | Human | Esophagus | ESCC | 3.64e-14 | 4.26e-01 | 0.0811 |
| 51377 | UCHL5 | LZE7T | Human | Esophagus | ESCC | 1.94e-07 | 5.55e-01 | 0.0667 |
| 51377 | UCHL5 | LZE8T | Human | Esophagus | ESCC | 8.15e-06 | 1.91e-01 | 0.067 |
| 51377 | UCHL5 | LZE20T | Human | Esophagus | ESCC | 8.81e-03 | 2.28e-01 | 0.0662 |
| 51377 | UCHL5 | LZE22T | Human | Esophagus | ESCC | 1.16e-05 | 4.74e-01 | 0.068 |
| 51377 | UCHL5 | LZE24T | Human | Esophagus | ESCC | 4.54e-14 | 4.54e-01 | 0.0596 |
| 51377 | UCHL5 | LZE6T | Human | Esophagus | ESCC | 2.34e-05 | 3.87e-01 | 0.0845 |
| 51377 | UCHL5 | P1T-E | Human | Esophagus | ESCC | 6.38e-12 | 4.91e-01 | 0.0875 |
| 51377 | UCHL5 | P2T-E | Human | Esophagus | ESCC | 4.90e-46 | 7.54e-01 | 0.1177 |
| 51377 | UCHL5 | P4T-E | Human | Esophagus | ESCC | 1.29e-24 | 7.26e-01 | 0.1323 |
| 51377 | UCHL5 | P5T-E | Human | Esophagus | ESCC | 2.39e-36 | 8.11e-01 | 0.1327 |
| 51377 | UCHL5 | P8T-E | Human | Esophagus | ESCC | 1.97e-20 | 2.96e-01 | 0.0889 |
| 51377 | UCHL5 | P9T-E | Human | Esophagus | ESCC | 2.33e-14 | 3.93e-01 | 0.1131 |
| 51377 | UCHL5 | P10T-E | Human | Esophagus | ESCC | 9.60e-27 | 5.19e-01 | 0.116 |
| 51377 | UCHL5 | P11T-E | Human | Esophagus | ESCC | 1.05e-13 | 4.14e-01 | 0.1426 |
| 51377 | UCHL5 | P12T-E | Human | Esophagus | ESCC | 1.05e-21 | 3.18e-01 | 0.1122 |
| 51377 | UCHL5 | P15T-E | Human | Esophagus | ESCC | 3.69e-14 | 4.17e-01 | 0.1149 |
| 51377 | UCHL5 | P16T-E | Human | Esophagus | ESCC | 5.05e-29 | 6.28e-01 | 0.1153 |
| 51377 | UCHL5 | P17T-E | Human | Esophagus | ESCC | 5.52e-08 | 5.21e-01 | 0.1278 |
| Page: 1 2 3 4 5 |
| Tissue | Expression Dynamics | Abbreviation |
| Esophagus |  | ESCC: Esophageal squamous cell carcinoma |
| HGIN: High-grade intraepithelial neoplasias | ||
| LGIN: Low-grade intraepithelial neoplasias | ||
| Liver |  | HCC: Hepatocellular carcinoma |
| NAFLD: Non-alcoholic fatty liver disease | ||
| Oral Cavity | 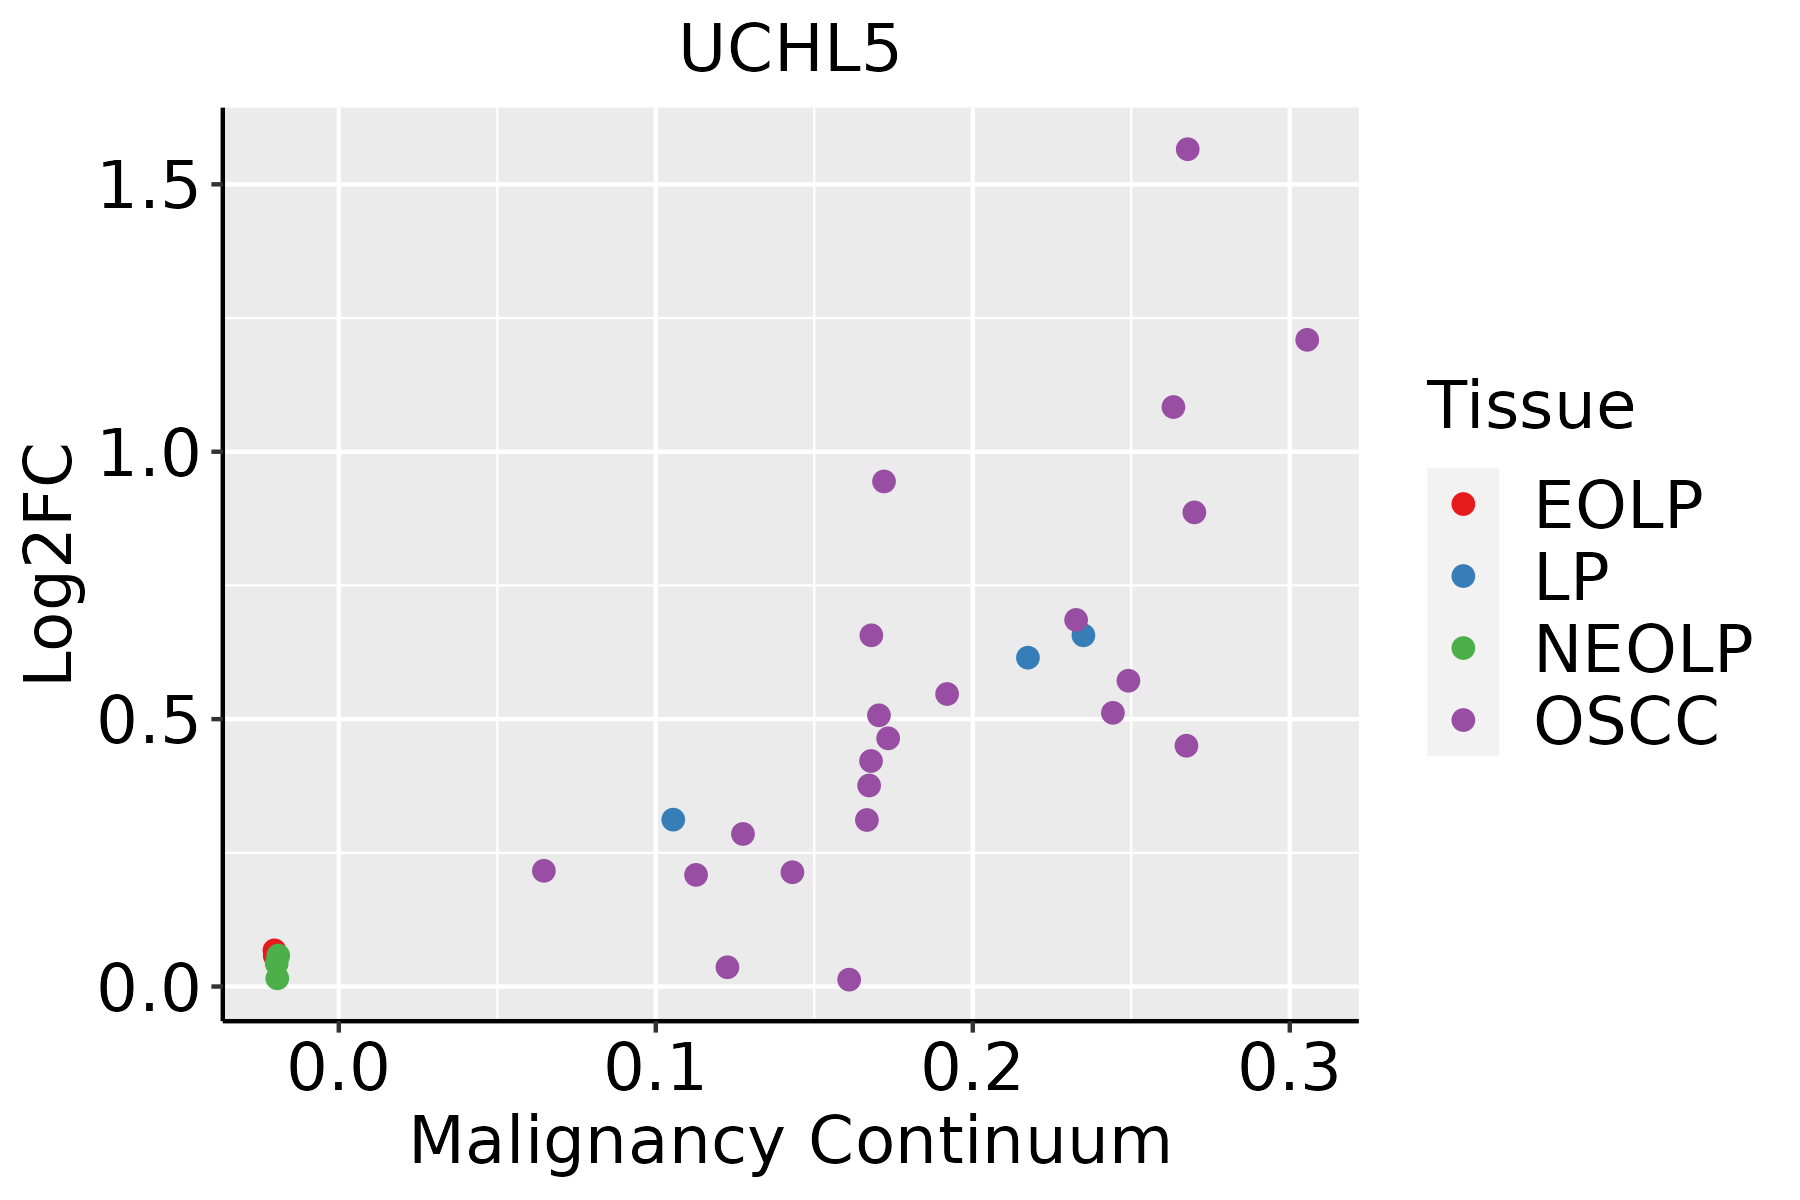 | EOLP: Erosive Oral lichen planus |
| LP: leukoplakia | ||
| NEOLP: Non-erosive oral lichen planus | ||
| OSCC: Oral squamous cell carcinoma | ||
| Skin |  | AK: Actinic keratosis |
| cSCC: Cutaneous squamous cell carcinoma | ||
| SCCIS:squamous cell carcinoma in situ |
| ∗log2FC in expression of this searched gene in stem-like cells from each diseased tissue sample relative to stem-like cells in normal samples in each tissue plotted against the malignancy continuum. Samples are colored based on if they are from different disease stage. |
Top |
Malignant transformation related pathway analysis |
| Find out the enriched GO biological processes and KEGG pathways involved in transition from healthy to precancer to cancer |
| Tissue | Disease Stage | Enriched GO biological Processes |
| Colorectum | AD |  |
| Colorectum | SER |  |
| Colorectum | MSS |  |
| Colorectum | MSI-H |  |
| Colorectum | FAP |  |
| ∗Top 15 enriched GO BP terms are showed in the bar plot of each disease state in each tissue. Each row represents a significant GO biological process which is colored according to the -log10(p.adjust). |
| Page: 1 2 3 4 5 6 7 8 9 |
| GO ID | Tissue | Disease Stage | Description | Gene Ratio | Bg Ratio | pvalue | p.adjust | Count |
| GO:0010498111 | Esophagus | ESCC | proteasomal protein catabolic process | 369/8552 | 490/18723 | 1.13e-41 | 1.80e-38 | 369 |
| GO:0043161111 | Esophagus | ESCC | proteasome-mediated ubiquitin-dependent protein catabolic process | 312/8552 | 412/18723 | 3.53e-36 | 4.48e-33 | 312 |
| GO:0042176111 | Esophagus | ESCC | regulation of protein catabolic process | 280/8552 | 391/18723 | 8.65e-26 | 2.39e-23 | 280 |
| GO:1903362111 | Esophagus | ESCC | regulation of cellular protein catabolic process | 188/8552 | 255/18723 | 5.12e-20 | 6.62e-18 | 188 |
| GO:1903050111 | Esophagus | ESCC | regulation of proteolysis involved in cellular protein catabolic process | 163/8552 | 221/18723 | 1.44e-17 | 1.27e-15 | 163 |
| GO:0061136111 | Esophagus | ESCC | regulation of proteasomal protein catabolic process | 142/8552 | 187/18723 | 2.40e-17 | 2.00e-15 | 142 |
| GO:0032434111 | Esophagus | ESCC | regulation of proteasomal ubiquitin-dependent protein catabolic process | 107/8552 | 134/18723 | 4.06e-16 | 2.93e-14 | 107 |
| GO:2000058111 | Esophagus | ESCC | regulation of ubiquitin-dependent protein catabolic process | 125/8552 | 164/18723 | 1.17e-15 | 7.76e-14 | 125 |
| GO:0009895111 | Esophagus | ESCC | negative regulation of catabolic process | 201/8552 | 320/18723 | 3.88e-10 | 1.05e-08 | 201 |
| GO:0052547111 | Esophagus | ESCC | regulation of peptidase activity | 275/8552 | 461/18723 | 7.54e-10 | 1.88e-08 | 275 |
| GO:0031330111 | Esophagus | ESCC | negative regulation of cellular catabolic process | 166/8552 | 262/18723 | 5.17e-09 | 1.08e-07 | 166 |
| GO:0052548111 | Esophagus | ESCC | regulation of endopeptidase activity | 253/8552 | 432/18723 | 3.68e-08 | 6.78e-07 | 253 |
| GO:0042177111 | Esophagus | ESCC | negative regulation of protein catabolic process | 84/8552 | 121/18723 | 1.03e-07 | 1.69e-06 | 84 |
| GO:2000059111 | Esophagus | ESCC | negative regulation of ubiquitin-dependent protein catabolic process | 37/8552 | 48/18723 | 8.99e-06 | 8.65e-05 | 37 |
| GO:003243510 | Esophagus | ESCC | negative regulation of proteasomal ubiquitin-dependent protein catabolic process | 28/8552 | 35/18723 | 3.40e-05 | 2.78e-04 | 28 |
| GO:1903363110 | Esophagus | ESCC | negative regulation of cellular protein catabolic process | 51/8552 | 75/18723 | 7.70e-05 | 5.74e-04 | 51 |
| GO:0045861111 | Esophagus | ESCC | negative regulation of proteolysis | 195/8552 | 351/18723 | 1.13e-04 | 7.85e-04 | 195 |
| GO:007064612 | Esophagus | ESCC | protein modification by small protein removal | 95/8552 | 157/18723 | 1.25e-04 | 8.56e-04 | 95 |
| GO:1903051110 | Esophagus | ESCC | negative regulation of proteolysis involved in cellular protein catabolic process | 44/8552 | 64/18723 | 1.59e-04 | 1.05e-03 | 44 |
| GO:0051346110 | Esophagus | ESCC | negative regulation of hydrolase activity | 208/8552 | 379/18723 | 1.76e-04 | 1.14e-03 | 208 |
| Page: 1 2 3 4 5 6 7 |
| Pathway ID | Tissue | Disease Stage | Description | Gene Ratio | Bg Ratio | pvalue | p.adjust | qvalue | Count |
| Page: 1 |
Top |
Cell-cell communication analysis |
| Identification of potential cell-cell interactions between two cell types and their ligand-receptor pairs for different disease states |
| Ligand | Receptor | LRpair | Pathway | Tissue | Disease Stage |
| Page: 1 |
Top |
Single-cell gene regulatory network inference analysis |
| Find out the significant the regulons (TFs) and the target genes of each regulon across cell types for different disease states |
| TF | Cell Type | Tissue | Disease Stage | Target Gene | RSS | Regulon Activity |
| ∗The dot plots of a searched regulon are shown for all cell subpopulations in each disease state of each tissue based on the regulon specific score inferred using pySCENIC and by calculating the average expression. |
| Page: 1 |
Top |
Somatic mutation of malignant transformation related genes |
| Annotation of somatic variants for genes involved in malignant transformation |
| Hugo Symbol | Variant Class | Variant Classification | dbSNP RS | HGVSc | HGVSp | HGVSp Short | SWISSPROT | BIOTYPE | SIFT | PolyPhen | Tumor Sample Barcode | Tissue | Histology | Sex | Age | Stage | Therapy Types | Drugs | Outcome |
| UCHL5 | SNV | Missense_Mutation | c.419A>G | p.His140Arg | p.H140R | Q9Y5K5 | protein_coding | deleterious(0) | probably_damaging(0.998) | TCGA-A2-A0T0-01 | Breast | breast invasive carcinoma | Female | <65 | I/II | Chemotherapy | taxotere | SD | |
| UCHL5 | SNV | Missense_Mutation | c.754N>G | p.Gln252Glu | p.Q252E | Q9Y5K5 | protein_coding | tolerated(0.84) | benign(0.001) | TCGA-D8-A1JA-01 | Breast | breast invasive carcinoma | Female | <65 | III/IV | Chemotherapy | adriamycin | PD | |
| UCHL5 | SNV | Missense_Mutation | c.218G>A | p.Arg73Gln | p.R73Q | Q9Y5K5 | protein_coding | deleterious(0.03) | benign(0.056) | TCGA-AA-3510-01 | Colorectum | colon adenocarcinoma | Male | >=65 | I/II | Unknown | Unknown | SD | |
| UCHL5 | insertion | Frame_Shift_Ins | novel | c.410_411insTCTCCCATTA | p.Gln138LeufsTer16 | p.Q138Lfs*16 | Q9Y5K5 | protein_coding | TCGA-AM-5820-01 | Colorectum | colon adenocarcinoma | Female | <65 | I/II | Unknown | Unknown | SD | ||
| UCHL5 | SNV | Missense_Mutation | novel | c.671N>C | p.Val224Ala | p.V224A | Q9Y5K5 | protein_coding | deleterious(0) | possibly_damaging(0.688) | TCGA-A5-A0G2-01 | Endometrium | uterine corpus endometrioid carcinoma | Female | <65 | III/IV | Unknown | Unknown | SD |
| UCHL5 | SNV | Missense_Mutation | novel | c.650N>A | p.Arg217Gln | p.R217Q | Q9Y5K5 | protein_coding | tolerated(0.05) | benign(0.172) | TCGA-A5-A2K5-01 | Endometrium | uterine corpus endometrioid carcinoma | Female | >=65 | I/II | Unknown | Unknown | SD |
| UCHL5 | SNV | Missense_Mutation | novel | c.931C>T | p.Pro311Ser | p.P311S | Q9Y5K5 | protein_coding | deleterious(0.04) | benign(0.186) | TCGA-AP-A051-01 | Endometrium | uterine corpus endometrioid carcinoma | Female | >=65 | I/II | Unknown | Unknown | SD |
| UCHL5 | SNV | Missense_Mutation | novel | c.152N>A | p.Gly51Glu | p.G51E | Q9Y5K5 | protein_coding | deleterious(0) | probably_damaging(1) | TCGA-AP-A1DV-01 | Endometrium | uterine corpus endometrioid carcinoma | Female | <65 | I/II | Unknown | Unknown | SD |
| UCHL5 | SNV | Missense_Mutation | c.839N>T | p.Arg280Ile | p.R280I | Q9Y5K5 | protein_coding | deleterious(0) | benign(0.063) | TCGA-AX-A05Z-01 | Endometrium | uterine corpus endometrioid carcinoma | Female | <65 | III/IV | Chemotherapy | adriamycin | SD | |
| UCHL5 | SNV | Missense_Mutation | c.812N>C | p.Ile271Thr | p.I271T | Q9Y5K5 | protein_coding | deleterious(0) | possibly_damaging(0.811) | TCGA-AX-A06B-01 | Endometrium | uterine corpus endometrioid carcinoma | Female | >=65 | I/II | Unknown | Unknown | SD |
| Page: 1 2 3 4 |
Top |
Related drugs of malignant transformation related genes |
| Identification of chemicals and drugs interact with genes involved in malignant transfromation |
| (DGIdb 4.0) |
| Entrez ID | Symbol | Category | Interaction Types | Drug Claim Name | Drug Name | PMIDs |
| 51377 | UCHL5 | DNA REPAIR, TUMOR SUPPRESSOR, ENZYME, PROTEASE | PMID26077642-Compound-Figure3A |
| Page: 1 |

Copyright 2023-Present -The University of Texas Health Science Center at Houston |