
|
|||||
|
 | |
| |
| |
| |
| |
| |
|
Gene: UCHL3 |
Gene summary for UCHL3 |
| Gene information | Species | Human | Gene symbol | UCHL3 | Gene ID | 7347 |
| Gene name | ubiquitin C-terminal hydrolase L3 | |
| Gene Alias | UCH-L3 | |
| Cytomap | 13q22.2 | |
| Gene Type | protein-coding | GO ID | GO:0006464 | UniProtAcc | A0A087WTB8 |
Top |
Malignant transformation analysis |
| Identification of the aberrant gene expression in precancerous and cancerous lesions by comparing the gene expression of stem-like cells in diseased tissues with normal stem cells |
| Entrez ID | Symbol | Replicates | Species | Organ | Tissue | Adj P-value | Log2FC | Malignancy |
| 7347 | UCHL3 | LZE2T | Human | Esophagus | ESCC | 8.65e-05 | 2.74e-01 | 0.082 |
| 7347 | UCHL3 | LZE4T | Human | Esophagus | ESCC | 3.94e-03 | 2.99e-02 | 0.0811 |
| 7347 | UCHL3 | LZE7T | Human | Esophagus | ESCC | 1.50e-05 | 4.37e-01 | 0.0667 |
| 7347 | UCHL3 | LZE20T | Human | Esophagus | ESCC | 1.02e-03 | 1.12e-01 | 0.0662 |
| 7347 | UCHL3 | LZE24T | Human | Esophagus | ESCC | 1.01e-17 | 4.82e-01 | 0.0596 |
| 7347 | UCHL3 | P1T-E | Human | Esophagus | ESCC | 2.70e-05 | 2.83e-01 | 0.0875 |
| 7347 | UCHL3 | P2T-E | Human | Esophagus | ESCC | 4.20e-17 | 3.99e-01 | 0.1177 |
| 7347 | UCHL3 | P4T-E | Human | Esophagus | ESCC | 2.60e-29 | 8.00e-01 | 0.1323 |
| 7347 | UCHL3 | P5T-E | Human | Esophagus | ESCC | 3.56e-16 | 5.30e-01 | 0.1327 |
| 7347 | UCHL3 | P8T-E | Human | Esophagus | ESCC | 8.33e-20 | 5.81e-01 | 0.0889 |
| 7347 | UCHL3 | P9T-E | Human | Esophagus | ESCC | 6.72e-19 | 4.78e-01 | 0.1131 |
| 7347 | UCHL3 | P10T-E | Human | Esophagus | ESCC | 2.85e-21 | 5.18e-01 | 0.116 |
| 7347 | UCHL3 | P11T-E | Human | Esophagus | ESCC | 2.05e-10 | 6.06e-01 | 0.1426 |
| 7347 | UCHL3 | P12T-E | Human | Esophagus | ESCC | 8.35e-23 | 4.05e-01 | 0.1122 |
| 7347 | UCHL3 | P15T-E | Human | Esophagus | ESCC | 1.55e-18 | 4.22e-01 | 0.1149 |
| 7347 | UCHL3 | P16T-E | Human | Esophagus | ESCC | 1.67e-13 | 1.81e-01 | 0.1153 |
| 7347 | UCHL3 | P17T-E | Human | Esophagus | ESCC | 5.47e-12 | 5.97e-01 | 0.1278 |
| 7347 | UCHL3 | P19T-E | Human | Esophagus | ESCC | 4.43e-06 | 9.79e-01 | 0.1662 |
| 7347 | UCHL3 | P20T-E | Human | Esophagus | ESCC | 2.64e-23 | 5.61e-01 | 0.1124 |
| 7347 | UCHL3 | P21T-E | Human | Esophagus | ESCC | 8.36e-39 | 9.18e-01 | 0.1617 |
| Page: 1 2 3 4 5 6 7 |
| Tissue | Expression Dynamics | Abbreviation |
| Esophagus | 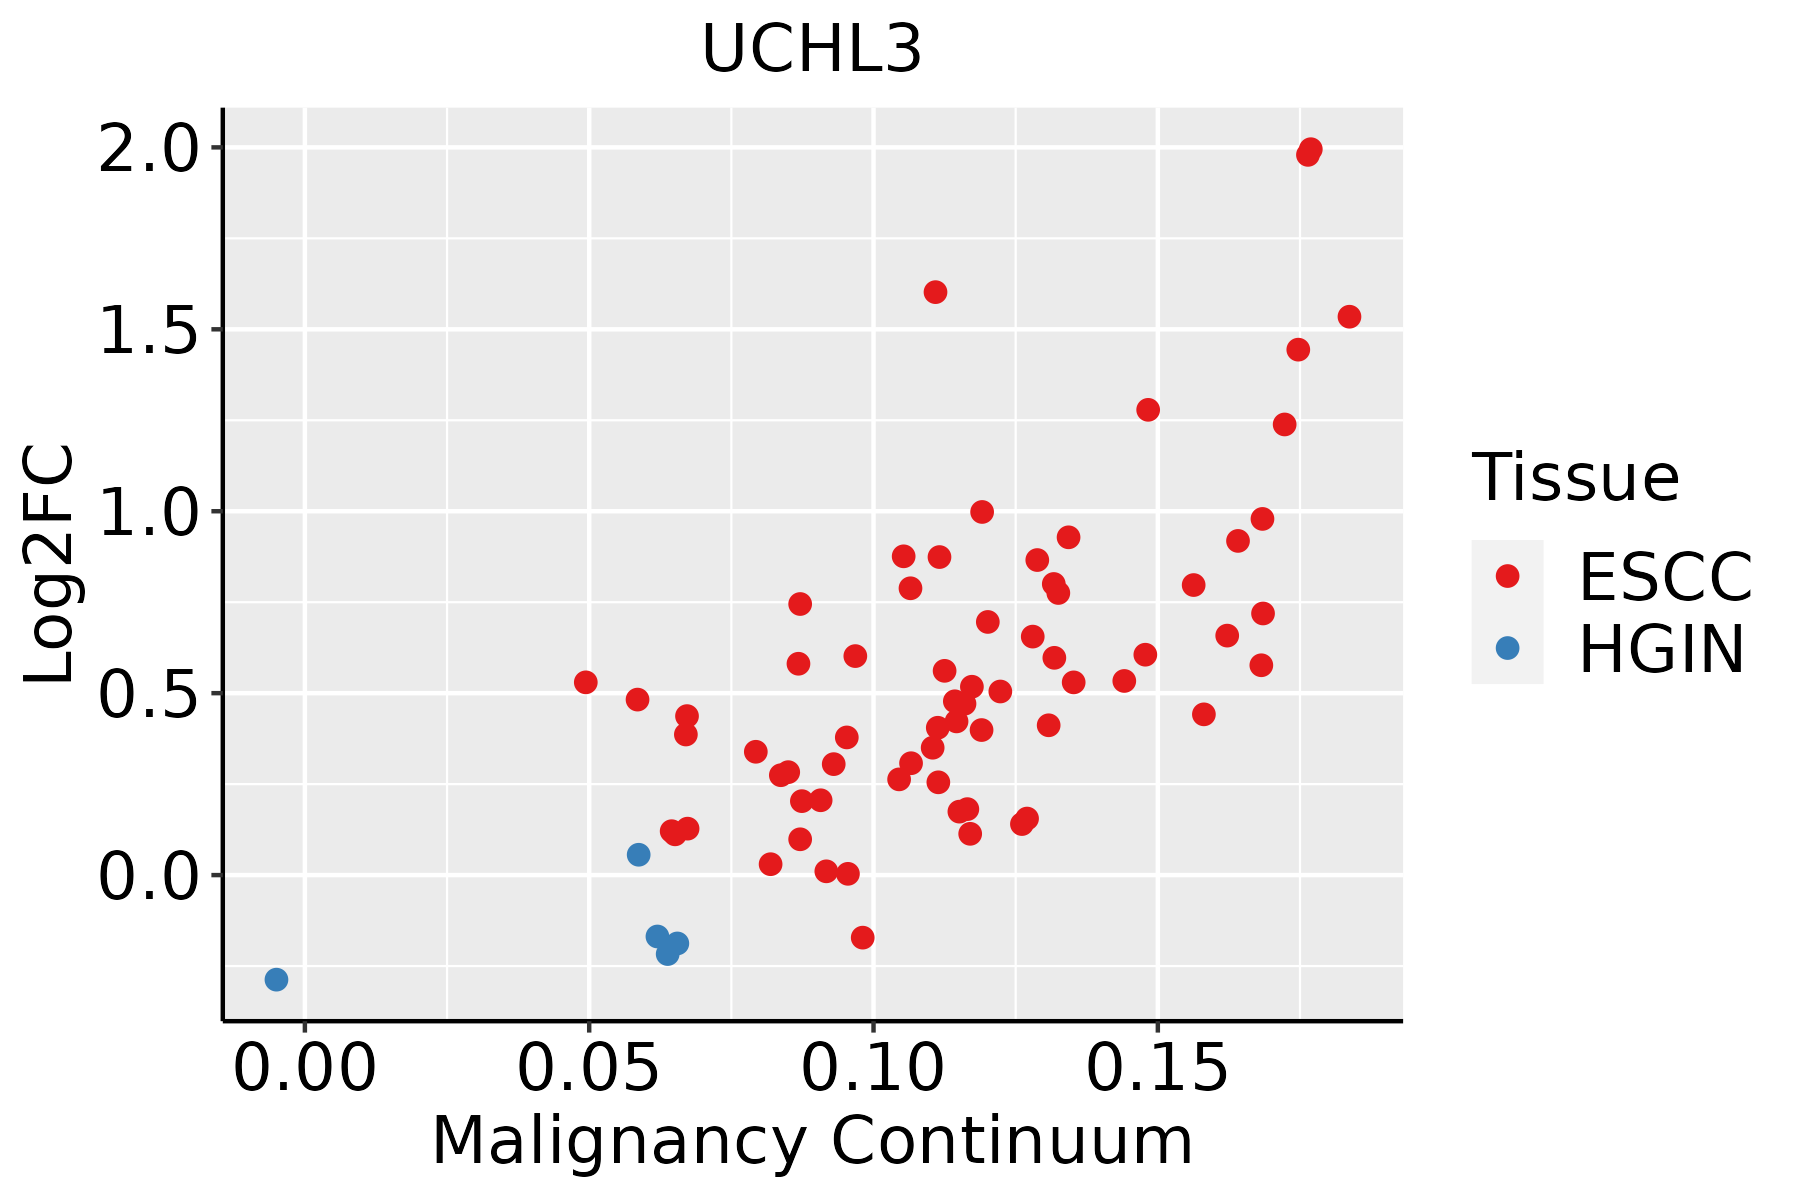 | ESCC: Esophageal squamous cell carcinoma |
| HGIN: High-grade intraepithelial neoplasias | ||
| LGIN: Low-grade intraepithelial neoplasias | ||
| Liver | 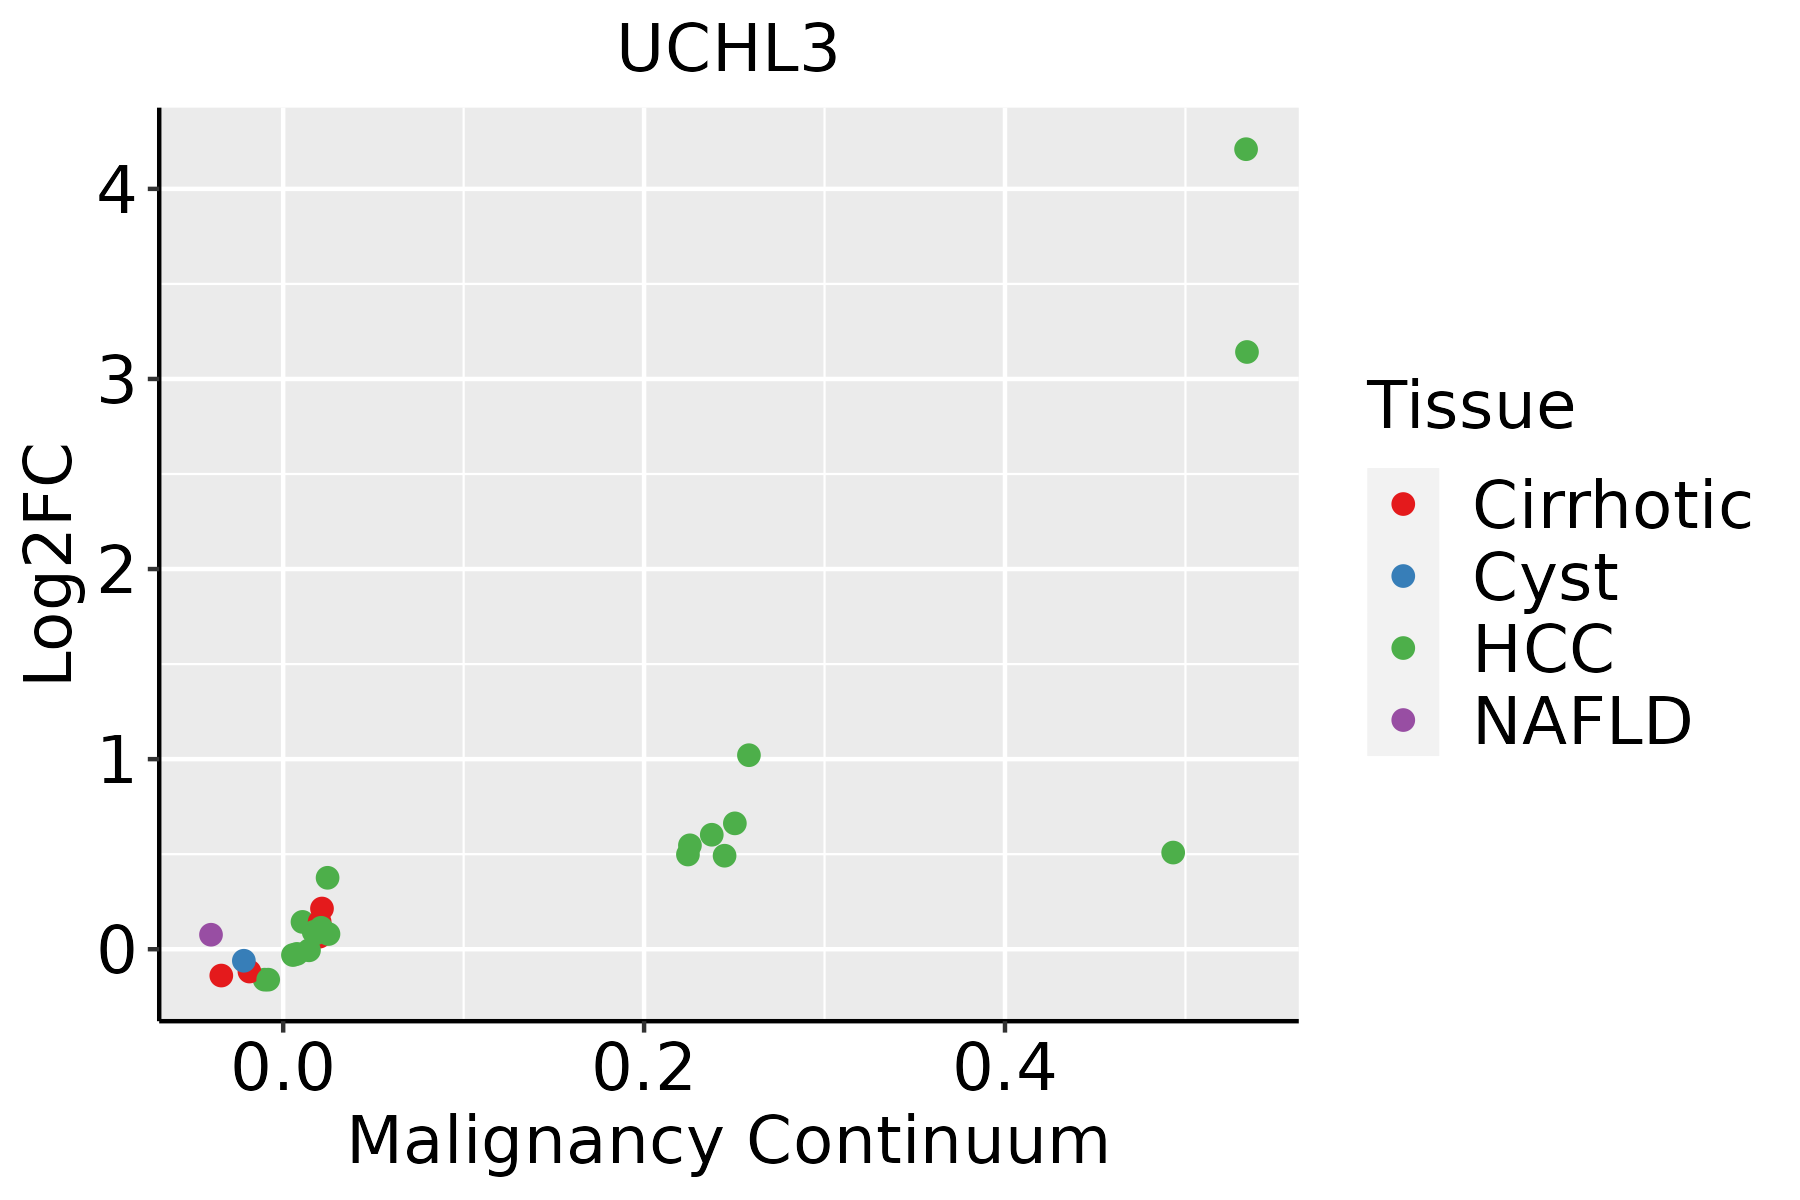 | HCC: Hepatocellular carcinoma |
| NAFLD: Non-alcoholic fatty liver disease | ||
| Oral Cavity | 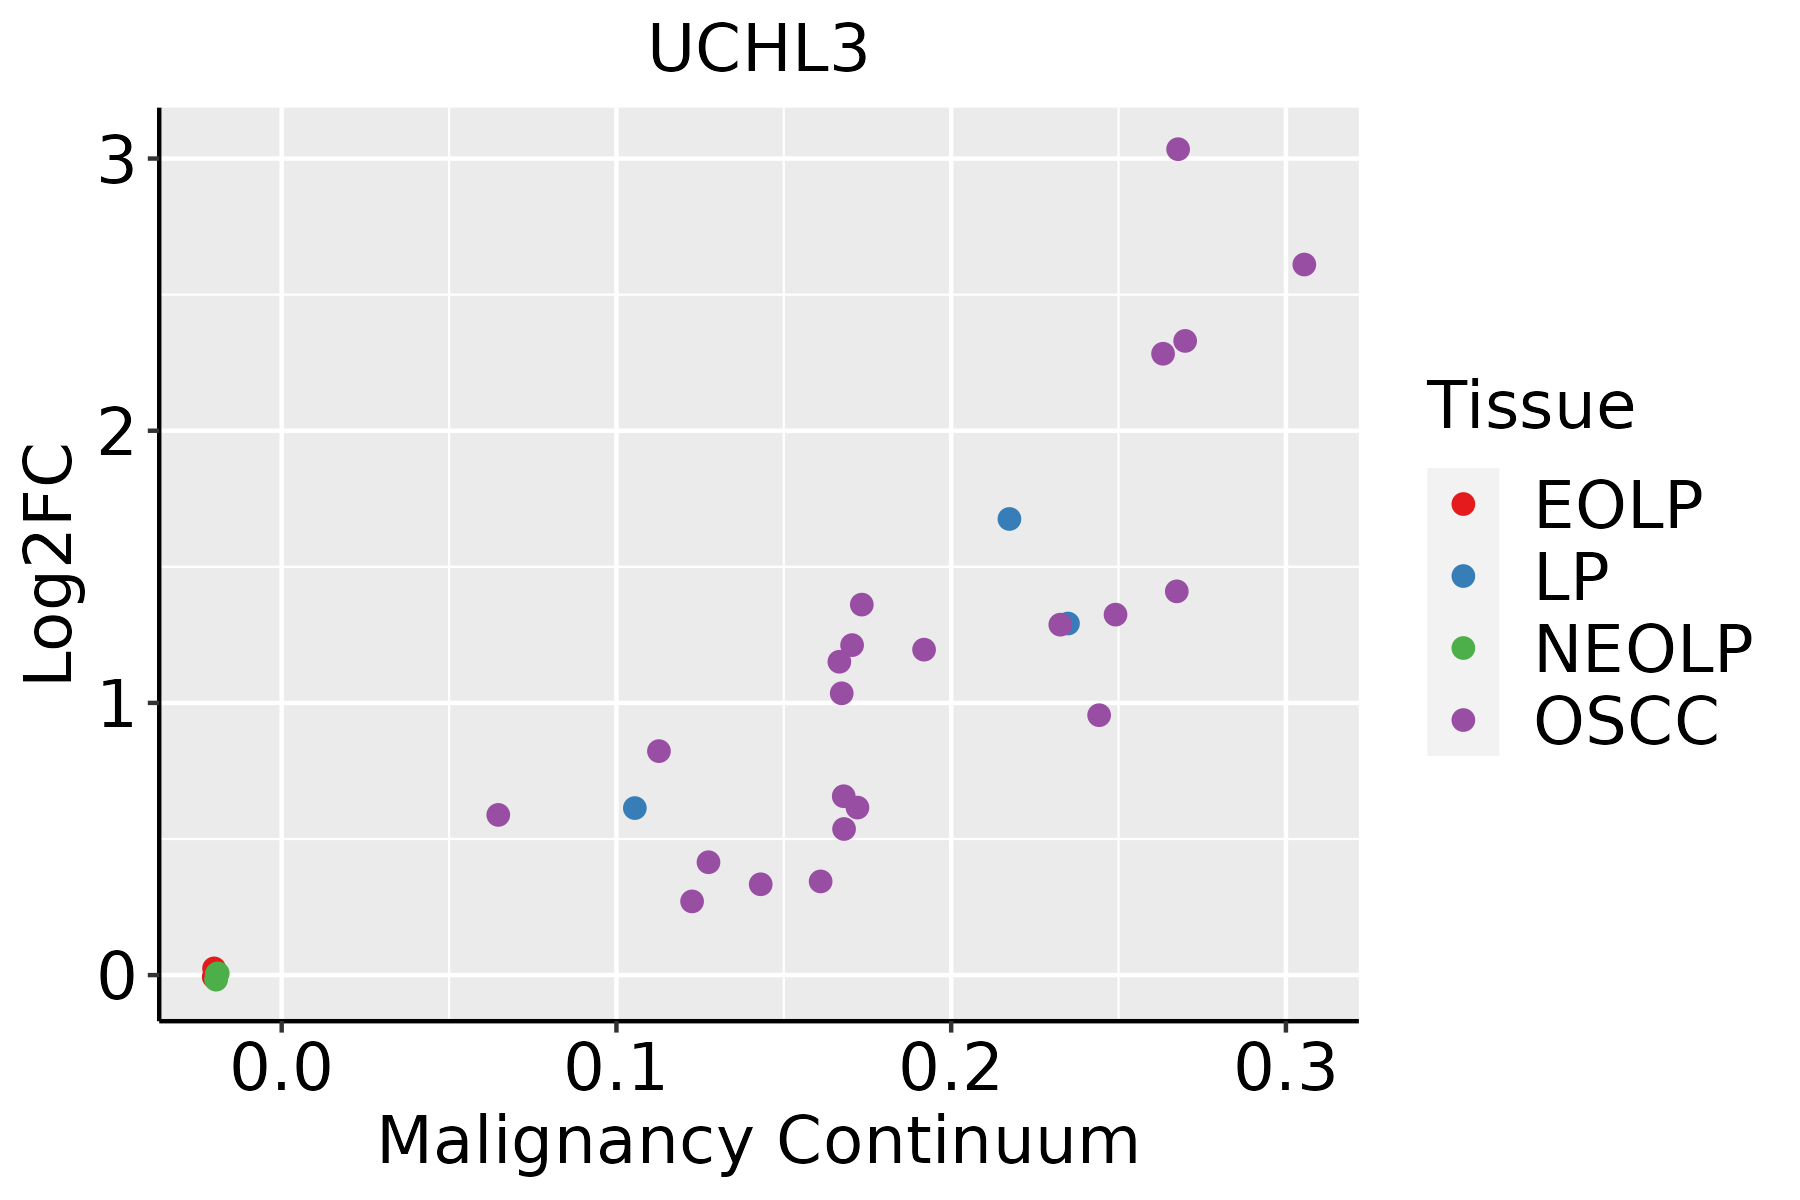 | EOLP: Erosive Oral lichen planus |
| LP: leukoplakia | ||
| NEOLP: Non-erosive oral lichen planus | ||
| OSCC: Oral squamous cell carcinoma | ||
| Prostate | 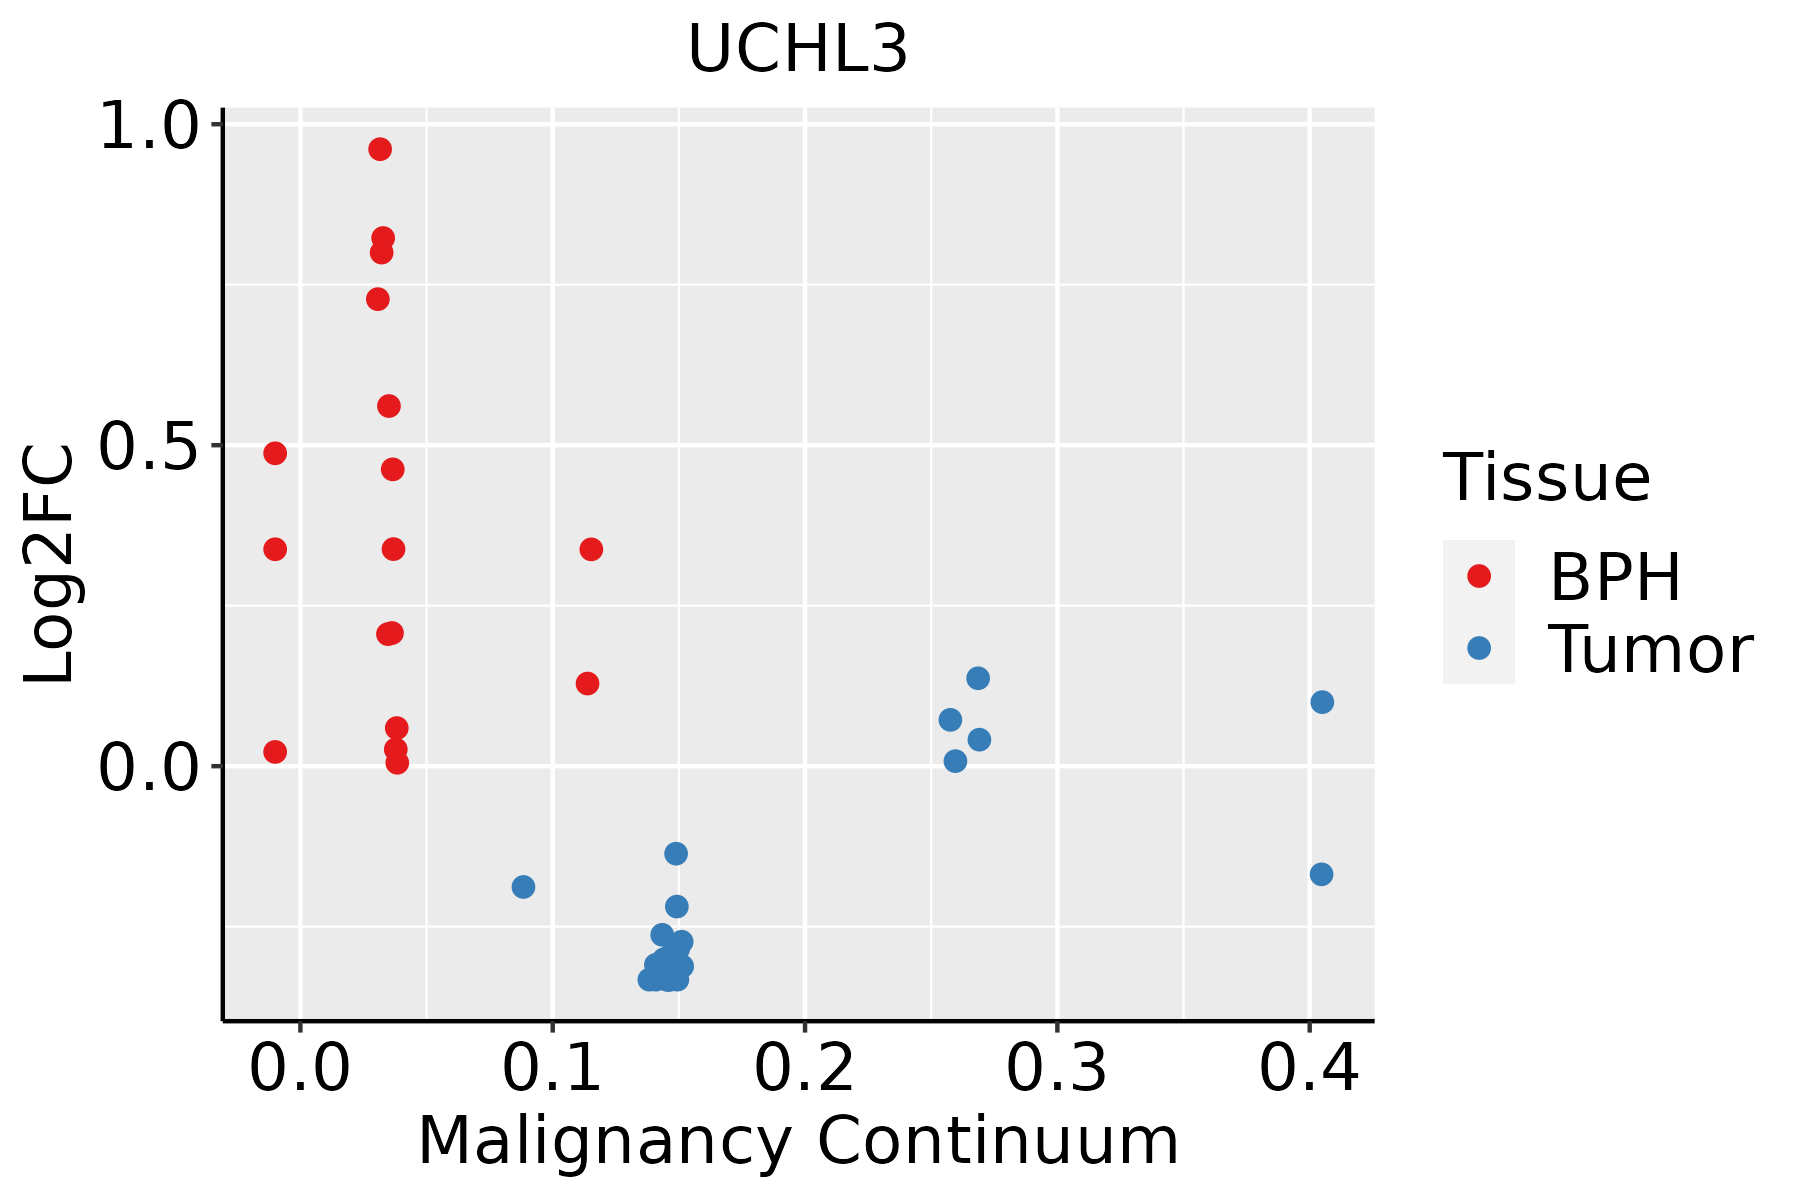 | BPH: Benign Prostatic Hyperplasia |
| Skin | 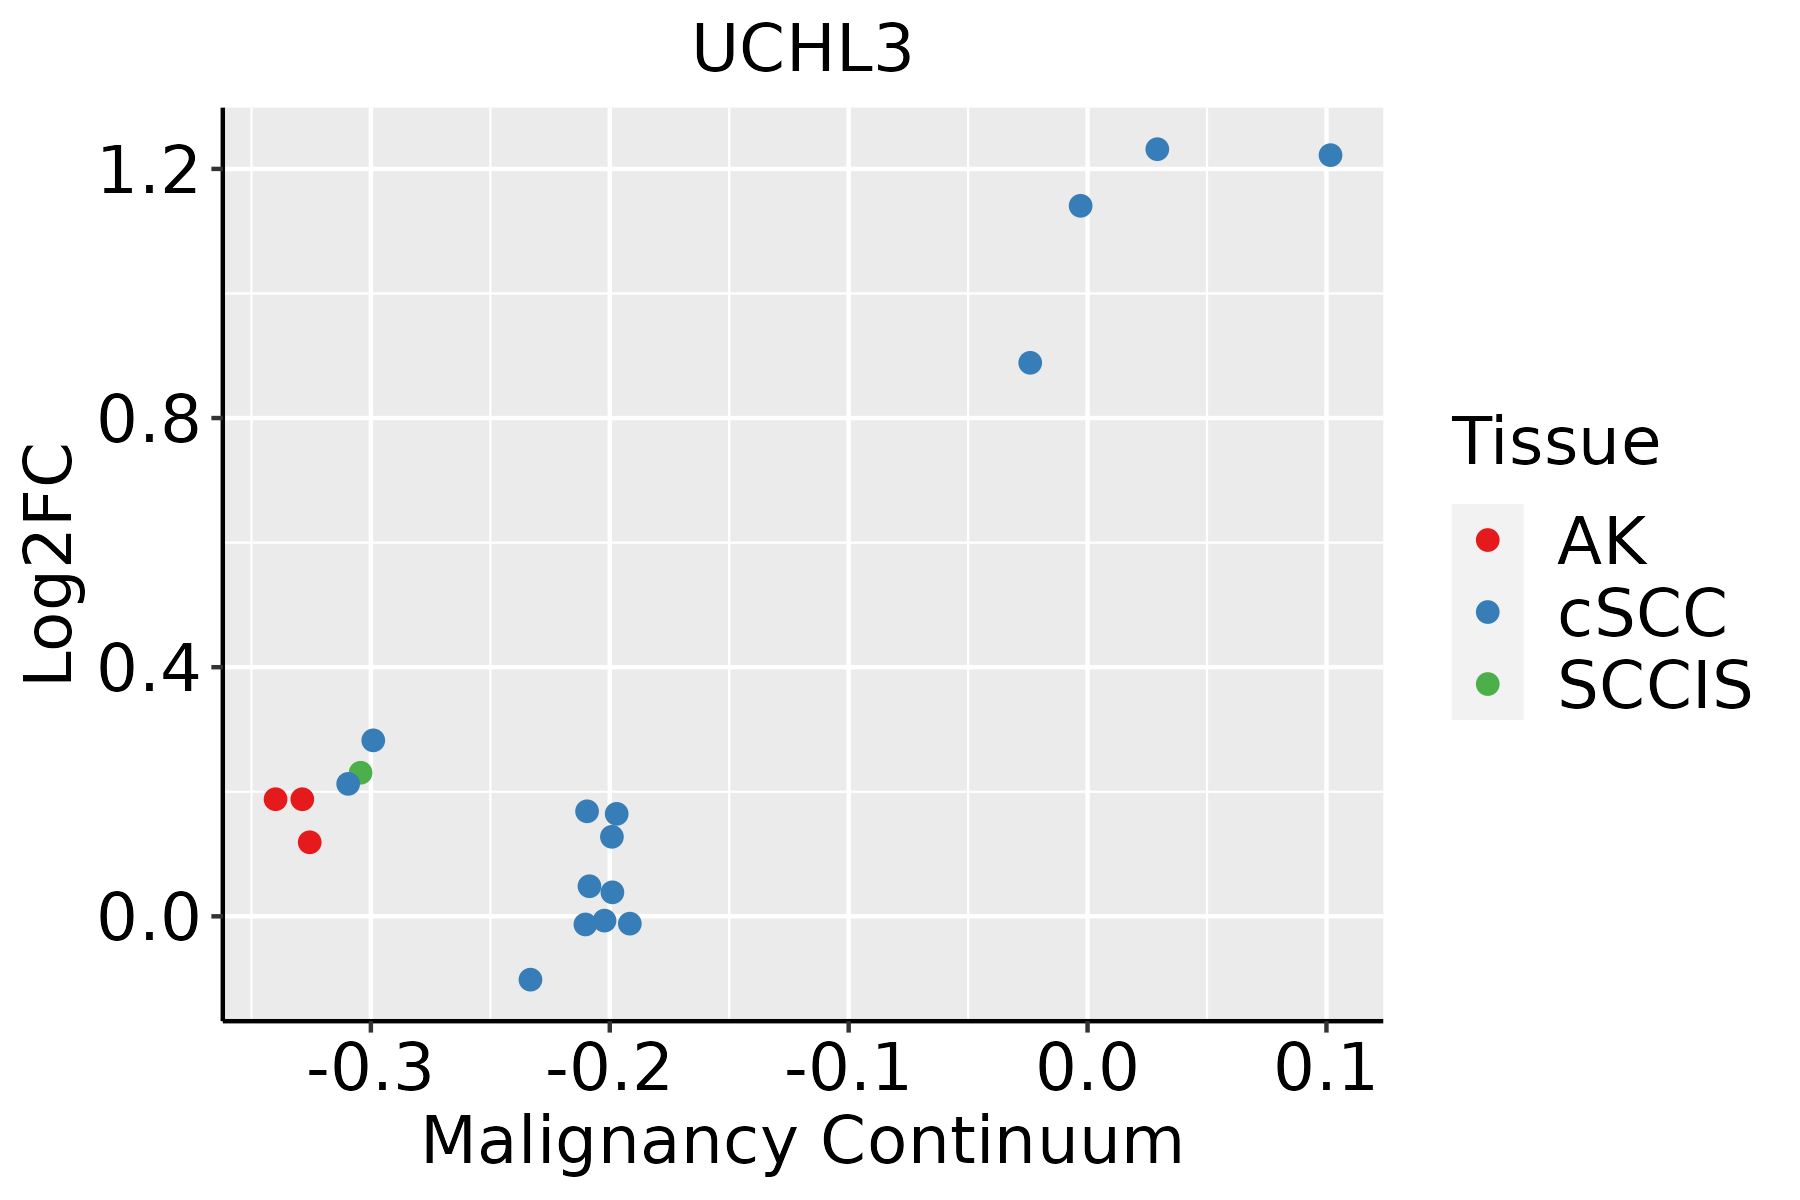 | AK: Actinic keratosis |
| cSCC: Cutaneous squamous cell carcinoma | ||
| SCCIS:squamous cell carcinoma in situ |
| ∗log2FC in expression of this searched gene in stem-like cells from each diseased tissue sample relative to stem-like cells in normal samples in each tissue plotted against the malignancy continuum. Samples are colored based on if they are from different disease stage. |
Top |
Malignant transformation related pathway analysis |
| Find out the enriched GO biological processes and KEGG pathways involved in transition from healthy to precancer to cancer |
| Tissue | Disease Stage | Enriched GO biological Processes |
| Colorectum | AD |  |
| Colorectum | SER |  |
| Colorectum | MSS |  |
| Colorectum | MSI-H |  |
| Colorectum | FAP |  |
| ∗Top 15 enriched GO BP terms are showed in the bar plot of each disease state in each tissue. Each row represents a significant GO biological process which is colored according to the -log10(p.adjust). |
| Page: 1 2 3 4 5 6 7 8 9 |
| GO ID | Tissue | Disease Stage | Description | Gene Ratio | Bg Ratio | pvalue | p.adjust | Count |
| GO:007064612 | Esophagus | ESCC | protein modification by small protein removal | 95/8552 | 157/18723 | 1.25e-04 | 8.56e-04 | 95 |
| GO:00165793 | Esophagus | ESCC | protein deubiquitination | 79/8552 | 139/18723 | 5.23e-03 | 1.97e-02 | 79 |
| GO:00706461 | Liver | HCC | protein modification by small protein removal | 91/7958 | 157/18723 | 6.50e-05 | 5.92e-04 | 91 |
| GO:00165791 | Liver | HCC | protein deubiquitination | 78/7958 | 139/18723 | 8.13e-04 | 4.87e-03 | 78 |
| GO:0043687 | Liver | HCC | post-translational protein modification | 24/7958 | 37/18723 | 5.03e-03 | 2.11e-02 | 24 |
| GO:00706462 | Oral cavity | OSCC | protein modification by small protein removal | 77/7305 | 157/18723 | 6.55e-03 | 2.43e-02 | 77 |
| GO:00706464 | Skin | cSCC | protein modification by small protein removal | 55/4864 | 157/18723 | 7.29e-03 | 3.46e-02 | 55 |
| Page: 1 |
| Pathway ID | Tissue | Disease Stage | Description | Gene Ratio | Bg Ratio | pvalue | p.adjust | qvalue | Count |
| Page: 1 |
Top |
Cell-cell communication analysis |
| Identification of potential cell-cell interactions between two cell types and their ligand-receptor pairs for different disease states |
| Ligand | Receptor | LRpair | Pathway | Tissue | Disease Stage |
| Page: 1 |
Top |
Single-cell gene regulatory network inference analysis |
| Find out the significant the regulons (TFs) and the target genes of each regulon across cell types for different disease states |
| TF | Cell Type | Tissue | Disease Stage | Target Gene | RSS | Regulon Activity |
| ∗The dot plots of a searched regulon are shown for all cell subpopulations in each disease state of each tissue based on the regulon specific score inferred using pySCENIC and by calculating the average expression. |
| Page: 1 |
Top |
Somatic mutation of malignant transformation related genes |
| Annotation of somatic variants for genes involved in malignant transformation |
| Hugo Symbol | Variant Class | Variant Classification | dbSNP RS | HGVSc | HGVSp | HGVSp Short | SWISSPROT | BIOTYPE | SIFT | PolyPhen | Tumor Sample Barcode | Tissue | Histology | Sex | Age | Stage | Therapy Types | Drugs | Outcome |
| UCHL3 | SNV | Missense_Mutation | c.361N>G | p.Lys121Glu | p.K121E | P15374 | protein_coding | tolerated(0.12) | benign(0.037) | TCGA-A8-A06R-01 | Breast | breast invasive carcinoma | Female | >=65 | I/II | Chemotherapy | 5-fluorouracil | CR | |
| UCHL3 | SNV | Missense_Mutation | novel | c.366C>A | p.Phe122Leu | p.F122L | P15374 | protein_coding | deleterious(0.03) | possibly_damaging(0.55) | TCGA-BH-A0B6-01 | Breast | breast invasive carcinoma | Female | <65 | I/II | Unknown | Unknown | SD |
| UCHL3 | SNV | Missense_Mutation | novel | c.474G>T | p.Glu158Asp | p.E158D | P15374 | protein_coding | tolerated(0.17) | benign(0.005) | TCGA-2W-A8YY-01 | Cervix | cervical & endocervical cancer | Female | <65 | I/II | Chemotherapy | cisplatin | CR |
| UCHL3 | SNV | Missense_Mutation | rs765533437 | c.646N>A | p.Asp216Asn | p.D216N | P15374 | protein_coding | deleterious(0) | possibly_damaging(0.605) | TCGA-AA-A00N-01 | Colorectum | colon adenocarcinoma | Male | >=65 | I/II | Unknown | Unknown | PD |
| UCHL3 | SNV | Missense_Mutation | novel | c.215N>C | p.Lys72Thr | p.K72T | P15374 | protein_coding | tolerated(0.05) | benign(0.089) | TCGA-CA-6717-01 | Colorectum | colon adenocarcinoma | Male | <65 | I/II | Chemotherapy | oxaliplatin | CR |
| UCHL3 | SNV | Missense_Mutation | novel | c.417G>T | p.Glu139Asp | p.E139D | P15374 | protein_coding | deleterious(0.01) | benign(0.364) | TCGA-AG-A002-01 | Colorectum | rectum adenocarcinoma | Male | <65 | I/II | Unknown | Unknown | SD |
| UCHL3 | SNV | Missense_Mutation | novel | c.514N>A | p.Ala172Thr | p.A172T | P15374 | protein_coding | tolerated(0.38) | possibly_damaging(0.657) | TCGA-A5-A0G1-01 | Endometrium | uterine corpus endometrioid carcinoma | Female | >=65 | I/II | Unknown | Unknown | SD |
| UCHL3 | SNV | Missense_Mutation | novel | c.42G>T | p.Glu14Asp | p.E14D | P15374 | protein_coding | tolerated(0.34) | benign(0.005) | TCGA-AP-A1E0-01 | Endometrium | uterine corpus endometrioid carcinoma | Female | <65 | III/IV | Chemotherapy | paclitaxel | SD |
| UCHL3 | SNV | Missense_Mutation | novel | c.482N>T | p.Ser161Ile | p.S161I | P15374 | protein_coding | deleterious(0.02) | benign(0.281) | TCGA-B5-A1MR-01 | Endometrium | uterine corpus endometrioid carcinoma | Female | >=65 | III/IV | Unknown | Unknown | SD |
| UCHL3 | SNV | Missense_Mutation | rs746951082 | c.94N>A | p.Val32Ile | p.V32I | P15374 | protein_coding | tolerated(0.08) | benign(0.081) | TCGA-EO-A22R-01 | Endometrium | uterine corpus endometrioid carcinoma | Female | <65 | I/II | Unknown | Unknown | SD |
| Page: 1 2 |
Top |
Related drugs of malignant transformation related genes |
| Identification of chemicals and drugs interact with genes involved in malignant transfromation |
| (DGIdb 4.0) |
| Entrez ID | Symbol | Category | Interaction Types | Drug Claim Name | Drug Name | PMIDs |
| 7347 | UCHL3 | PROTEASE, DRUGGABLE GENOME, ENZYME | inhibitor | 252166860 |
| Page: 1 |

Copyright 2023-Present -The University of Texas Health Science Center at Houston |