
|
|||||
|
 | |
| |
| |
| |
| |
| |
|
Gene: UCHL1 |
Gene summary for UCHL1 |
| Gene information | Species | Human | Gene symbol | UCHL1 | Gene ID | 7345 |
| Gene name | ubiquitin C-terminal hydrolase L1 | |
| Gene Alias | HEL-117 | |
| Cytomap | 4p13 | |
| Gene Type | protein-coding | GO ID | GO:0000165 | UniProtAcc | P09936 |
Top |
Malignant transformation analysis |
| Identification of the aberrant gene expression in precancerous and cancerous lesions by comparing the gene expression of stem-like cells in diseased tissues with normal stem cells |
| Entrez ID | Symbol | Replicates | Species | Organ | Tissue | Adj P-value | Log2FC | Malignancy |
| 7345 | UCHL1 | sample1 | Human | Cervix | CC | 5.15e-21 | 5.30e-01 | 0.0959 |
| 7345 | UCHL1 | T1 | Human | Cervix | CC | 5.31e-19 | 3.84e-01 | 0.0918 |
| 7345 | UCHL1 | LZE2T | Human | Esophagus | ESCC | 1.57e-11 | 1.86e+00 | 0.082 |
| 7345 | UCHL1 | LZE4T | Human | Esophagus | ESCC | 8.39e-40 | 1.68e+00 | 0.0811 |
| 7345 | UCHL1 | LZE7T | Human | Esophagus | ESCC | 4.18e-27 | 2.21e+00 | 0.0667 |
| 7345 | UCHL1 | LZE6T | Human | Esophagus | ESCC | 2.17e-12 | 2.06e+00 | 0.0845 |
| 7345 | UCHL1 | P2T-E | Human | Esophagus | ESCC | 1.30e-75 | 2.11e+00 | 0.1177 |
| 7345 | UCHL1 | P5T-E | Human | Esophagus | ESCC | 8.28e-08 | 2.84e-01 | 0.1327 |
| 7345 | UCHL1 | P10T-E | Human | Esophagus | ESCC | 5.18e-87 | 1.78e+00 | 0.116 |
| 7345 | UCHL1 | P11T-E | Human | Esophagus | ESCC | 3.72e-24 | 1.98e+00 | 0.1426 |
| 7345 | UCHL1 | P12T-E | Human | Esophagus | ESCC | 2.09e-64 | 1.93e+00 | 0.1122 |
| 7345 | UCHL1 | P15T-E | Human | Esophagus | ESCC | 1.68e-44 | 1.97e+00 | 0.1149 |
| 7345 | UCHL1 | P16T-E | Human | Esophagus | ESCC | 4.89e-19 | 6.74e-01 | 0.1153 |
| 7345 | UCHL1 | P19T-E | Human | Esophagus | ESCC | 1.78e-05 | 1.08e+00 | 0.1662 |
| 7345 | UCHL1 | P21T-E | Human | Esophagus | ESCC | 1.67e-76 | 2.86e+00 | 0.1617 |
| 7345 | UCHL1 | P22T-E | Human | Esophagus | ESCC | 1.53e-05 | 1.59e-01 | 0.1236 |
| 7345 | UCHL1 | P24T-E | Human | Esophagus | ESCC | 8.36e-11 | 5.43e-01 | 0.1287 |
| 7345 | UCHL1 | P26T-E | Human | Esophagus | ESCC | 5.87e-08 | 1.42e-01 | 0.1276 |
| 7345 | UCHL1 | P27T-E | Human | Esophagus | ESCC | 2.69e-46 | 1.50e+00 | 0.1055 |
| 7345 | UCHL1 | P28T-E | Human | Esophagus | ESCC | 3.17e-14 | 4.18e-01 | 0.1149 |
| Page: 1 2 3 4 |
| Tissue | Expression Dynamics | Abbreviation |
| Cervix | 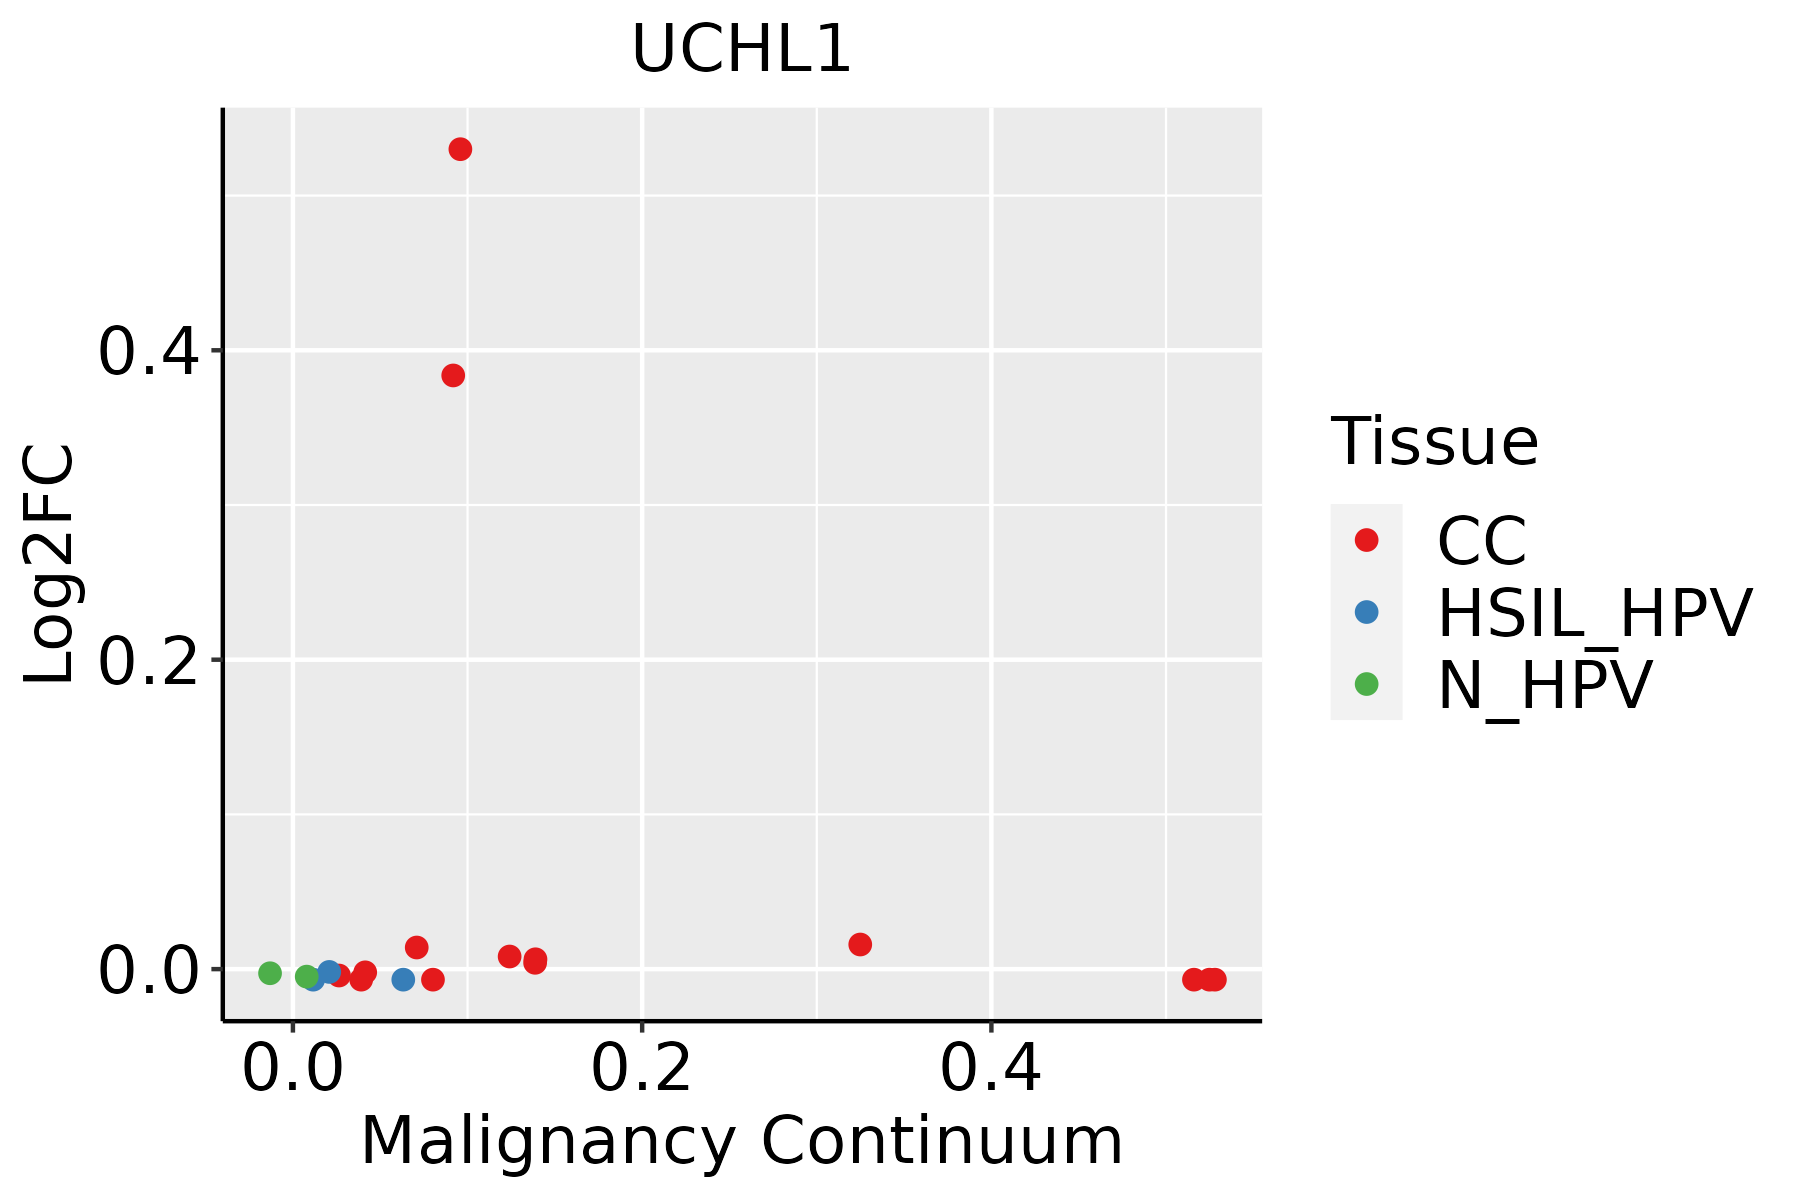 | CC: Cervix cancer |
| HSIL_HPV: HPV-infected high-grade squamous intraepithelial lesions | ||
| N_HPV: HPV-infected normal cervix | ||
| Esophagus | 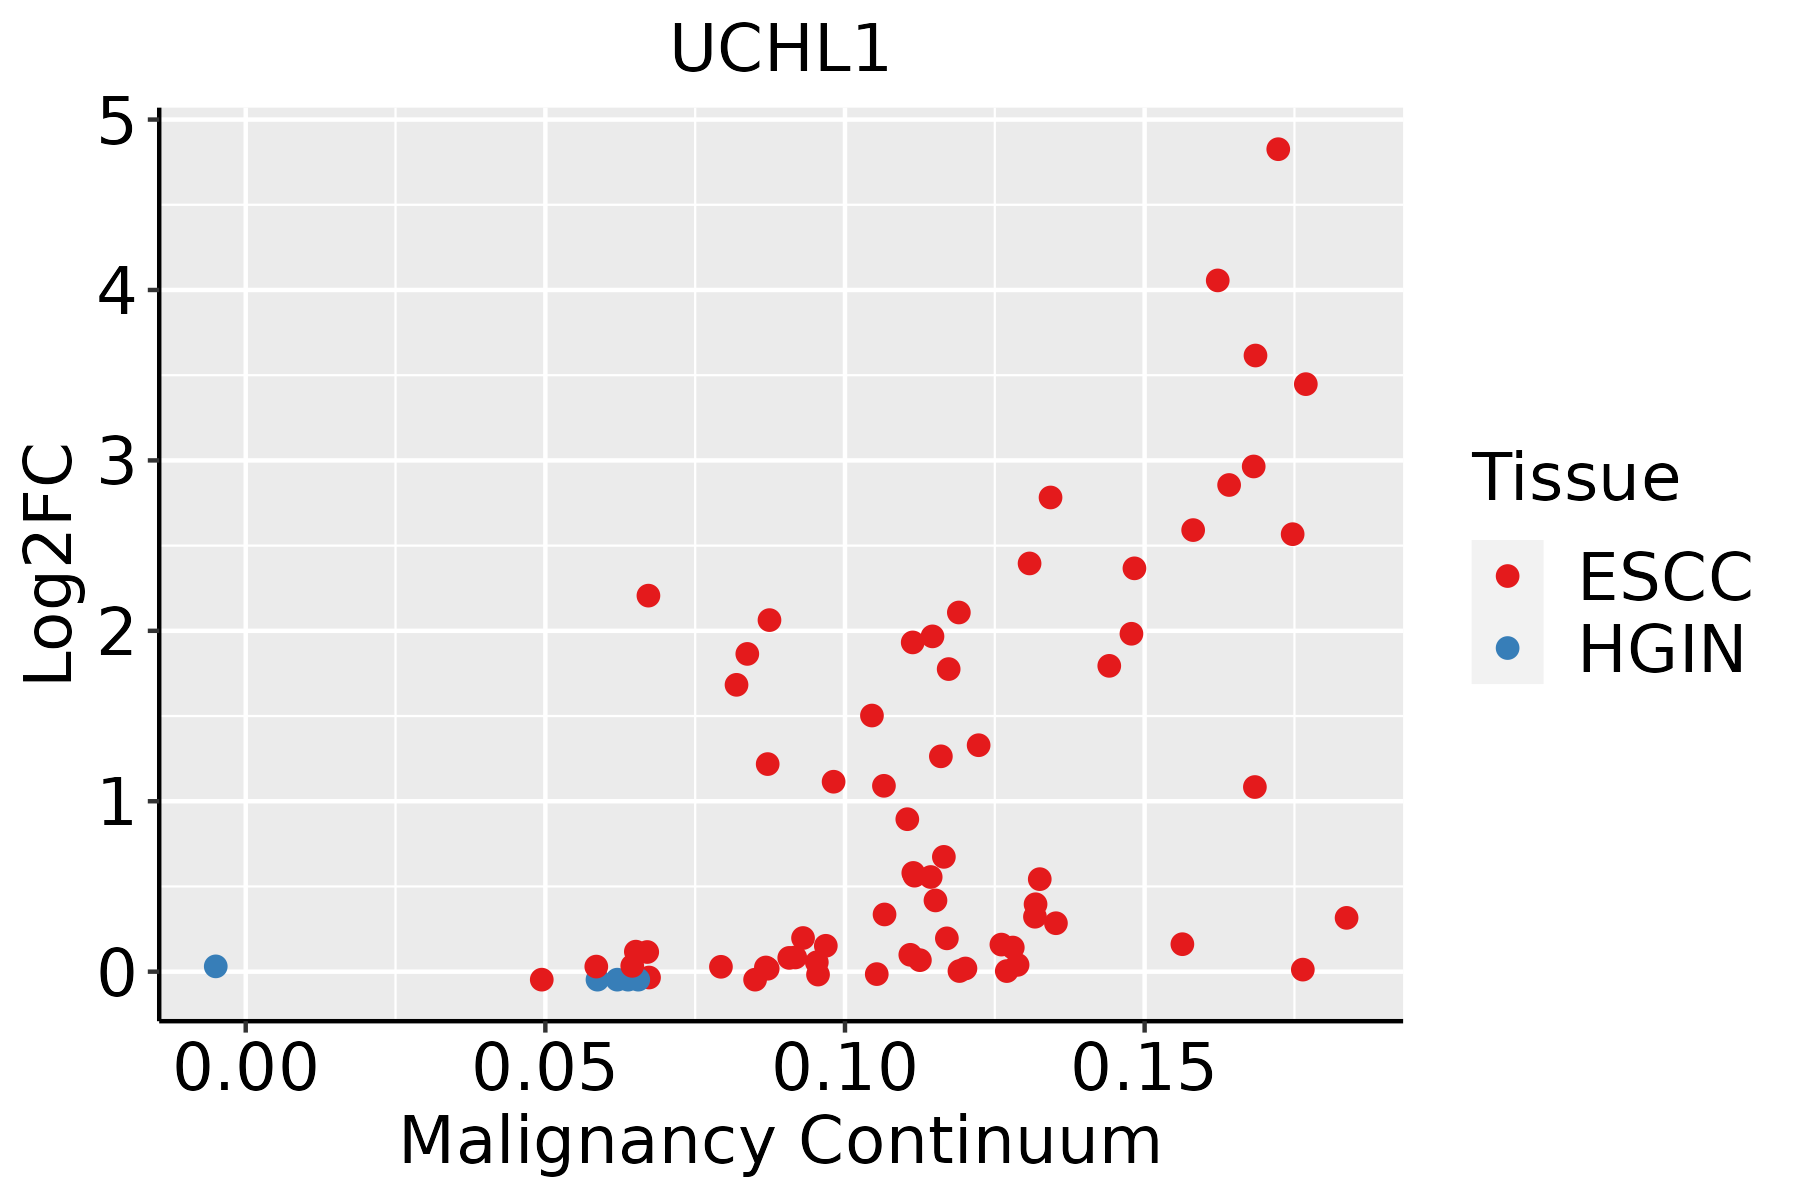 | ESCC: Esophageal squamous cell carcinoma |
| HGIN: High-grade intraepithelial neoplasias | ||
| LGIN: Low-grade intraepithelial neoplasias | ||
| Liver | 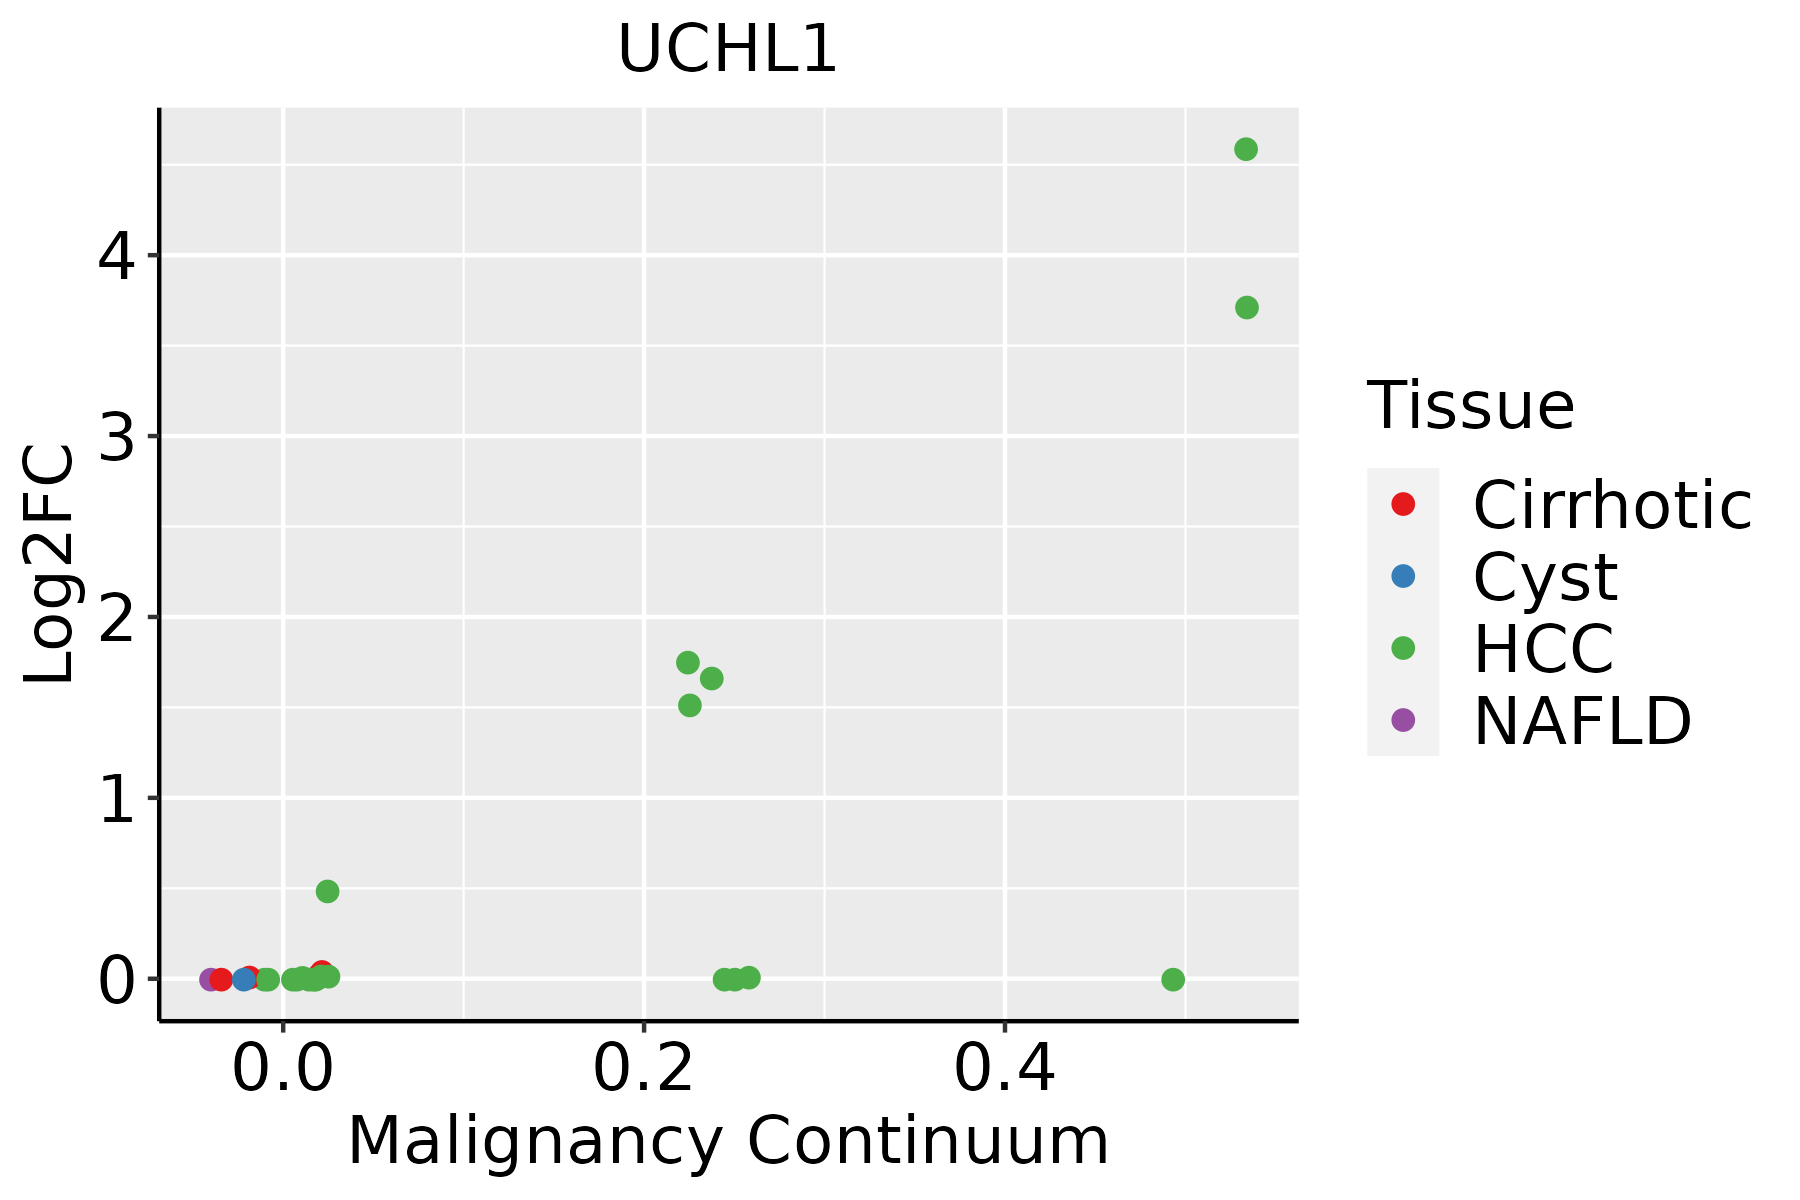 | HCC: Hepatocellular carcinoma |
| NAFLD: Non-alcoholic fatty liver disease | ||
| Oral Cavity | 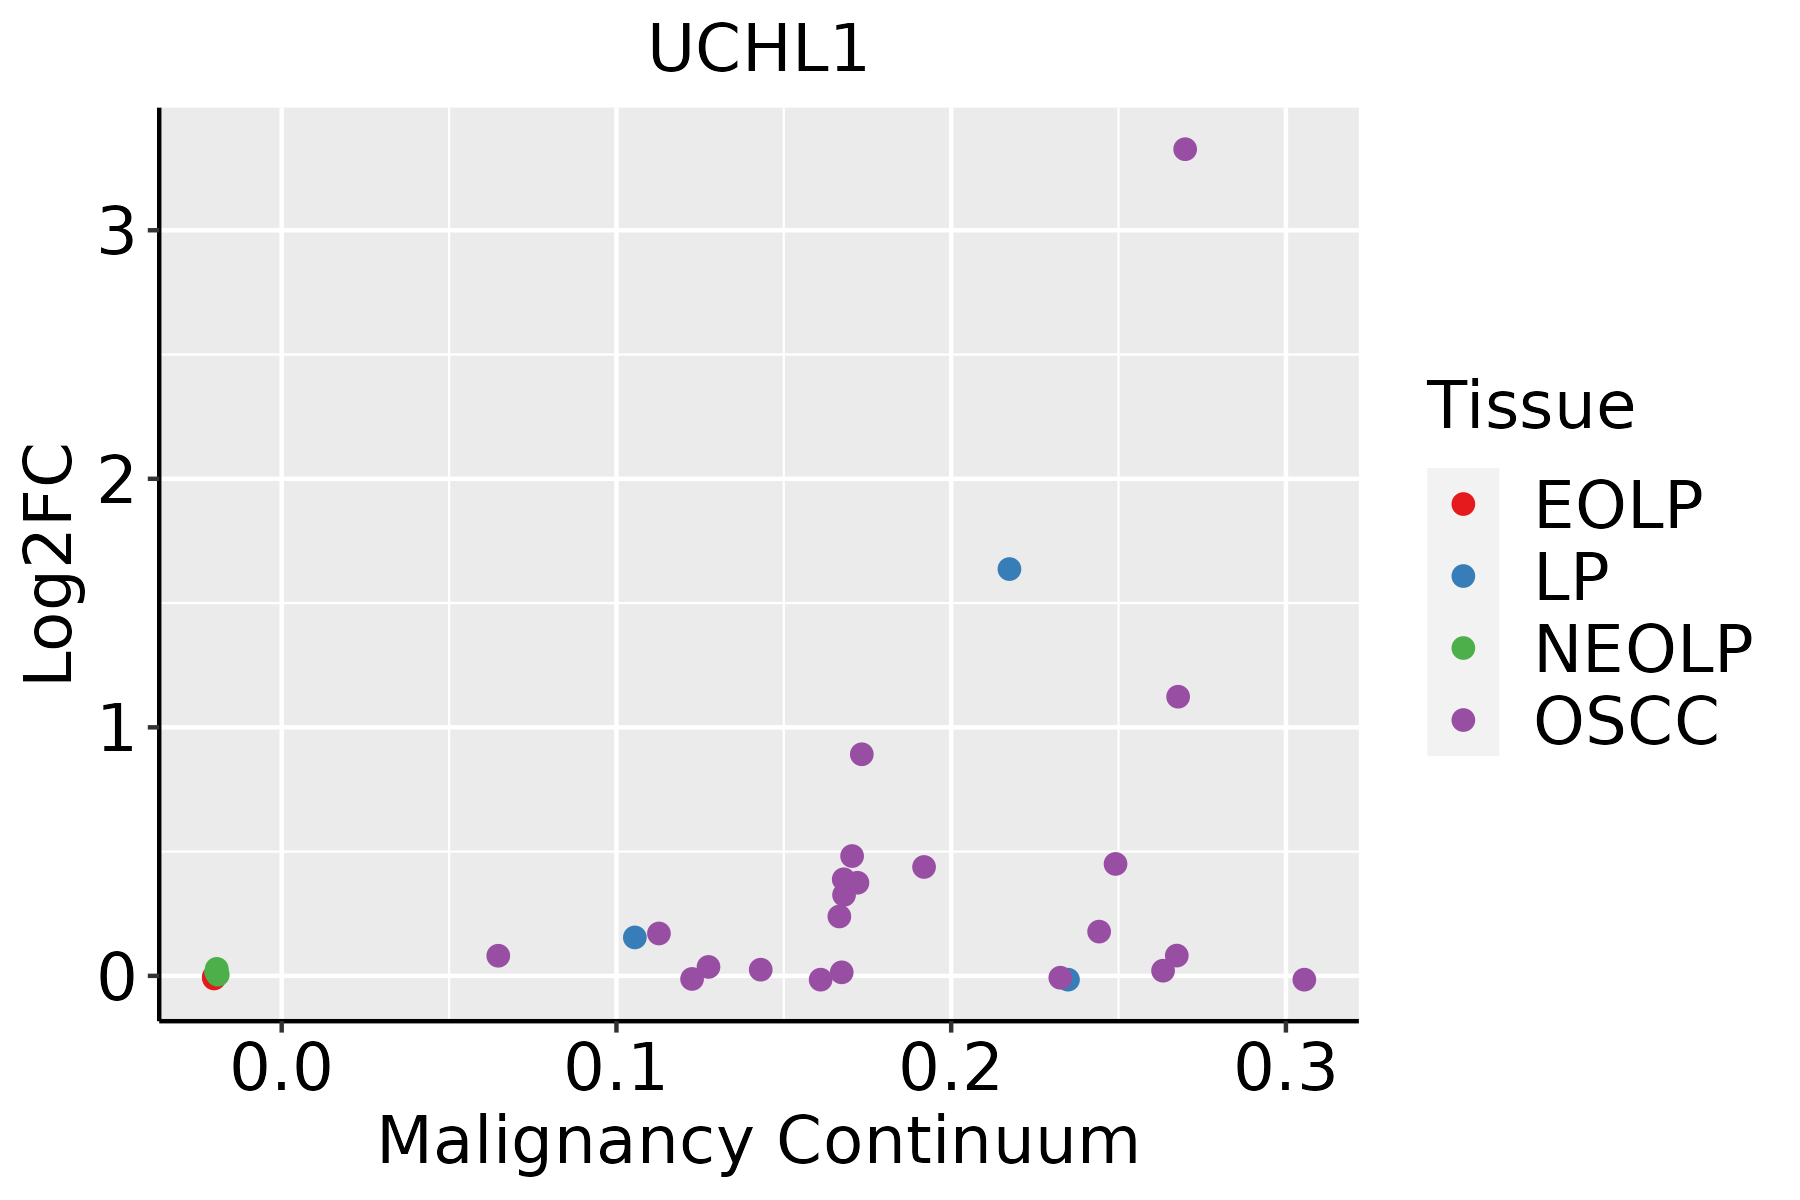 | EOLP: Erosive Oral lichen planus |
| LP: leukoplakia | ||
| NEOLP: Non-erosive oral lichen planus | ||
| OSCC: Oral squamous cell carcinoma | ||
| Thyroid | 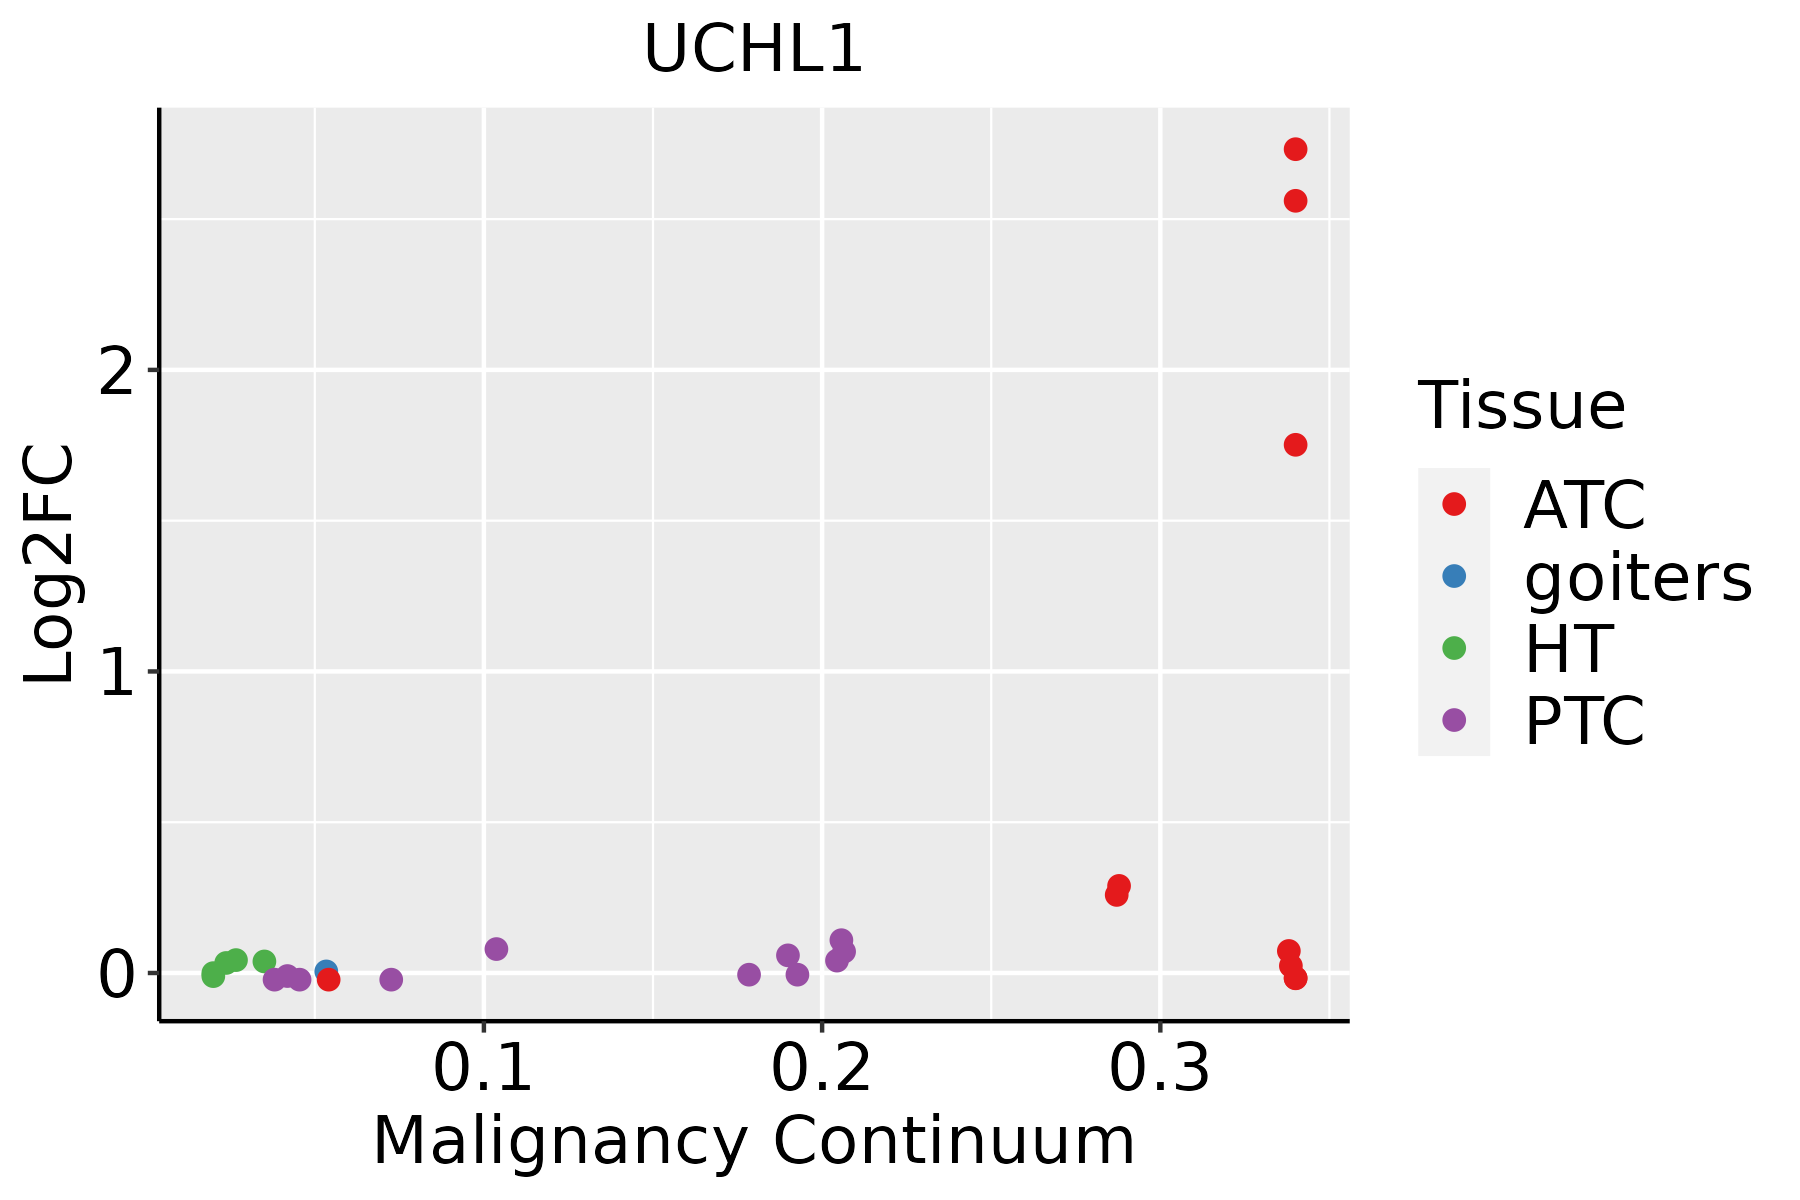 | ATC: Anaplastic thyroid cancer |
| HT: Hashimoto's thyroiditis | ||
| PTC: Papillary thyroid cancer |
| ∗log2FC in expression of this searched gene in stem-like cells from each diseased tissue sample relative to stem-like cells in normal samples in each tissue plotted against the malignancy continuum. Samples are colored based on if they are from different disease stage. |
Top |
Malignant transformation related pathway analysis |
| Find out the enriched GO biological processes and KEGG pathways involved in transition from healthy to precancer to cancer |
| Tissue | Disease Stage | Enriched GO biological Processes |
| Colorectum | AD |  |
| Colorectum | SER |  |
| Colorectum | MSS |  |
| Colorectum | MSI-H |  |
| Colorectum | FAP |  |
| ∗Top 15 enriched GO BP terms are showed in the bar plot of each disease state in each tissue. Each row represents a significant GO biological process which is colored according to the -log10(p.adjust). |
| Page: 1 2 3 4 5 6 7 8 9 |
| GO ID | Tissue | Disease Stage | Description | Gene Ratio | Bg Ratio | pvalue | p.adjust | Count |
| GO:001049810 | Cervix | CC | proteasomal protein catabolic process | 111/2311 | 490/18723 | 8.98e-11 | 1.58e-08 | 111 |
| GO:004316110 | Cervix | CC | proteasome-mediated ubiquitin-dependent protein catabolic process | 91/2311 | 412/18723 | 1.65e-08 | 1.25e-06 | 91 |
| GO:00719007 | Cervix | CC | regulation of protein serine/threonine kinase activity | 75/2311 | 359/18723 | 2.76e-06 | 8.02e-05 | 75 |
| GO:005134810 | Cervix | CC | negative regulation of transferase activity | 60/2311 | 268/18723 | 2.77e-06 | 8.02e-05 | 60 |
| GO:004593610 | Cervix | CC | negative regulation of phosphate metabolic process | 88/2311 | 441/18723 | 2.92e-06 | 8.27e-05 | 88 |
| GO:001056310 | Cervix | CC | negative regulation of phosphorus metabolic process | 88/2311 | 442/18723 | 3.21e-06 | 8.77e-05 | 88 |
| GO:004232610 | Cervix | CC | negative regulation of phosphorylation | 77/2311 | 385/18723 | 1.09e-05 | 2.38e-04 | 77 |
| GO:00615647 | Cervix | CC | axon development | 89/2311 | 467/18723 | 1.71e-05 | 3.27e-04 | 89 |
| GO:000193310 | Cervix | CC | negative regulation of protein phosphorylation | 69/2311 | 342/18723 | 2.29e-05 | 4.01e-04 | 69 |
| GO:00516567 | Cervix | CC | establishment of organelle localization | 76/2311 | 390/18723 | 3.17e-05 | 5.21e-04 | 76 |
| GO:000646910 | Cervix | CC | negative regulation of protein kinase activity | 47/2311 | 212/18723 | 4.13e-05 | 6.36e-04 | 47 |
| GO:00336739 | Cervix | CC | negative regulation of kinase activity | 50/2311 | 237/18723 | 9.22e-05 | 1.21e-03 | 50 |
| GO:00074097 | Cervix | CC | axonogenesis | 78/2311 | 418/18723 | 1.14e-04 | 1.43e-03 | 78 |
| GO:00162367 | Cervix | CC | macroautophagy | 58/2311 | 291/18723 | 1.40e-04 | 1.70e-03 | 58 |
| GO:00105067 | Cervix | CC | regulation of autophagy | 61/2311 | 317/18723 | 2.61e-04 | 2.87e-03 | 61 |
| GO:00307057 | Cervix | CC | cytoskeleton-dependent intracellular transport | 40/2311 | 195/18723 | 7.92e-04 | 6.99e-03 | 40 |
| GO:00426924 | Cervix | CC | muscle cell differentiation | 69/2311 | 384/18723 | 8.12e-04 | 7.09e-03 | 69 |
| GO:00434099 | Cervix | CC | negative regulation of MAPK cascade | 37/2311 | 180/18723 | 1.17e-03 | 9.50e-03 | 37 |
| GO:00516541 | Cervix | CC | establishment of mitochondrion localization | 10/2311 | 29/18723 | 1.74e-03 | 1.31e-02 | 10 |
| GO:00094109 | Cervix | CC | response to xenobiotic stimulus | 78/2311 | 462/18723 | 2.39e-03 | 1.70e-02 | 78 |
| Page: 1 2 3 4 5 6 7 8 9 10 11 |
| Pathway ID | Tissue | Disease Stage | Description | Gene Ratio | Bg Ratio | pvalue | p.adjust | qvalue | Count |
| hsa0502218 | Cervix | CC | Pathways of neurodegeneration - multiple diseases | 128/1267 | 476/8465 | 2.87e-12 | 9.29e-11 | 5.50e-11 | 128 |
| hsa0502219 | Cervix | CC | Pathways of neurodegeneration - multiple diseases | 128/1267 | 476/8465 | 2.87e-12 | 9.29e-11 | 5.50e-11 | 128 |
| hsa05012211 | Esophagus | ESCC | Parkinson disease | 201/4205 | 266/8465 | 1.56e-18 | 8.72e-17 | 4.46e-17 | 201 |
| hsa05022210 | Esophagus | ESCC | Pathways of neurodegeneration - multiple diseases | 318/4205 | 476/8465 | 6.10e-15 | 2.04e-13 | 1.05e-13 | 318 |
| hsa05012310 | Esophagus | ESCC | Parkinson disease | 201/4205 | 266/8465 | 1.56e-18 | 8.72e-17 | 4.46e-17 | 201 |
| hsa0502238 | Esophagus | ESCC | Pathways of neurodegeneration - multiple diseases | 318/4205 | 476/8465 | 6.10e-15 | 2.04e-13 | 1.05e-13 | 318 |
| hsa0501222 | Liver | HCC | Parkinson disease | 198/4020 | 266/8465 | 9.40e-20 | 1.58e-17 | 8.76e-18 | 198 |
| hsa0502222 | Liver | HCC | Pathways of neurodegeneration - multiple diseases | 298/4020 | 476/8465 | 6.59e-12 | 1.30e-10 | 7.22e-11 | 298 |
| hsa0501232 | Liver | HCC | Parkinson disease | 198/4020 | 266/8465 | 9.40e-20 | 1.58e-17 | 8.76e-18 | 198 |
| hsa0502232 | Liver | HCC | Pathways of neurodegeneration - multiple diseases | 298/4020 | 476/8465 | 6.59e-12 | 1.30e-10 | 7.22e-11 | 298 |
| hsa0501230 | Oral cavity | OSCC | Parkinson disease | 188/3704 | 266/8465 | 1.82e-19 | 1.52e-17 | 7.75e-18 | 188 |
| hsa0502228 | Oral cavity | OSCC | Pathways of neurodegeneration - multiple diseases | 292/3704 | 476/8465 | 1.60e-15 | 4.47e-14 | 2.28e-14 | 292 |
| hsa05012113 | Oral cavity | OSCC | Parkinson disease | 188/3704 | 266/8465 | 1.82e-19 | 1.52e-17 | 7.75e-18 | 188 |
| hsa05022112 | Oral cavity | OSCC | Pathways of neurodegeneration - multiple diseases | 292/3704 | 476/8465 | 1.60e-15 | 4.47e-14 | 2.28e-14 | 292 |
| hsa05012210 | Oral cavity | LP | Parkinson disease | 166/2418 | 266/8465 | 2.02e-31 | 3.36e-29 | 2.17e-29 | 166 |
| hsa0502229 | Oral cavity | LP | Pathways of neurodegeneration - multiple diseases | 232/2418 | 476/8465 | 7.77e-22 | 3.69e-20 | 2.38e-20 | 232 |
| hsa0501238 | Oral cavity | LP | Parkinson disease | 166/2418 | 266/8465 | 2.02e-31 | 3.36e-29 | 2.17e-29 | 166 |
| hsa0502237 | Oral cavity | LP | Pathways of neurodegeneration - multiple diseases | 232/2418 | 476/8465 | 7.77e-22 | 3.69e-20 | 2.38e-20 | 232 |
| Page: 1 |
Top |
Cell-cell communication analysis |
| Identification of potential cell-cell interactions between two cell types and their ligand-receptor pairs for different disease states |
| Ligand | Receptor | LRpair | Pathway | Tissue | Disease Stage |
| Page: 1 |
Top |
Single-cell gene regulatory network inference analysis |
| Find out the significant the regulons (TFs) and the target genes of each regulon across cell types for different disease states |
| TF | Cell Type | Tissue | Disease Stage | Target Gene | RSS | Regulon Activity |
| ∗The dot plots of a searched regulon are shown for all cell subpopulations in each disease state of each tissue based on the regulon specific score inferred using pySCENIC and by calculating the average expression. |
| Page: 1 |
Top |
Somatic mutation of malignant transformation related genes |
| Annotation of somatic variants for genes involved in malignant transformation |
| Hugo Symbol | Variant Class | Variant Classification | dbSNP RS | HGVSc | HGVSp | HGVSp Short | SWISSPROT | BIOTYPE | SIFT | PolyPhen | Tumor Sample Barcode | Tissue | Histology | Sex | Age | Stage | Therapy Types | Drugs | Outcome |
| UCHL1 | SNV | Missense_Mutation | novel | c.31G>C | p.Glu11Gln | p.E11Q | P09936 | protein_coding | tolerated(0.07) | benign(0.037) | TCGA-Q1-A73R-01 | Cervix | cervical & endocervical cancer | Female | <65 | I/II | Unknown | Unknown | SD |
| UCHL1 | SNV | Missense_Mutation | rs139583787 | c.457C>T | p.Arg153Trp | p.R153W | P09936 | protein_coding | deleterious(0) | probably_damaging(0.999) | TCGA-CA-6718-01 | Colorectum | colon adenocarcinoma | Male | <65 | I/II | Unknown | Unknown | PD |
| UCHL1 | SNV | Missense_Mutation | rs770039881 | c.649N>A | p.Val217Met | p.V217M | P09936 | protein_coding | tolerated(0.13) | possibly_damaging(0.696) | TCGA-AG-A002-01 | Colorectum | rectum adenocarcinoma | Male | <65 | I/II | Unknown | Unknown | SD |
| UCHL1 | SNV | Missense_Mutation | novel | c.466G>T | p.Asp156Tyr | p.D156Y | P09936 | protein_coding | deleterious(0) | probably_damaging(0.964) | TCGA-EI-6917-01 | Colorectum | rectum adenocarcinoma | Male | <65 | III/IV | Chemotherapy | 5fluorouracil+oxaciplatina+l-folinian | SD |
| UCHL1 | SNV | Missense_Mutation | novel | c.420G>T | p.Gln140His | p.Q140H | P09936 | protein_coding | tolerated(0.54) | possibly_damaging(0.745) | TCGA-A5-A0G1-01 | Endometrium | uterine corpus endometrioid carcinoma | Female | >=65 | I/II | Unknown | Unknown | SD |
| UCHL1 | SNV | Missense_Mutation | c.458G>A | p.Arg153Gln | p.R153Q | P09936 | protein_coding | tolerated(0.16) | possibly_damaging(0.753) | TCGA-A5-A0VP-01 | Endometrium | uterine corpus endometrioid carcinoma | Female | >=65 | I/II | Unknown | Unknown | SD | |
| UCHL1 | SNV | Missense_Mutation | rs139583787 | c.457N>T | p.Arg153Trp | p.R153W | P09936 | protein_coding | deleterious(0) | probably_damaging(0.999) | TCGA-A5-A2K5-01 | Endometrium | uterine corpus endometrioid carcinoma | Female | >=65 | I/II | Unknown | Unknown | SD |
| UCHL1 | SNV | Missense_Mutation | rs139583787 | c.457N>T | p.Arg153Trp | p.R153W | P09936 | protein_coding | deleterious(0) | probably_damaging(0.999) | TCGA-AJ-A3EL-01 | Endometrium | uterine corpus endometrioid carcinoma | Female | <65 | I/II | Unknown | Unknown | SD |
| UCHL1 | SNV | Missense_Mutation | novel | c.522N>C | p.Glu174Asp | p.E174D | P09936 | protein_coding | deleterious(0) | probably_damaging(0.996) | TCGA-AP-A059-01 | Endometrium | uterine corpus endometrioid carcinoma | Female | >=65 | I/II | Unknown | Unknown | SD |
| UCHL1 | SNV | Missense_Mutation | novel | c.23T>C | p.Ile8Thr | p.I8T | P09936 | protein_coding | tolerated(0.28) | probably_damaging(0.992) | TCGA-B5-A3FC-01 | Endometrium | uterine corpus endometrioid carcinoma | Female | <65 | I/II | Unknown | Unknown | SD |
| Page: 1 2 3 |
Top |
Related drugs of malignant transformation related genes |
| Identification of chemicals and drugs interact with genes involved in malignant transfromation |
| (DGIdb 4.0) |
| Entrez ID | Symbol | Category | Interaction Types | Drug Claim Name | Drug Name | PMIDs |
| 7345 | UCHL1 | DRUGGABLE GENOME, ENZYME, PROTEASE | inhibitor | 252166861 |
| Page: 1 |

Copyright 2023-Present -The University of Texas Health Science Center at Houston |