
|
|||||
|
 | |
| |
| |
| |
| |
| |
|
Gene: UCA1 |
Gene summary for UCA1 |
| Gene information | Species | Human | Gene symbol | UCA1 | Gene ID | 652995 |
| Gene name | urothelial cancer associated 1 | |
| Gene Alias | CUDR | |
| Cytomap | 19p13.12 | |
| Gene Type | ncRNA | GO ID | GO:0008150 | UniProtAcc | NA |
Top |
Malignant transformation analysis |
| Identification of the aberrant gene expression in precancerous and cancerous lesions by comparing the gene expression of stem-like cells in diseased tissues with normal stem cells |
| Entrez ID | Symbol | Replicates | Species | Organ | Tissue | Adj P-value | Log2FC | Malignancy |
| 652995 | UCA1 | AEH-subject1 | Human | Endometrium | AEH | 8.49e-10 | 3.08e-01 | -0.3059 |
| 652995 | UCA1 | AEH-subject2 | Human | Endometrium | AEH | 3.66e-09 | 2.50e-01 | -0.2525 |
| 652995 | UCA1 | AEH-subject5 | Human | Endometrium | AEH | 5.79e-15 | 2.64e-01 | -0.2953 |
| 652995 | UCA1 | EEC-subject5 | Human | Endometrium | EEC | 1.44e-13 | 4.09e-01 | -0.249 |
| 652995 | UCA1 | GSM5276934 | Human | Endometrium | EEC | 3.89e-10 | 2.47e-01 | -0.0913 |
| 652995 | UCA1 | GSM6177623_NYU_UCEC3_Vis | Human | Endometrium | EEC | 4.51e-35 | 6.92e-01 | -0.1269 |
| 652995 | UCA1 | S027 | Human | Liver | HCC | 1.54e-09 | 1.02e+00 | 0.2446 |
| 652995 | UCA1 | S028 | Human | Liver | HCC | 3.56e-16 | 9.38e-01 | 0.2503 |
| 652995 | UCA1 | S029 | Human | Liver | HCC | 3.29e-10 | 5.53e-01 | 0.2581 |
| Page: 1 |
| Tissue | Expression Dynamics | Abbreviation |
| Endometrium | 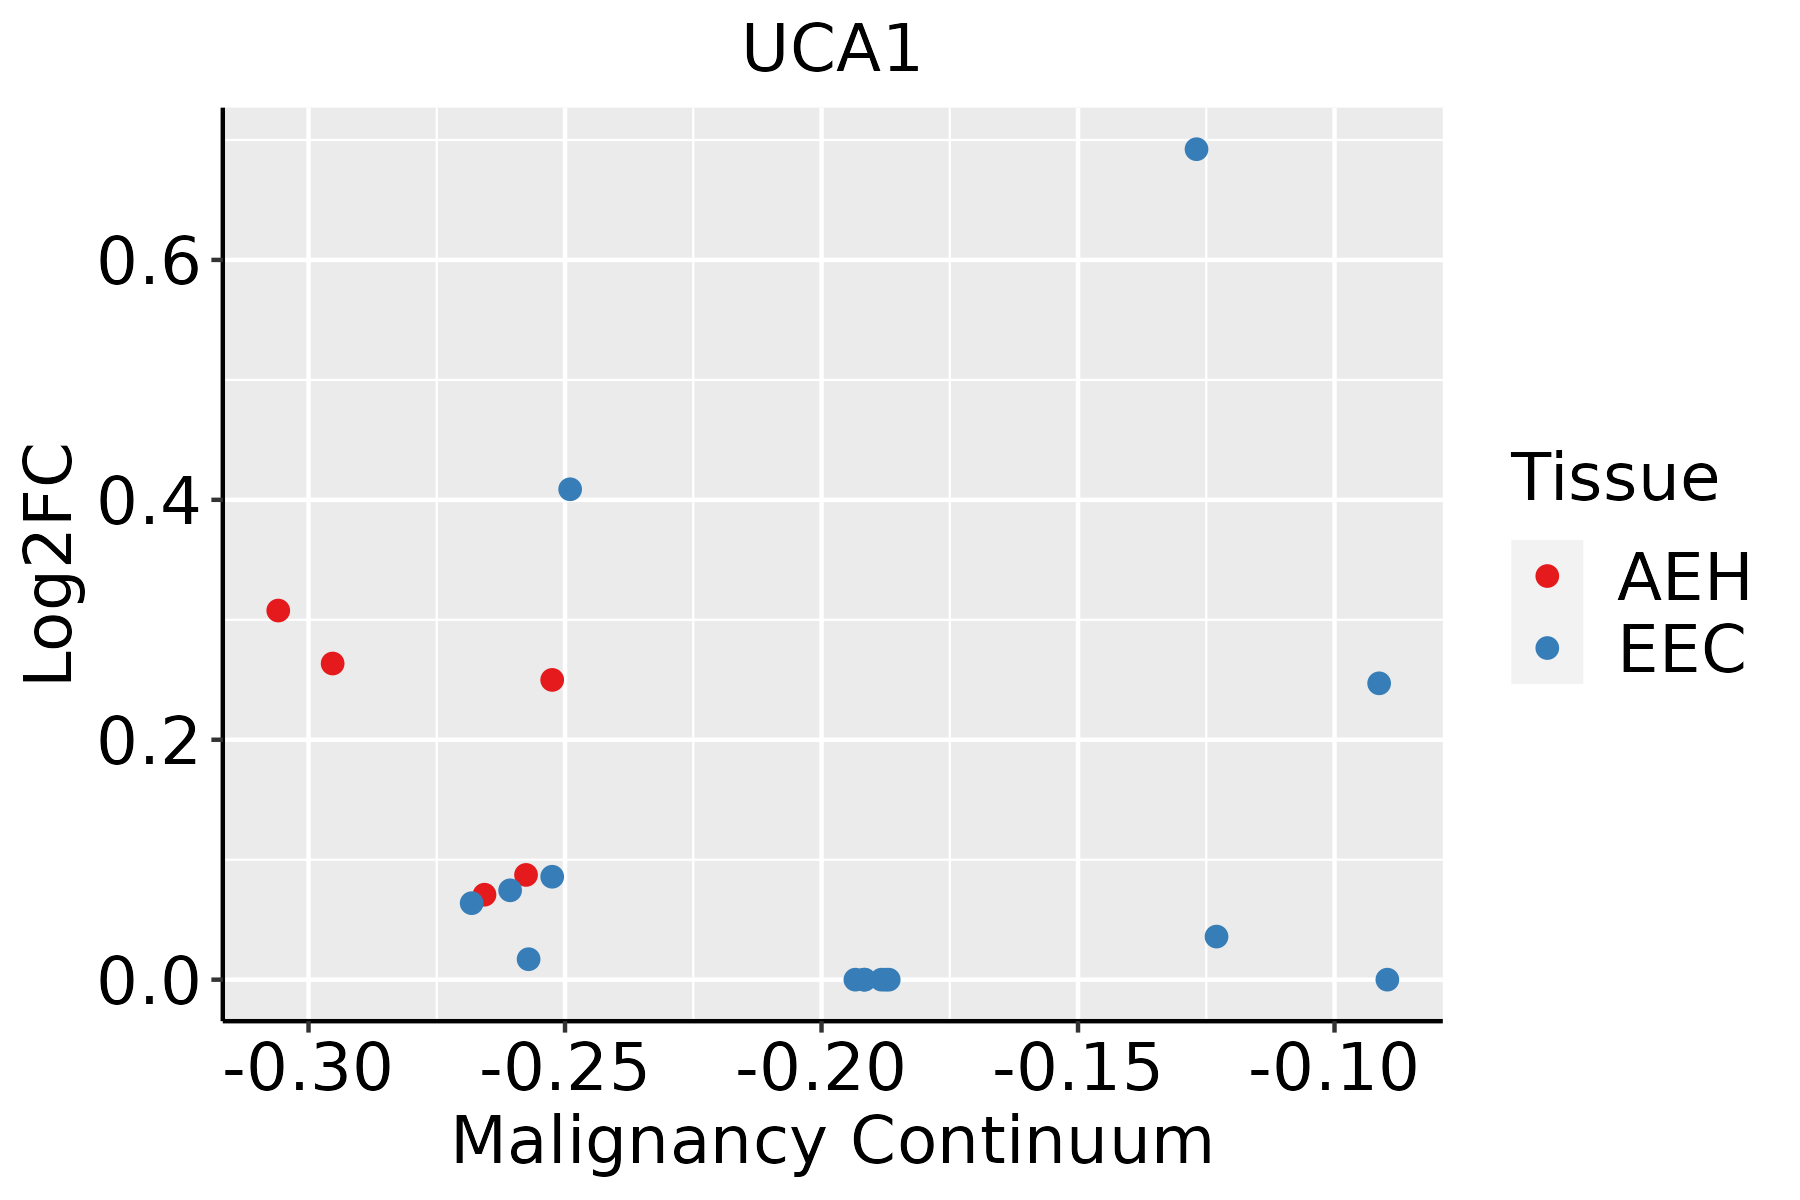 | AEH: Atypical endometrial hyperplasia |
| EEC: Endometrioid Cancer | ||
| Liver |  | HCC: Hepatocellular carcinoma |
| NAFLD: Non-alcoholic fatty liver disease |
| ∗log2FC in expression of this searched gene in stem-like cells from each diseased tissue sample relative to stem-like cells in normal samples in each tissue plotted against the malignancy continuum. Samples are colored based on if they are from different disease stage. |
Top |
Malignant transformation related pathway analysis |
| Find out the enriched GO biological processes and KEGG pathways involved in transition from healthy to precancer to cancer |
| Tissue | Disease Stage | Enriched GO biological Processes |
| Colorectum | AD |  |
| Colorectum | SER |  |
| Colorectum | MSS |  |
| Colorectum | MSI-H |  |
| Colorectum | FAP |  |
| ∗Top 15 enriched GO BP terms are showed in the bar plot of each disease state in each tissue. Each row represents a significant GO biological process which is colored according to the -log10(p.adjust). |
| Page: 1 2 3 4 5 6 7 8 9 |
| GO ID | Tissue | Disease Stage | Description | Gene Ratio | Bg Ratio | pvalue | p.adjust | Count |
| GO:0019318 | Colorectum | AD | hexose metabolic process | 77/3918 | 237/18723 | 1.96e-05 | 4.01e-04 | 77 |
| GO:0016042 | Colorectum | AD | lipid catabolic process | 97/3918 | 320/18723 | 4.31e-05 | 7.56e-04 | 97 |
| GO:0005996 | Colorectum | AD | monosaccharide metabolic process | 80/3918 | 257/18723 | 7.31e-05 | 1.17e-03 | 80 |
| GO:0044242 | Colorectum | AD | cellular lipid catabolic process | 66/3918 | 214/18723 | 3.96e-04 | 4.50e-03 | 66 |
| GO:00160421 | Colorectum | SER | lipid catabolic process | 77/2897 | 320/18723 | 3.52e-05 | 9.18e-04 | 77 |
| GO:00193181 | Colorectum | SER | hexose metabolic process | 56/2897 | 237/18723 | 6.19e-04 | 8.42e-03 | 56 |
| GO:00442421 | Colorectum | SER | cellular lipid catabolic process | 51/2897 | 214/18723 | 8.60e-04 | 1.05e-02 | 51 |
| GO:00059961 | Colorectum | SER | monosaccharide metabolic process | 59/2897 | 257/18723 | 9.65e-04 | 1.15e-02 | 59 |
| GO:00193182 | Colorectum | MSS | hexose metabolic process | 63/3467 | 237/18723 | 1.32e-03 | 1.25e-02 | 63 |
| GO:00059962 | Colorectum | MSS | monosaccharide metabolic process | 66/3467 | 257/18723 | 2.61e-03 | 2.06e-02 | 66 |
| GO:00160422 | Colorectum | MSS | lipid catabolic process | 77/3467 | 320/18723 | 7.43e-03 | 4.71e-02 | 77 |
| GO:00193183 | Colorectum | FAP | hexose metabolic process | 58/2622 | 237/18723 | 1.09e-05 | 3.08e-04 | 58 |
| GO:00059963 | Colorectum | FAP | monosaccharide metabolic process | 59/2622 | 257/18723 | 6.79e-05 | 1.28e-03 | 59 |
| GO:00442422 | Colorectum | FAP | cellular lipid catabolic process | 49/2622 | 214/18723 | 2.87e-04 | 3.77e-03 | 49 |
| GO:00160423 | Colorectum | FAP | lipid catabolic process | 65/2622 | 320/18723 | 1.13e-03 | 1.08e-02 | 65 |
| GO:00066433 | Esophagus | ESCC | membrane lipid metabolic process | 130/8552 | 203/18723 | 9.29e-08 | 1.54e-06 | 130 |
| GO:00059969 | Esophagus | ESCC | monosaccharide metabolic process | 159/8552 | 257/18723 | 1.11e-07 | 1.81e-06 | 159 |
| GO:00193189 | Esophagus | ESCC | hexose metabolic process | 147/8552 | 237/18723 | 2.63e-07 | 3.94e-06 | 147 |
| GO:19016574 | Esophagus | ESCC | glycosyl compound metabolic process | 57/8552 | 88/18723 | 2.32e-04 | 1.44e-03 | 57 |
| GO:00066642 | Esophagus | ESCC | glycolipid metabolic process | 63/8552 | 100/18723 | 3.55e-04 | 2.06e-03 | 63 |
| Page: 1 2 3 |
| Pathway ID | Tissue | Disease Stage | Description | Gene Ratio | Bg Ratio | pvalue | p.adjust | qvalue | Count |
| Page: 1 |
Top |
Cell-cell communication analysis |
| Identification of potential cell-cell interactions between two cell types and their ligand-receptor pairs for different disease states |
| Ligand | Receptor | LRpair | Pathway | Tissue | Disease Stage |
| Page: 1 |
Top |
Single-cell gene regulatory network inference analysis |
| Find out the significant the regulons (TFs) and the target genes of each regulon across cell types for different disease states |
| TF | Cell Type | Tissue | Disease Stage | Target Gene | RSS | Regulon Activity |
| ∗The dot plots of a searched regulon are shown for all cell subpopulations in each disease state of each tissue based on the regulon specific score inferred using pySCENIC and by calculating the average expression. |
| Page: 1 |
Top |
Somatic mutation of malignant transformation related genes |
| Annotation of somatic variants for genes involved in malignant transformation |
| Hugo Symbol | Variant Class | Variant Classification | dbSNP RS | HGVSc | HGVSp | HGVSp Short | SWISSPROT | BIOTYPE | SIFT | PolyPhen | Tumor Sample Barcode | Tissue | Histology | Sex | Age | Stage | Therapy Types | Drugs | Outcome |
| Page: 1 |
Top |
Related drugs of malignant transformation related genes |
| Identification of chemicals and drugs interact with genes involved in malignant transfromation |
| (DGIdb 4.0) |
| Entrez ID | Symbol | Category | Interaction Types | Drug Claim Name | Drug Name | PMIDs |
| Page: 1 |

Copyright 2023-Present -The University of Texas Health Science Center at Houston |