
|
|||||
|
 | |
| |
| |
| |
| |
| |
|
Gene: UBXN7 |
Gene summary for UBXN7 |
| Gene information | Species | Human | Gene symbol | UBXN7 | Gene ID | 26043 |
| Gene name | UBX domain protein 7 | |
| Gene Alias | UBXD7 | |
| Cytomap | 3q29 | |
| Gene Type | protein-coding | GO ID | GO:0005575 | UniProtAcc | O94888 |
Top |
Malignant transformation analysis |
| Identification of the aberrant gene expression in precancerous and cancerous lesions by comparing the gene expression of stem-like cells in diseased tissues with normal stem cells |
| Entrez ID | Symbol | Replicates | Species | Organ | Tissue | Adj P-value | Log2FC | Malignancy |
| 26043 | UBXN7 | CCI_2 | Human | Cervix | CC | 2.57e-12 | 1.45e+00 | 0.5249 |
| 26043 | UBXN7 | CCI_3 | Human | Cervix | CC | 4.52e-11 | 8.38e-01 | 0.516 |
| 26043 | UBXN7 | sample3 | Human | Cervix | CC | 4.50e-03 | 1.69e-01 | 0.1387 |
| 26043 | UBXN7 | T3 | Human | Cervix | CC | 1.85e-04 | 1.55e-01 | 0.1389 |
| 26043 | UBXN7 | LZE2T | Human | Esophagus | ESCC | 2.90e-04 | 8.15e-01 | 0.082 |
| 26043 | UBXN7 | LZE4T | Human | Esophagus | ESCC | 4.66e-24 | 7.79e-01 | 0.0811 |
| 26043 | UBXN7 | LZE7T | Human | Esophagus | ESCC | 2.97e-13 | 8.07e-01 | 0.0667 |
| 26043 | UBXN7 | LZE20T | Human | Esophagus | ESCC | 1.10e-02 | 2.10e-01 | 0.0662 |
| 26043 | UBXN7 | LZE22T | Human | Esophagus | ESCC | 1.07e-03 | 3.15e-01 | 0.068 |
| 26043 | UBXN7 | LZE24T | Human | Esophagus | ESCC | 2.25e-20 | 5.13e-01 | 0.0596 |
| 26043 | UBXN7 | LZE21T | Human | Esophagus | ESCC | 8.21e-07 | 4.71e-01 | 0.0655 |
| 26043 | UBXN7 | LZE6T | Human | Esophagus | ESCC | 5.11e-05 | 3.14e-01 | 0.0845 |
| 26043 | UBXN7 | P1T-E | Human | Esophagus | ESCC | 3.98e-03 | 3.75e-01 | 0.0875 |
| 26043 | UBXN7 | P2T-E | Human | Esophagus | ESCC | 1.15e-57 | 1.07e+00 | 0.1177 |
| 26043 | UBXN7 | P4T-E | Human | Esophagus | ESCC | 2.66e-33 | 7.48e-01 | 0.1323 |
| 26043 | UBXN7 | P5T-E | Human | Esophagus | ESCC | 1.54e-16 | 2.42e-01 | 0.1327 |
| 26043 | UBXN7 | P8T-E | Human | Esophagus | ESCC | 2.57e-33 | 6.26e-01 | 0.0889 |
| 26043 | UBXN7 | P9T-E | Human | Esophagus | ESCC | 3.49e-34 | 5.83e-01 | 0.1131 |
| 26043 | UBXN7 | P10T-E | Human | Esophagus | ESCC | 4.84e-47 | 9.02e-01 | 0.116 |
| 26043 | UBXN7 | P11T-E | Human | Esophagus | ESCC | 1.10e-12 | 4.11e-01 | 0.1426 |
| Page: 1 2 3 4 5 6 |
| Tissue | Expression Dynamics | Abbreviation |
| Cervix | 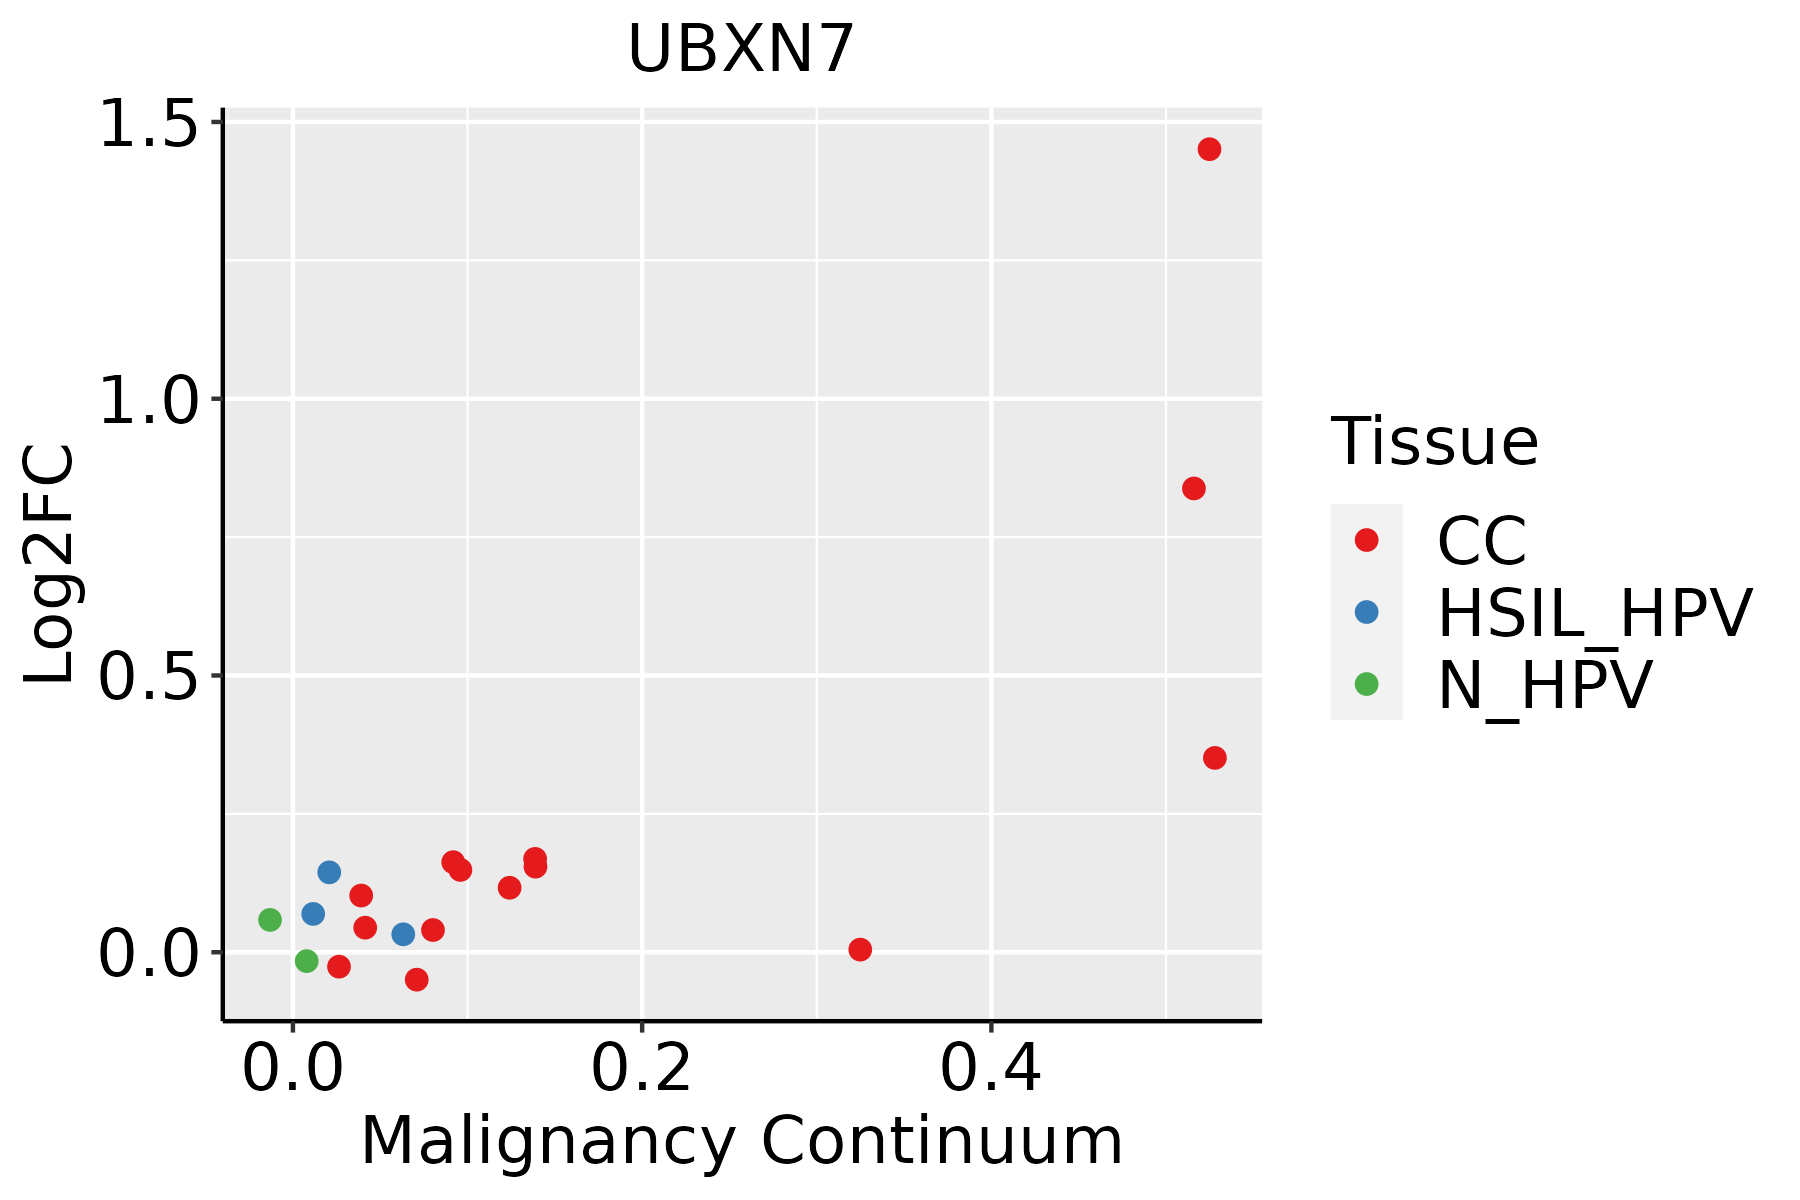 | CC: Cervix cancer |
| HSIL_HPV: HPV-infected high-grade squamous intraepithelial lesions | ||
| N_HPV: HPV-infected normal cervix | ||
| Esophagus |  | ESCC: Esophageal squamous cell carcinoma |
| HGIN: High-grade intraepithelial neoplasias | ||
| LGIN: Low-grade intraepithelial neoplasias | ||
| Liver | 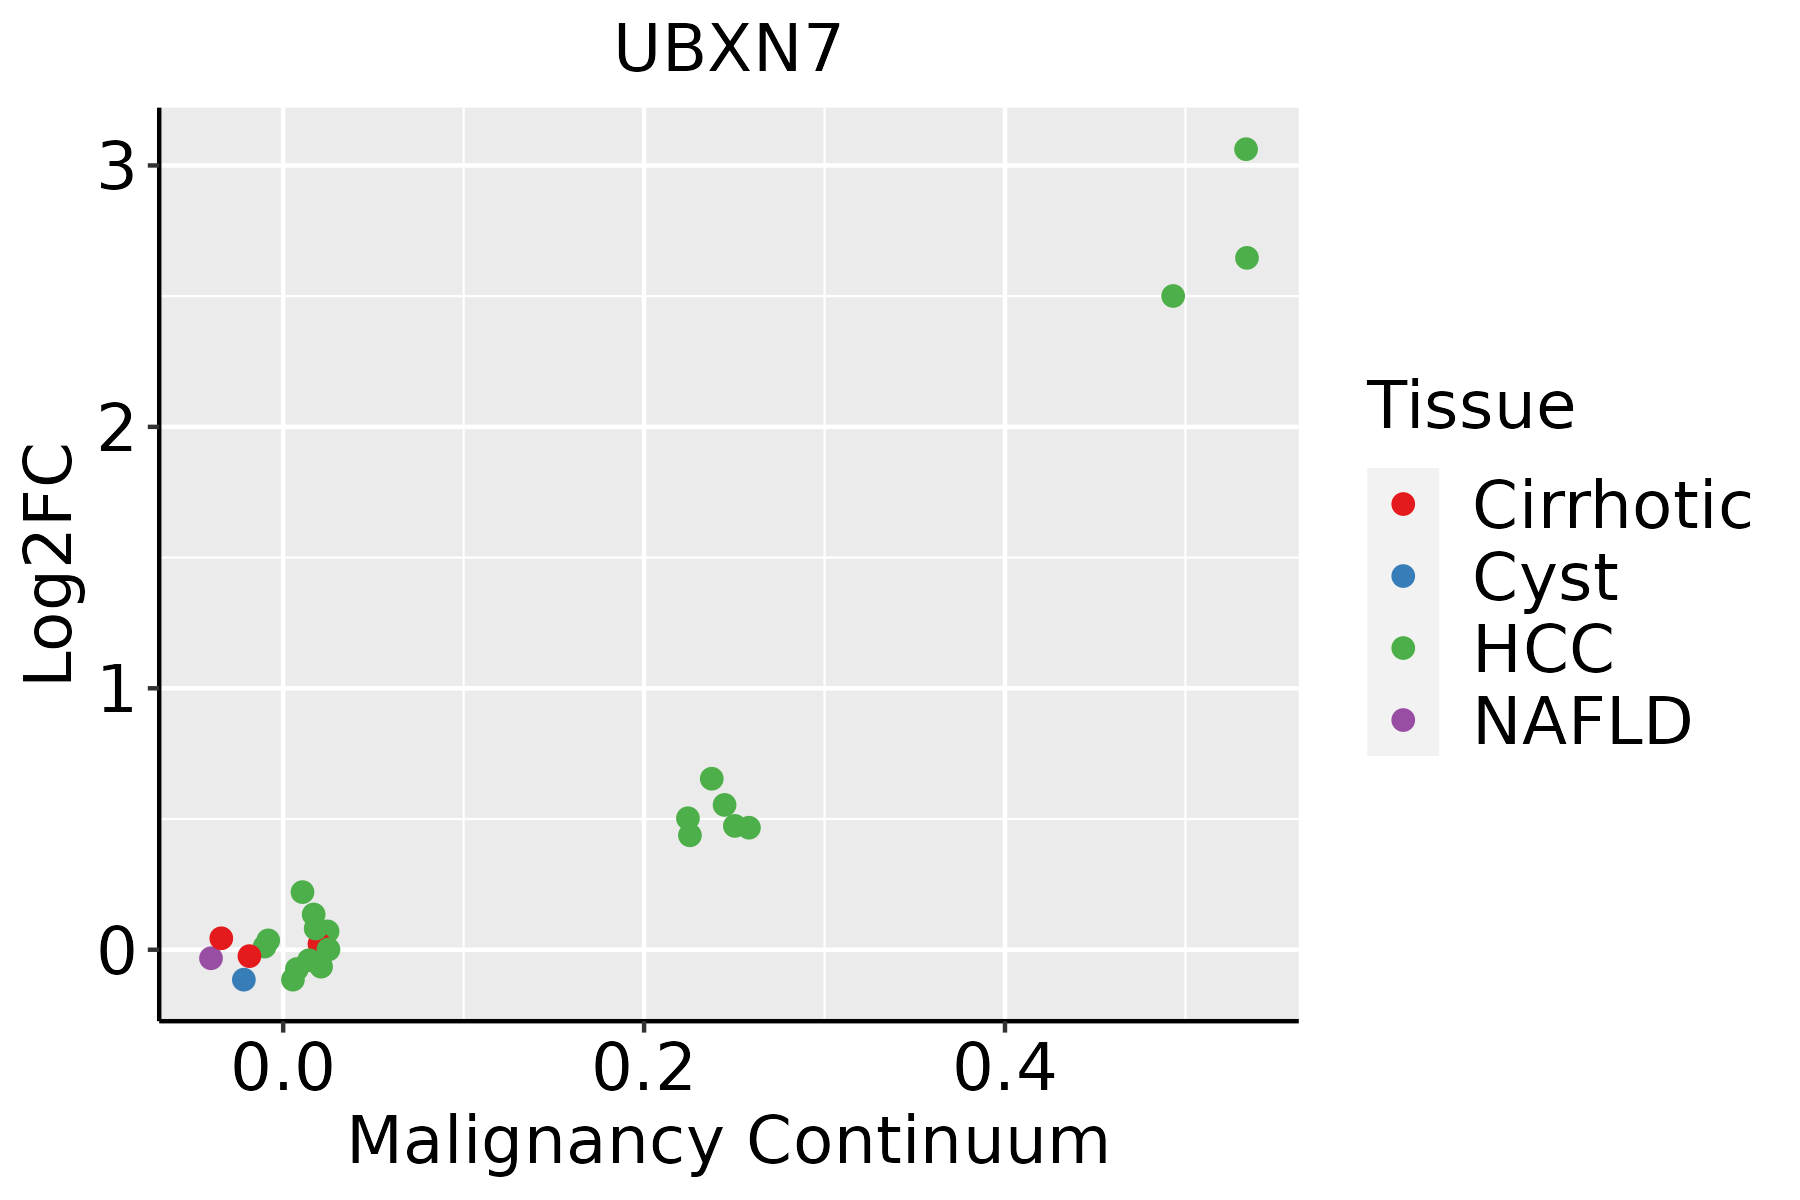 | HCC: Hepatocellular carcinoma |
| NAFLD: Non-alcoholic fatty liver disease | ||
| Oral Cavity | 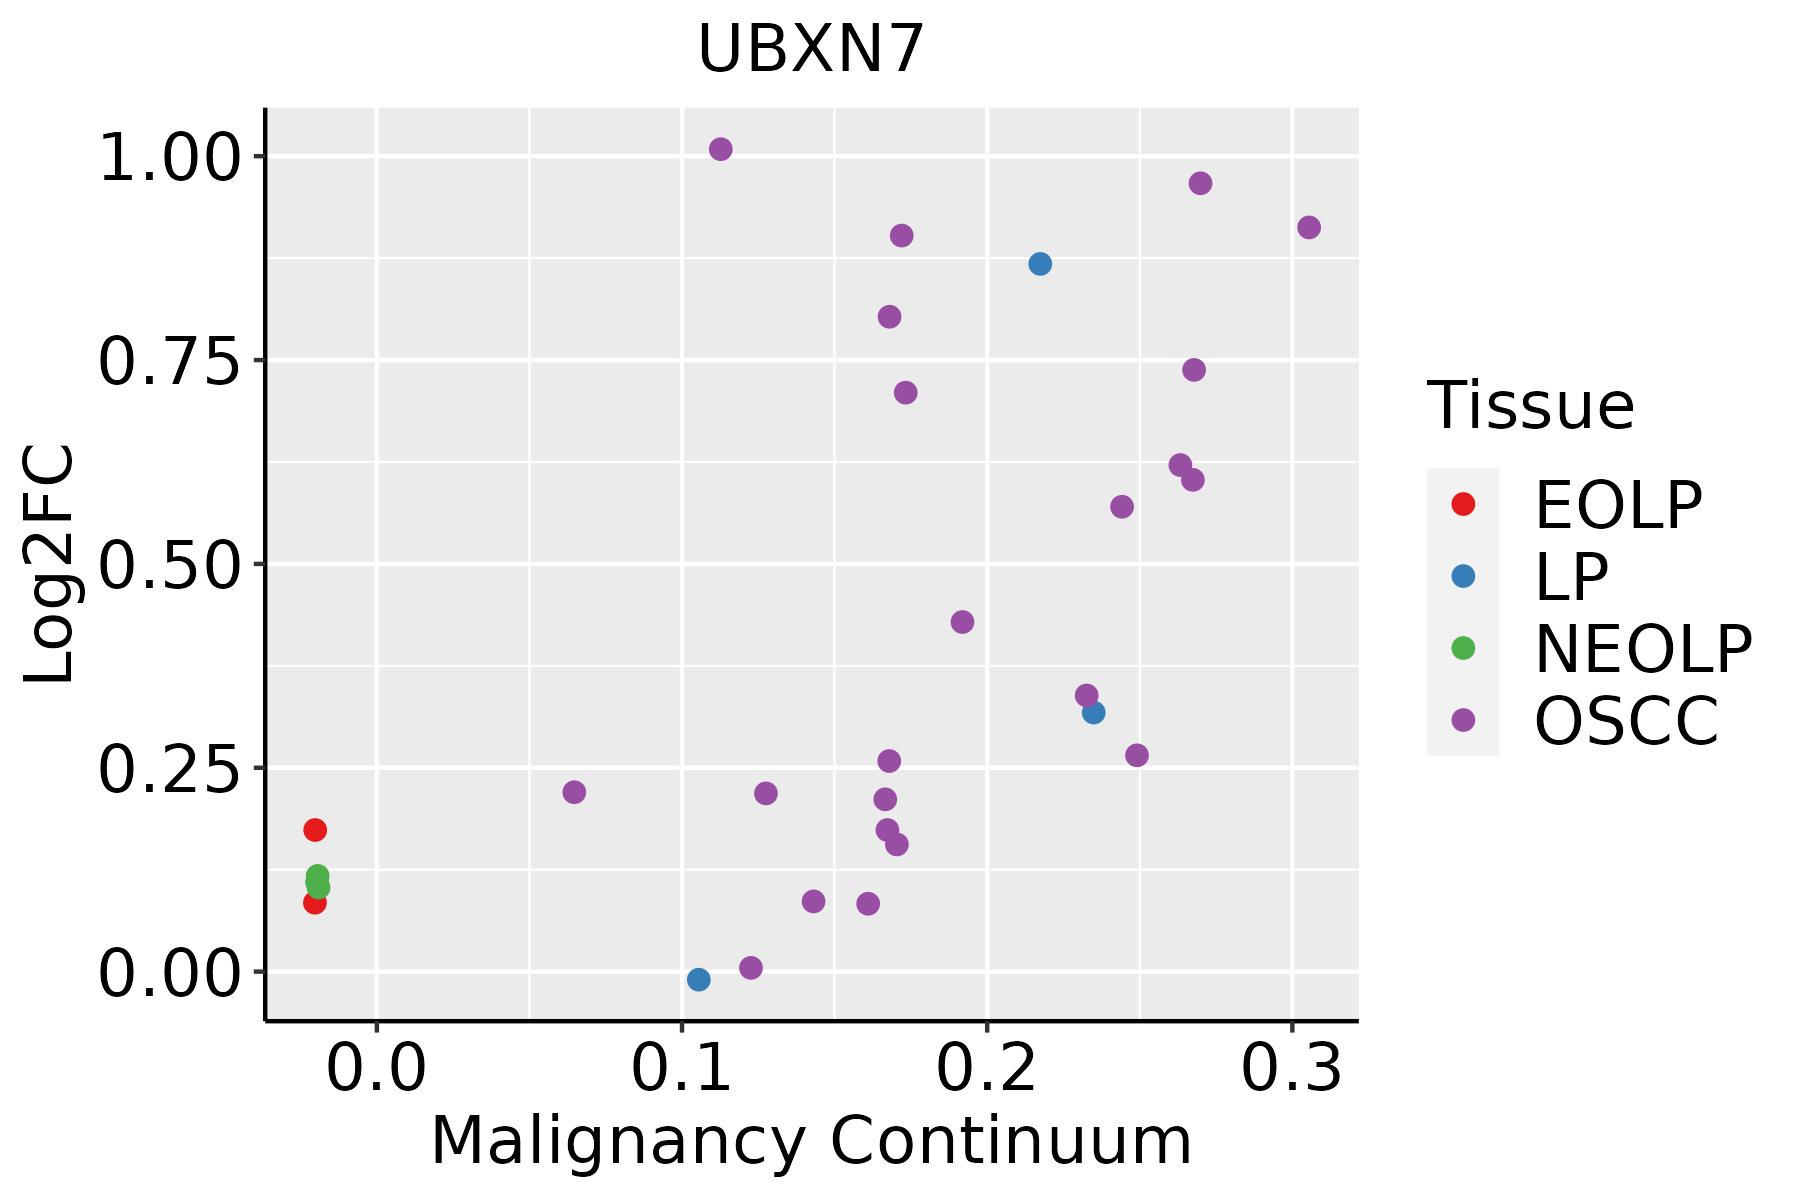 | EOLP: Erosive Oral lichen planus |
| LP: leukoplakia | ||
| NEOLP: Non-erosive oral lichen planus | ||
| OSCC: Oral squamous cell carcinoma | ||
| Thyroid | 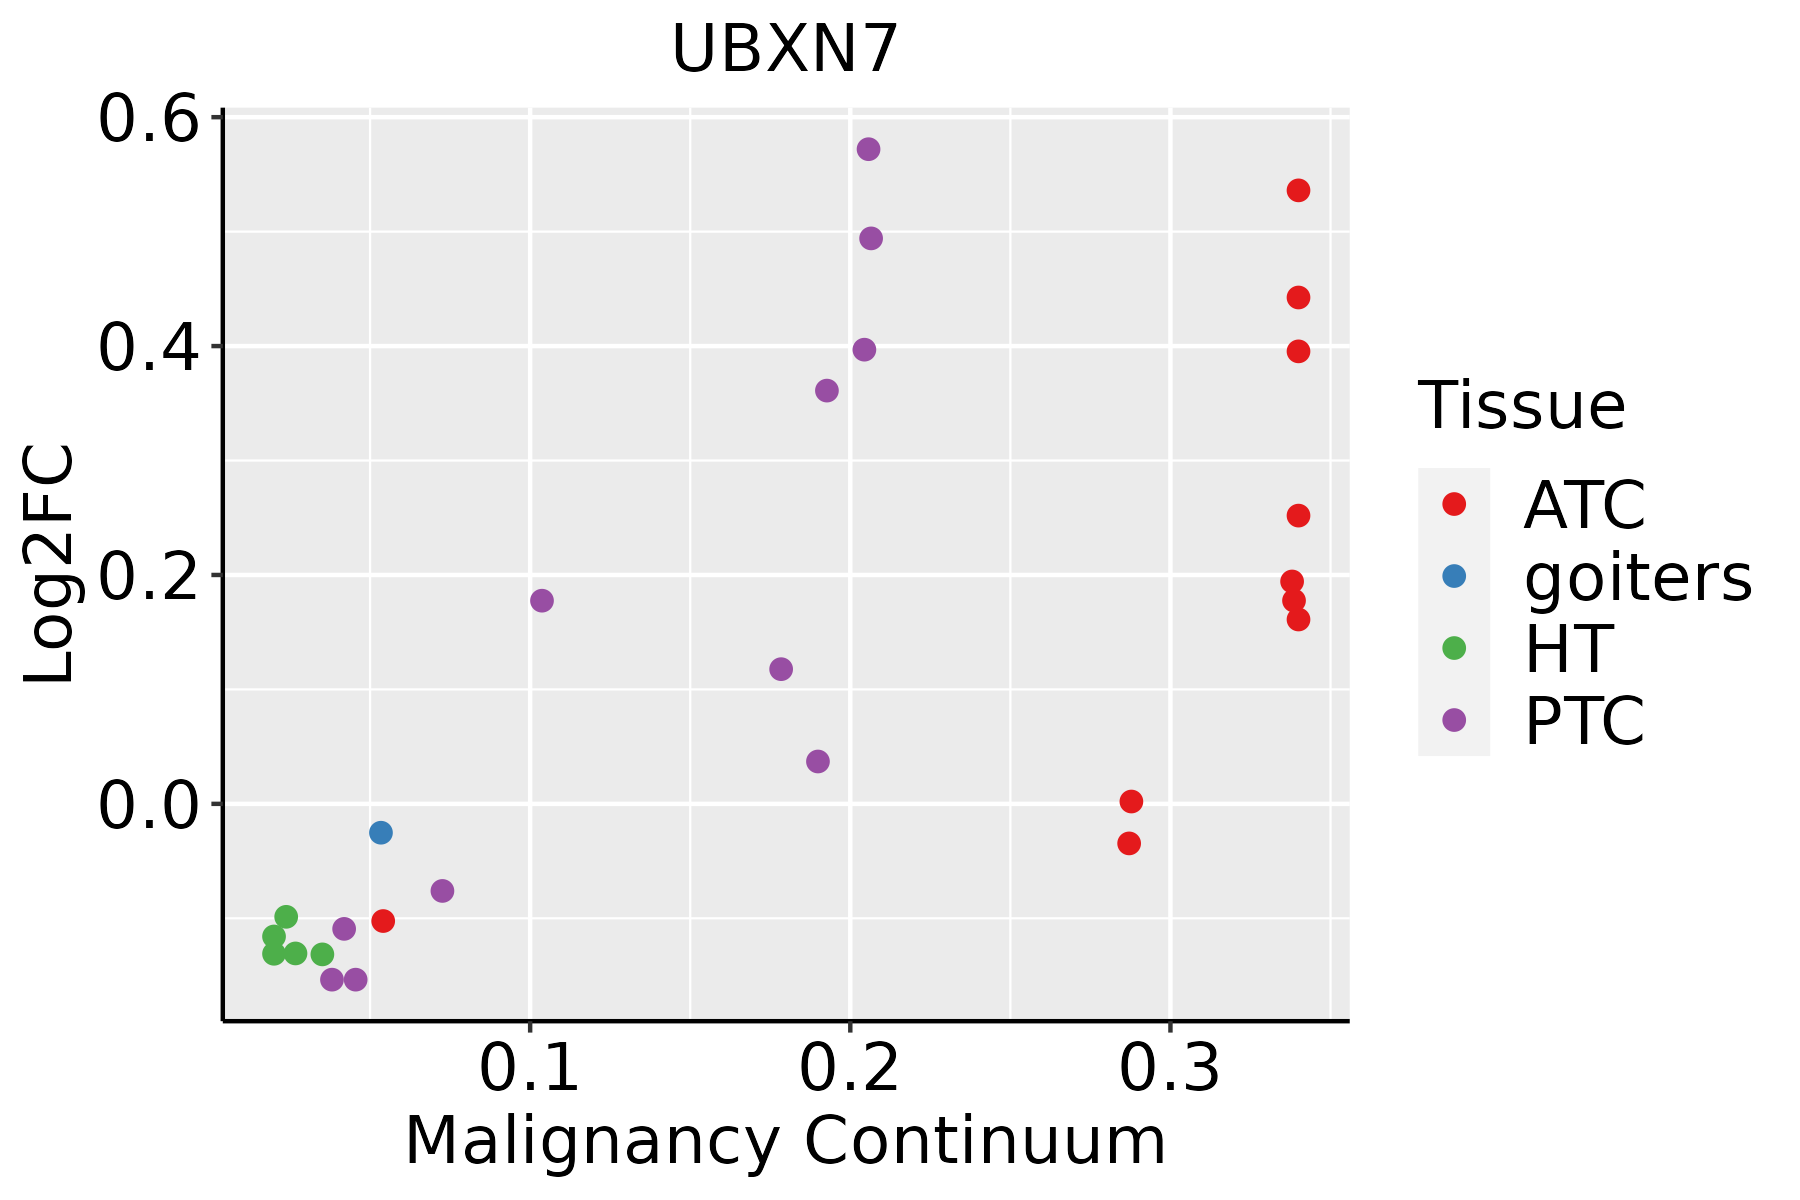 | ATC: Anaplastic thyroid cancer |
| HT: Hashimoto's thyroiditis | ||
| PTC: Papillary thyroid cancer |
| ∗log2FC in expression of this searched gene in stem-like cells from each diseased tissue sample relative to stem-like cells in normal samples in each tissue plotted against the malignancy continuum. Samples are colored based on if they are from different disease stage. |
Top |
Malignant transformation related pathway analysis |
| Find out the enriched GO biological processes and KEGG pathways involved in transition from healthy to precancer to cancer |
| Tissue | Disease Stage | Enriched GO biological Processes |
| Colorectum | AD |  |
| Colorectum | SER |  |
| Colorectum | MSS |  |
| Colorectum | MSI-H |  |
| Colorectum | FAP |  |
| ∗Top 15 enriched GO BP terms are showed in the bar plot of each disease state in each tissue. Each row represents a significant GO biological process which is colored according to the -log10(p.adjust). |
| Page: 1 2 3 4 5 6 7 8 9 |
| GO ID | Tissue | Disease Stage | Description | Gene Ratio | Bg Ratio | pvalue | p.adjust | Count |
| Page: 1 |
| Pathway ID | Tissue | Disease Stage | Description | Gene Ratio | Bg Ratio | pvalue | p.adjust | qvalue | Count |
| Page: 1 |
Top |
Cell-cell communication analysis |
| Identification of potential cell-cell interactions between two cell types and their ligand-receptor pairs for different disease states |
| Ligand | Receptor | LRpair | Pathway | Tissue | Disease Stage |
| Page: 1 |
Top |
Single-cell gene regulatory network inference analysis |
| Find out the significant the regulons (TFs) and the target genes of each regulon across cell types for different disease states |
| TF | Cell Type | Tissue | Disease Stage | Target Gene | RSS | Regulon Activity |
| ∗The dot plots of a searched regulon are shown for all cell subpopulations in each disease state of each tissue based on the regulon specific score inferred using pySCENIC and by calculating the average expression. |
| Page: 1 |
Top |
Somatic mutation of malignant transformation related genes |
| Annotation of somatic variants for genes involved in malignant transformation |
| Hugo Symbol | Variant Class | Variant Classification | dbSNP RS | HGVSc | HGVSp | HGVSp Short | SWISSPROT | BIOTYPE | SIFT | PolyPhen | Tumor Sample Barcode | Tissue | Histology | Sex | Age | Stage | Therapy Types | Drugs | Outcome |
| UBXN7 | SNV | Missense_Mutation | novel | c.1237G>C | p.Ala413Pro | p.A413P | O94888 | protein_coding | deleterious(0.02) | probably_damaging(0.926) | TCGA-A2-A3Y0-01 | Breast | breast invasive carcinoma | Female | <65 | I/II | Chemotherapy | adriamycin | CR |
| UBXN7 | SNV | Missense_Mutation | novel | c.343C>A | p.Gln115Lys | p.Q115K | O94888 | protein_coding | deleterious(0.01) | possibly_damaging(0.9) | TCGA-BH-A0BM-01 | Breast | breast invasive carcinoma | Female | <65 | I/II | Chemotherapy | adriamycin | SD |
| UBXN7 | SNV | Missense_Mutation | novel | c.1285C>G | p.Leu429Val | p.L429V | O94888 | protein_coding | deleterious(0.02) | probably_damaging(0.99) | TCGA-BH-A2L8-01 | Breast | breast invasive carcinoma | Female | <65 | I/II | Chemotherapy | cytoxan | CR |
| UBXN7 | SNV | Missense_Mutation | novel | c.176C>A | p.Pro59His | p.P59H | O94888 | protein_coding | deleterious(0.03) | probably_damaging(0.921) | TCGA-EW-A6SA-01 | Breast | breast invasive carcinoma | Male | <65 | I/II | Unknown | Unknown | SD |
| UBXN7 | SNV | Missense_Mutation | novel | c.644N>C | p.Arg215Thr | p.R215T | O94888 | protein_coding | deleterious(0) | possibly_damaging(0.664) | TCGA-OL-A5DA-01 | Breast | breast invasive carcinoma | Female | <65 | I/II | Unknown | Unknown | SD |
| UBXN7 | SNV | Missense_Mutation | novel | c.1411A>G | p.Thr471Ala | p.T471A | O94888 | protein_coding | deleterious(0.01) | probably_damaging(0.99) | TCGA-2W-A8YY-01 | Cervix | cervical & endocervical cancer | Female | <65 | I/II | Chemotherapy | cisplatin | CR |
| UBXN7 | SNV | Missense_Mutation | c.1099N>G | p.Thr367Ala | p.T367A | O94888 | protein_coding | tolerated(1) | benign(0) | TCGA-AA-3715-01 | Colorectum | colon adenocarcinoma | Male | >=65 | I/II | Unknown | Unknown | PD | |
| UBXN7 | SNV | Missense_Mutation | c.951A>C | p.Glu317Asp | p.E317D | O94888 | protein_coding | tolerated(0.54) | benign(0) | TCGA-AA-A02O-01 | Colorectum | colon adenocarcinoma | Male | >=65 | I/II | Unknown | Unknown | SD | |
| UBXN7 | SNV | Missense_Mutation | rs753012779 | c.314N>A | p.Arg105His | p.R105H | O94888 | protein_coding | tolerated(0.2) | benign(0.379) | TCGA-WS-AB45-01 | Colorectum | colon adenocarcinoma | Female | <65 | I/II | Unknown | Unknown | SD |
| UBXN7 | SNV | Missense_Mutation | c.1280T>A | p.Ile427Asn | p.I427N | O94888 | protein_coding | deleterious(0) | possibly_damaging(0.67) | TCGA-EF-5830-01 | Colorectum | rectum adenocarcinoma | Male | <65 | I/II | Unknown | Unknown | SD |
| Page: 1 2 3 4 5 6 |
Top |
Related drugs of malignant transformation related genes |
| Identification of chemicals and drugs interact with genes involved in malignant transfromation |
| (DGIdb 4.0) |
| Entrez ID | Symbol | Category | Interaction Types | Drug Claim Name | Drug Name | PMIDs |
| Page: 1 |

Copyright 2023-Present -The University of Texas Health Science Center at Houston |