
|
|||||
|
 | |
| |
| |
| |
| |
| |
|
Gene: UBXN4 |
Gene summary for UBXN4 |
| Gene information | Species | Human | Gene symbol | UBXN4 | Gene ID | 23190 |
| Gene name | UBX domain protein 4 | |
| Gene Alias | UBXD2 | |
| Cytomap | 2q21.3 | |
| Gene Type | protein-coding | GO ID | GO:0006508 | UniProtAcc | Q92575 |
Top |
Malignant transformation analysis |
| Identification of the aberrant gene expression in precancerous and cancerous lesions by comparing the gene expression of stem-like cells in diseased tissues with normal stem cells |
| Entrez ID | Symbol | Replicates | Species | Organ | Tissue | Adj P-value | Log2FC | Malignancy |
| 23190 | UBXN4 | HTA11_347_2000001011 | Human | Colorectum | AD | 8.48e-11 | 4.58e-01 | -0.1954 |
| 23190 | UBXN4 | HTA11_99999965062_69753 | Human | Colorectum | MSI-H | 4.15e-03 | 9.70e-01 | 0.3487 |
| 23190 | UBXN4 | A015-C-203 | Human | Colorectum | FAP | 5.71e-22 | -1.67e-01 | -0.1294 |
| 23190 | UBXN4 | A015-C-204 | Human | Colorectum | FAP | 1.57e-02 | -1.69e-01 | -0.0228 |
| 23190 | UBXN4 | A002-C-201 | Human | Colorectum | FAP | 9.11e-05 | -1.31e-01 | 0.0324 |
| 23190 | UBXN4 | A001-C-119 | Human | Colorectum | FAP | 3.46e-05 | 2.39e-01 | -0.1557 |
| 23190 | UBXN4 | A001-C-108 | Human | Colorectum | FAP | 4.36e-16 | 1.27e-01 | -0.0272 |
| 23190 | UBXN4 | A002-C-205 | Human | Colorectum | FAP | 2.06e-13 | -1.16e-01 | -0.1236 |
| 23190 | UBXN4 | A001-C-104 | Human | Colorectum | FAP | 1.07e-02 | 1.47e-01 | 0.0184 |
| 23190 | UBXN4 | A015-C-006 | Human | Colorectum | FAP | 1.06e-08 | -4.84e-02 | -0.0994 |
| 23190 | UBXN4 | A015-C-106 | Human | Colorectum | FAP | 1.36e-08 | 2.44e-02 | -0.0511 |
| 23190 | UBXN4 | A002-C-114 | Human | Colorectum | FAP | 4.24e-11 | -2.92e-02 | -0.1561 |
| 23190 | UBXN4 | A015-C-104 | Human | Colorectum | FAP | 8.35e-25 | 1.53e-02 | -0.1899 |
| 23190 | UBXN4 | A001-C-014 | Human | Colorectum | FAP | 2.26e-09 | -3.74e-02 | 0.0135 |
| 23190 | UBXN4 | A002-C-016 | Human | Colorectum | FAP | 9.09e-18 | -1.13e-01 | 0.0521 |
| 23190 | UBXN4 | A015-C-002 | Human | Colorectum | FAP | 3.28e-06 | -1.49e-01 | -0.0763 |
| 23190 | UBXN4 | A001-C-203 | Human | Colorectum | FAP | 8.27e-07 | -3.99e-02 | -0.0481 |
| 23190 | UBXN4 | A002-C-116 | Human | Colorectum | FAP | 3.38e-26 | -2.68e-01 | -0.0452 |
| 23190 | UBXN4 | A014-C-008 | Human | Colorectum | FAP | 2.64e-07 | -1.73e-01 | -0.191 |
| 23190 | UBXN4 | A018-E-020 | Human | Colorectum | FAP | 3.28e-11 | -2.61e-02 | -0.2034 |
| Page: 1 2 3 4 5 6 7 8 9 10 11 12 |
| Tissue | Expression Dynamics | Abbreviation |
| Colorectum (GSE201348) |  | FAP: Familial adenomatous polyposis |
| CRC: Colorectal cancer | ||
| Colorectum (HTA11) |  | AD: Adenomas |
| SER: Sessile serrated lesions | ||
| MSI-H: Microsatellite-high colorectal cancer | ||
| MSS: Microsatellite stable colorectal cancer | ||
| Endometrium |  | AEH: Atypical endometrial hyperplasia |
| EEC: Endometrioid Cancer | ||
| Esophagus |  | ESCC: Esophageal squamous cell carcinoma |
| HGIN: High-grade intraepithelial neoplasias | ||
| LGIN: Low-grade intraepithelial neoplasias | ||
| Liver | 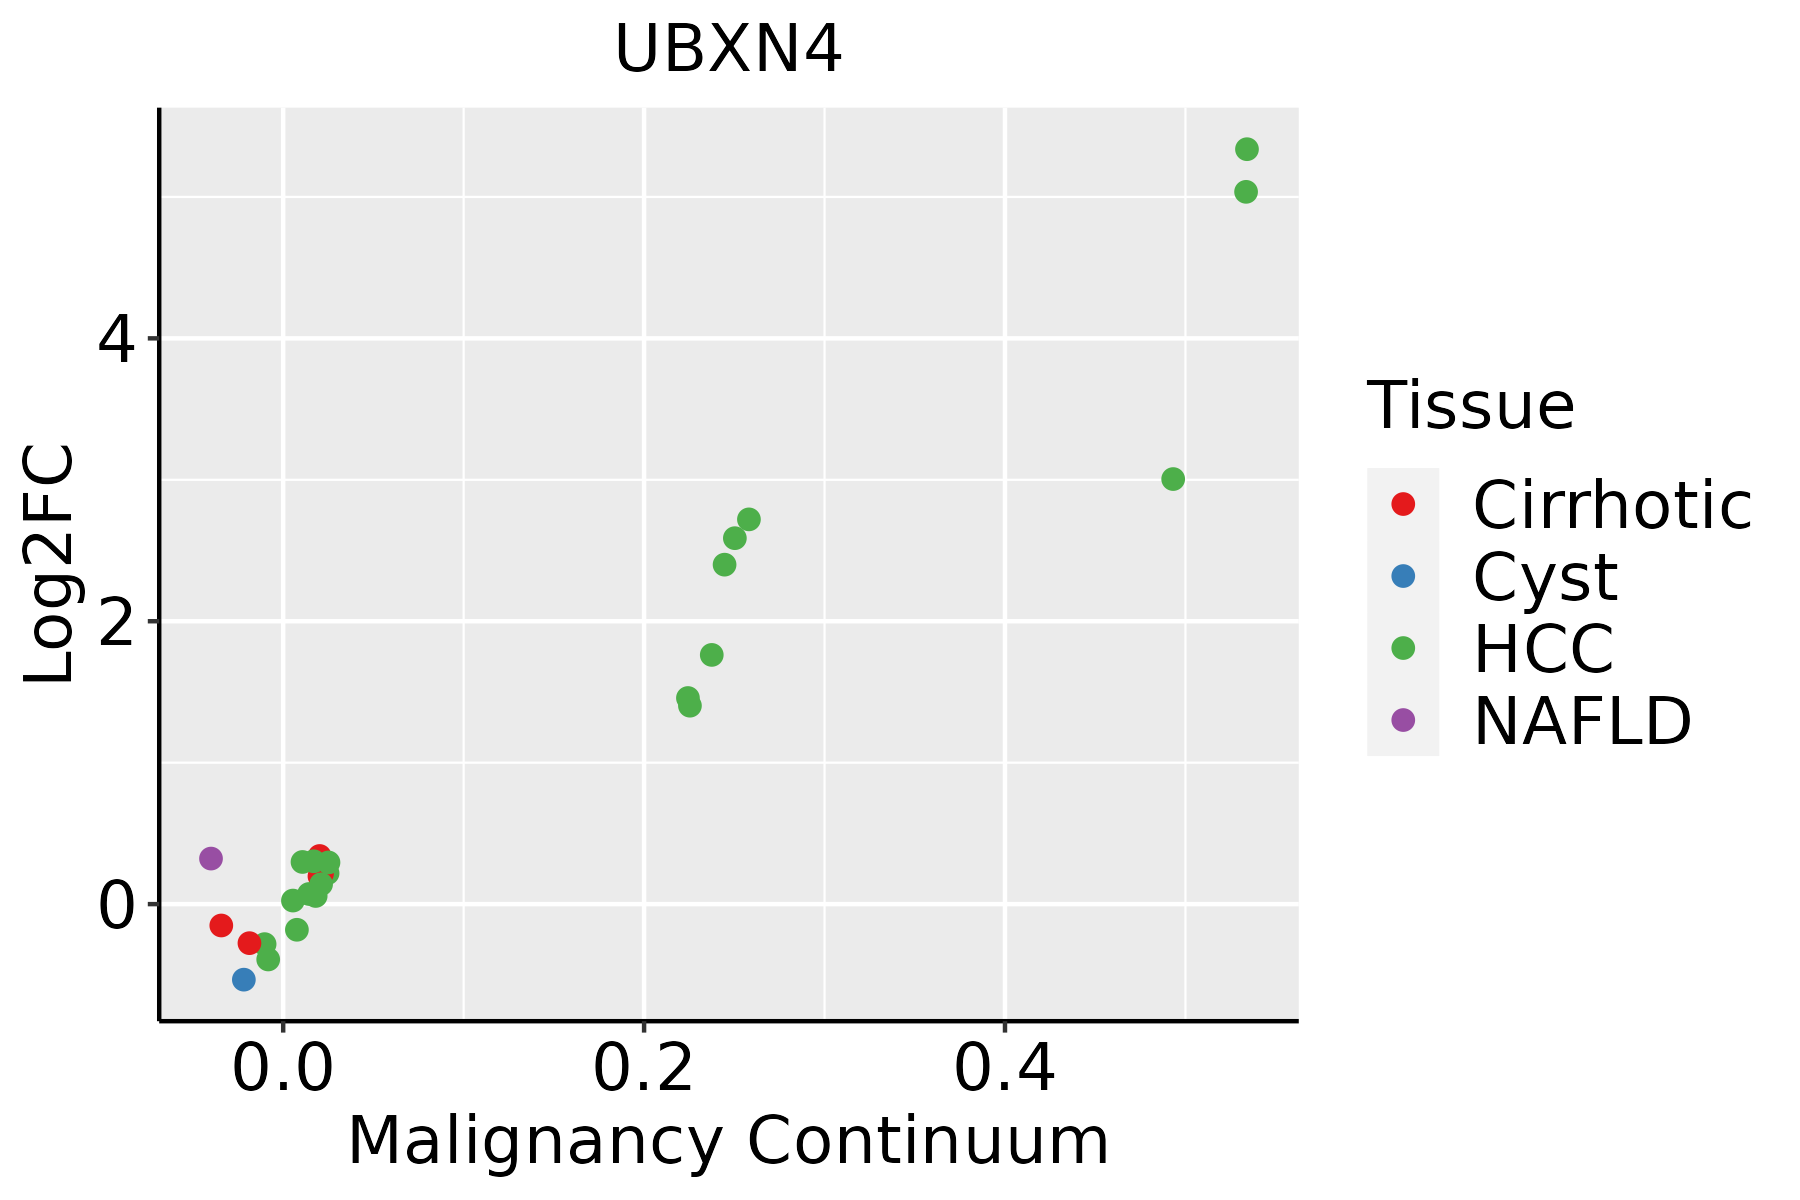 | HCC: Hepatocellular carcinoma |
| NAFLD: Non-alcoholic fatty liver disease | ||
| Lung | 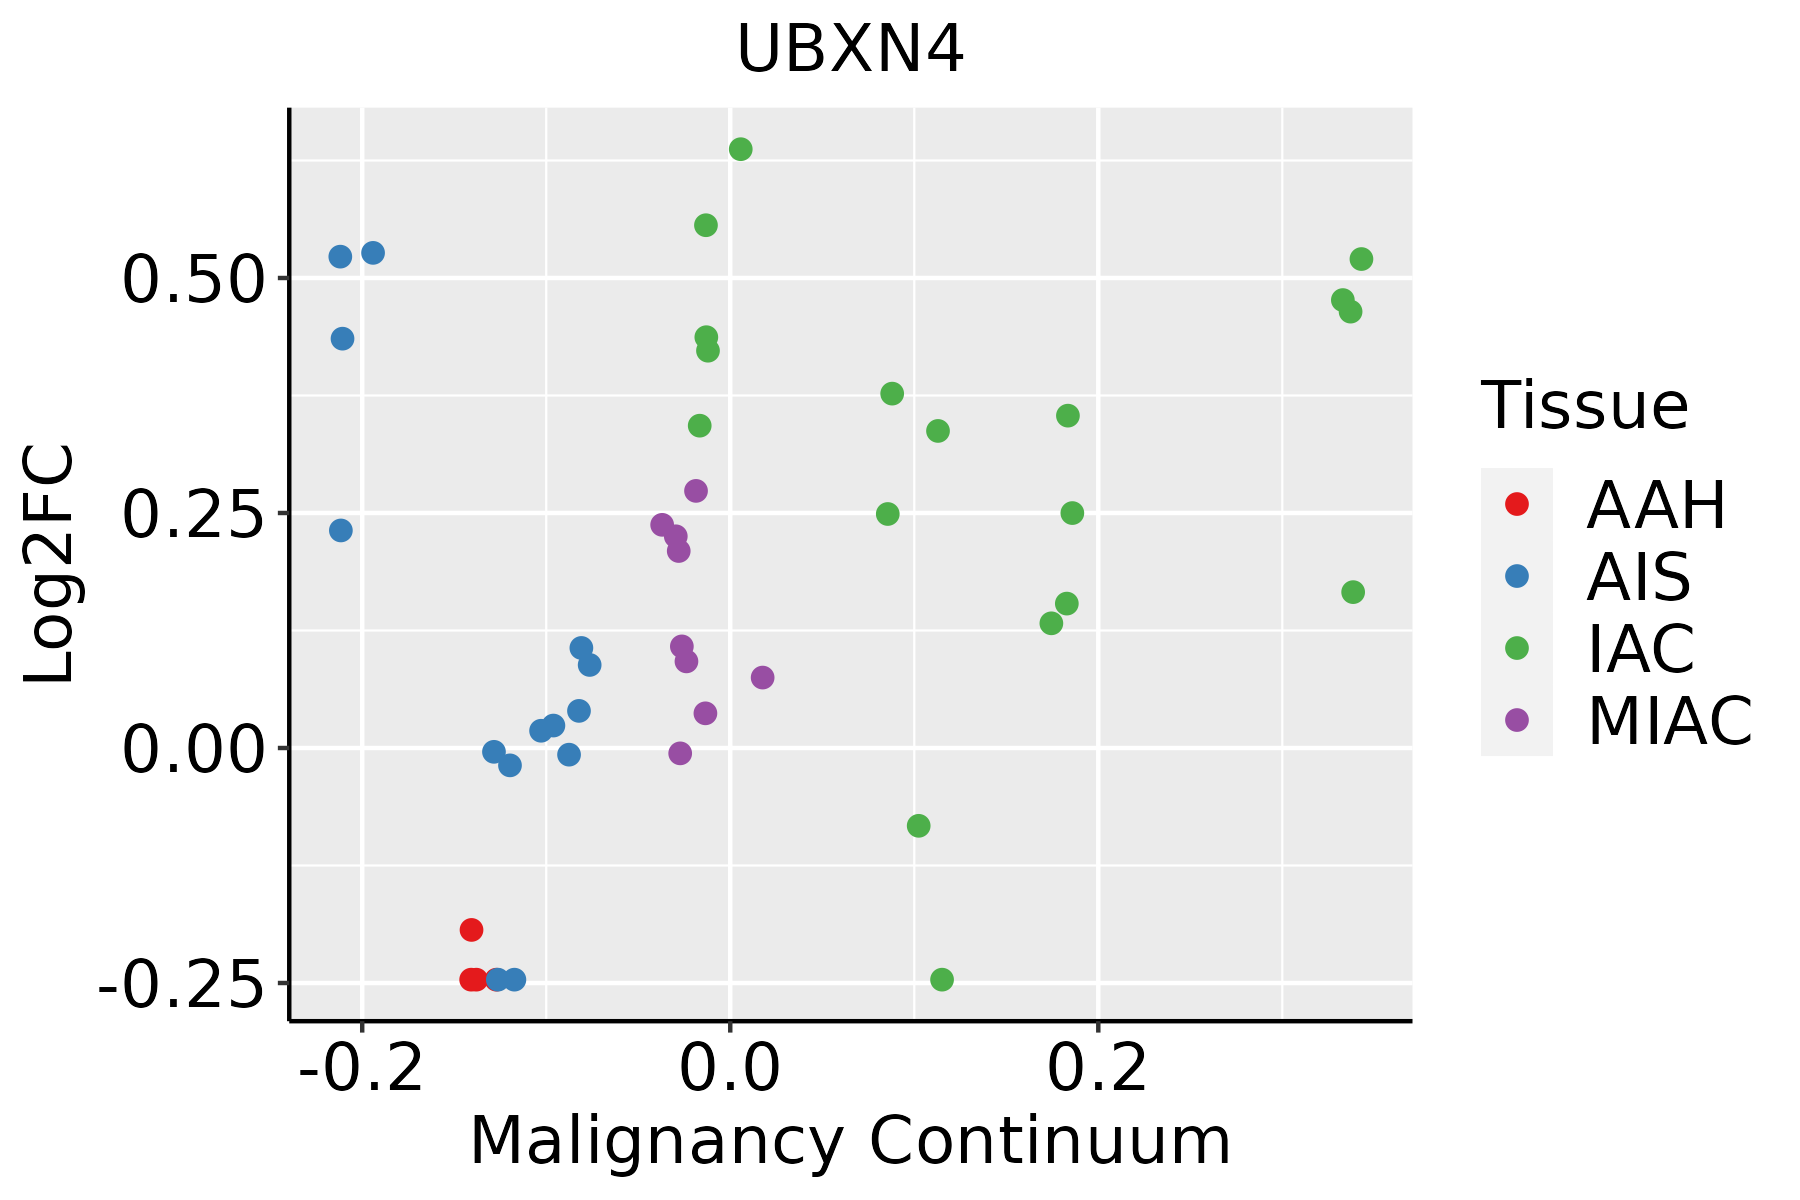 | AAH: Atypical adenomatous hyperplasia |
| AIS: Adenocarcinoma in situ | ||
| IAC: Invasive lung adenocarcinoma | ||
| MIA: Minimally invasive adenocarcinoma | ||
| Oral Cavity |  | EOLP: Erosive Oral lichen planus |
| LP: leukoplakia | ||
| NEOLP: Non-erosive oral lichen planus | ||
| OSCC: Oral squamous cell carcinoma | ||
| Prostate | 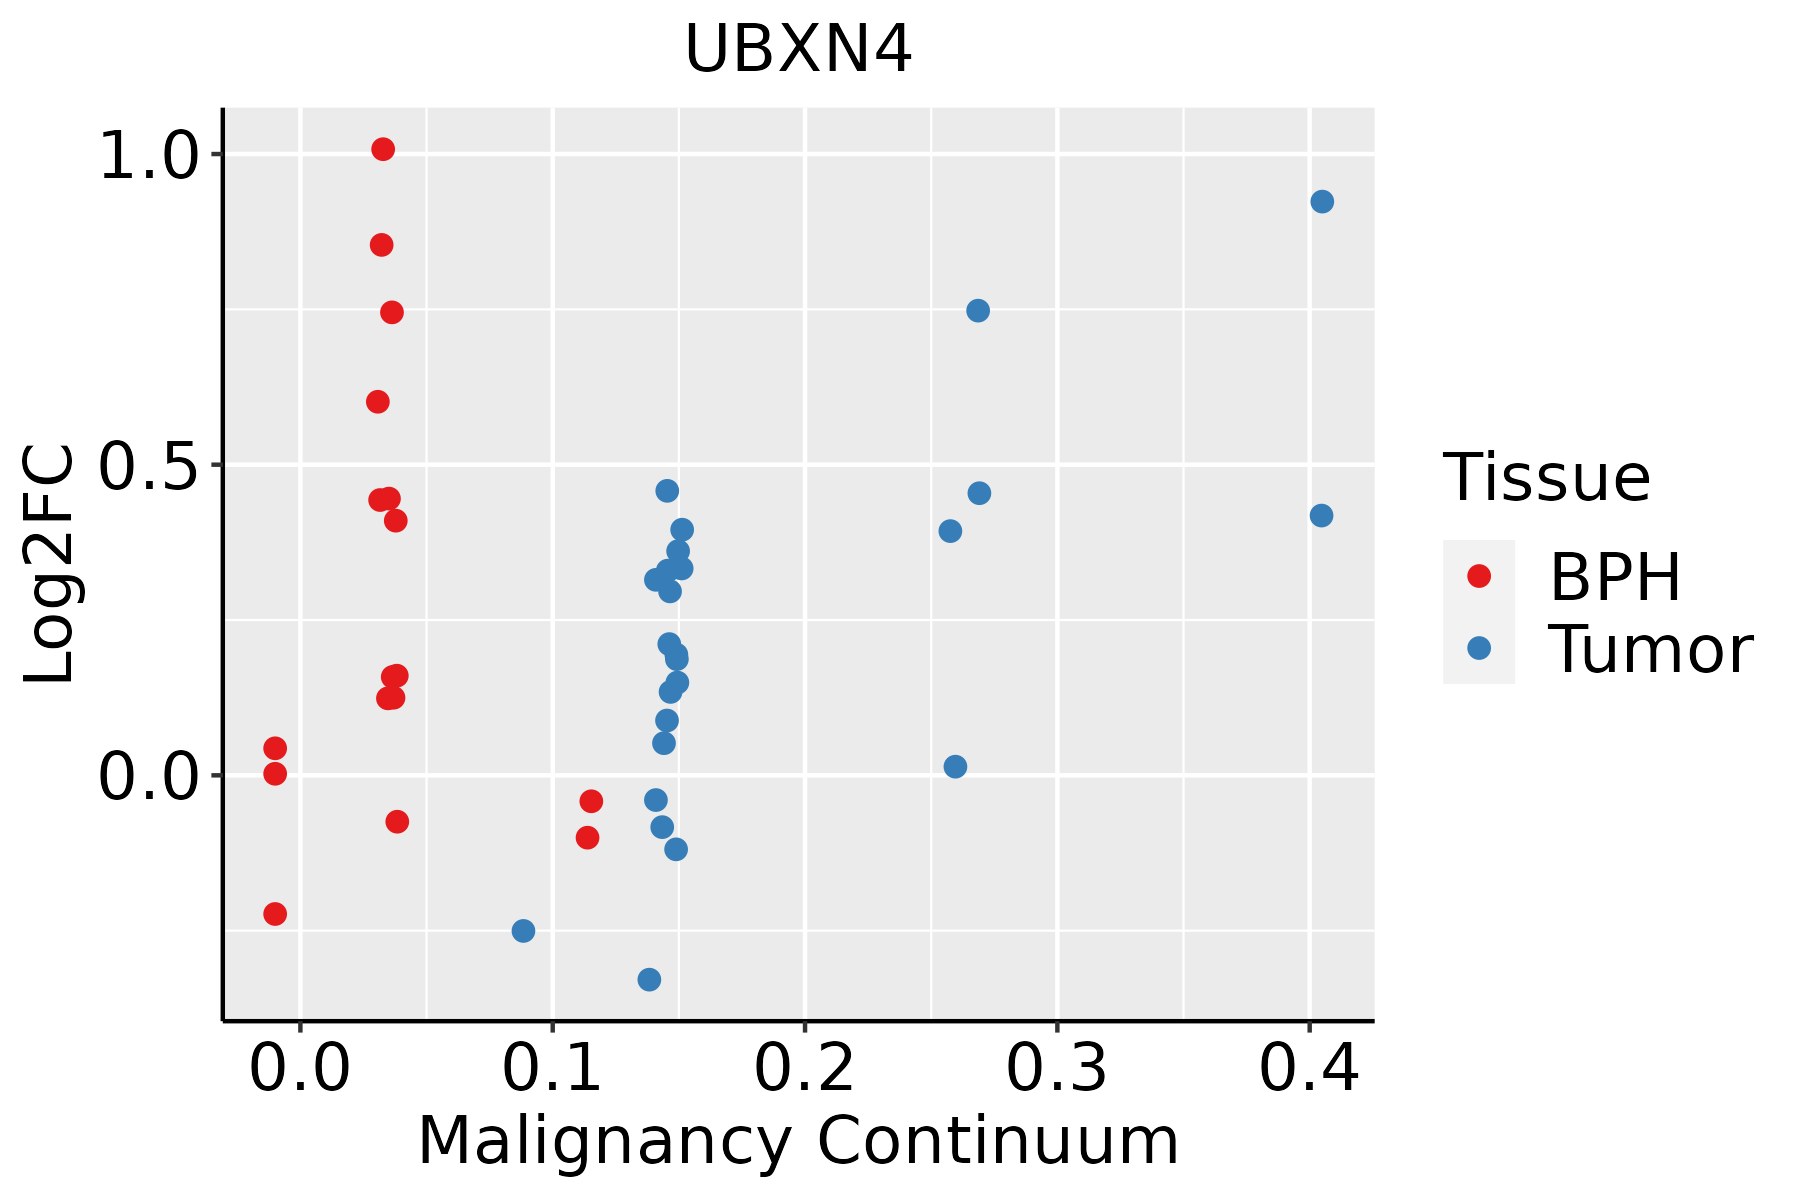 | BPH: Benign Prostatic Hyperplasia |
| Skin |  | AK: Actinic keratosis |
| cSCC: Cutaneous squamous cell carcinoma | ||
| SCCIS:squamous cell carcinoma in situ | ||
| Thyroid |  | ATC: Anaplastic thyroid cancer |
| HT: Hashimoto's thyroiditis | ||
| PTC: Papillary thyroid cancer |
| ∗log2FC in expression of this searched gene in stem-like cells from each diseased tissue sample relative to stem-like cells in normal samples in each tissue plotted against the malignancy continuum. Samples are colored based on if they are from different disease stage. |
Top |
Malignant transformation related pathway analysis |
| Find out the enriched GO biological processes and KEGG pathways involved in transition from healthy to precancer to cancer |
| Tissue | Disease Stage | Enriched GO biological Processes |
| Colorectum | AD |  |
| Colorectum | SER |  |
| Colorectum | MSS |  |
| Colorectum | MSI-H |  |
| Colorectum | FAP |  |
| ∗Top 15 enriched GO BP terms are showed in the bar plot of each disease state in each tissue. Each row represents a significant GO biological process which is colored according to the -log10(p.adjust). |
| Page: 1 2 3 4 5 6 7 8 9 |
| GO ID | Tissue | Disease Stage | Description | Gene Ratio | Bg Ratio | pvalue | p.adjust | Count |
| GO:0010498 | Colorectum | AD | proteasomal protein catabolic process | 174/3918 | 490/18723 | 3.18e-14 | 7.66e-12 | 174 |
| GO:0043161 | Colorectum | AD | proteasome-mediated ubiquitin-dependent protein catabolic process | 141/3918 | 412/18723 | 1.77e-10 | 1.68e-08 | 141 |
| GO:0034976 | Colorectum | AD | response to endoplasmic reticulum stress | 90/3918 | 256/18723 | 8.48e-08 | 4.28e-06 | 90 |
| GO:0035966 | Colorectum | AD | response to topologically incorrect protein | 54/3918 | 159/18723 | 8.85e-05 | 1.36e-03 | 54 |
| GO:0006986 | Colorectum | AD | response to unfolded protein | 45/3918 | 137/18723 | 7.43e-04 | 7.48e-03 | 45 |
| GO:0036503 | Colorectum | AD | ERAD pathway | 34/3918 | 107/18723 | 5.57e-03 | 3.63e-02 | 34 |
| GO:00104983 | Colorectum | MSI-H | proteasomal protein catabolic process | 71/1319 | 490/18723 | 4.67e-09 | 6.03e-07 | 71 |
| GO:00069863 | Colorectum | MSI-H | response to unfolded protein | 27/1319 | 137/18723 | 9.18e-07 | 6.54e-05 | 27 |
| GO:00359663 | Colorectum | MSI-H | response to topologically incorrect protein | 29/1319 | 159/18723 | 1.95e-06 | 1.24e-04 | 29 |
| GO:00349763 | Colorectum | MSI-H | response to endoplasmic reticulum stress | 39/1319 | 256/18723 | 4.12e-06 | 2.20e-04 | 39 |
| GO:00431613 | Colorectum | MSI-H | proteasome-mediated ubiquitin-dependent protein catabolic process | 53/1319 | 412/18723 | 1.51e-05 | 6.62e-04 | 53 |
| GO:00431614 | Colorectum | FAP | proteasome-mediated ubiquitin-dependent protein catabolic process | 98/2622 | 412/18723 | 5.41e-08 | 4.20e-06 | 98 |
| GO:00104984 | Colorectum | FAP | proteasomal protein catabolic process | 110/2622 | 490/18723 | 2.12e-07 | 1.26e-05 | 110 |
| GO:00349764 | Colorectum | FAP | response to endoplasmic reticulum stress | 61/2622 | 256/18723 | 1.58e-05 | 4.10e-04 | 61 |
| GO:00431615 | Colorectum | CRC | proteasome-mediated ubiquitin-dependent protein catabolic process | 69/2078 | 412/18723 | 3.16e-04 | 4.90e-03 | 69 |
| GO:00104985 | Colorectum | CRC | proteasomal protein catabolic process | 77/2078 | 490/18723 | 1.03e-03 | 1.21e-02 | 77 |
| GO:001049816 | Endometrium | AEH | proteasomal protein catabolic process | 108/2100 | 490/18723 | 2.73e-12 | 4.67e-10 | 108 |
| GO:004316116 | Endometrium | AEH | proteasome-mediated ubiquitin-dependent protein catabolic process | 88/2100 | 412/18723 | 1.54e-09 | 1.36e-07 | 88 |
| GO:003497616 | Endometrium | AEH | response to endoplasmic reticulum stress | 62/2100 | 256/18723 | 2.88e-09 | 2.13e-07 | 62 |
| GO:003596616 | Endometrium | AEH | response to topologically incorrect protein | 39/2100 | 159/18723 | 1.69e-06 | 5.23e-05 | 39 |
| Page: 1 2 3 4 5 6 7 |
| Pathway ID | Tissue | Disease Stage | Description | Gene Ratio | Bg Ratio | pvalue | p.adjust | qvalue | Count |
| hsa04141 | Colorectum | AD | Protein processing in endoplasmic reticulum | 80/2092 | 174/8465 | 5.96e-10 | 1.25e-08 | 7.96e-09 | 80 |
| hsa041411 | Colorectum | AD | Protein processing in endoplasmic reticulum | 80/2092 | 174/8465 | 5.96e-10 | 1.25e-08 | 7.96e-09 | 80 |
| hsa041416 | Colorectum | MSI-H | Protein processing in endoplasmic reticulum | 46/797 | 174/8465 | 4.53e-11 | 9.78e-10 | 8.19e-10 | 46 |
| hsa041417 | Colorectum | MSI-H | Protein processing in endoplasmic reticulum | 46/797 | 174/8465 | 4.53e-11 | 9.78e-10 | 8.19e-10 | 46 |
| hsa041418 | Colorectum | FAP | Protein processing in endoplasmic reticulum | 50/1404 | 174/8465 | 3.64e-05 | 3.68e-04 | 2.24e-04 | 50 |
| hsa041419 | Colorectum | FAP | Protein processing in endoplasmic reticulum | 50/1404 | 174/8465 | 3.64e-05 | 3.68e-04 | 2.24e-04 | 50 |
| hsa0414126 | Endometrium | AEH | Protein processing in endoplasmic reticulum | 62/1197 | 174/8465 | 5.97e-13 | 1.39e-11 | 1.01e-11 | 62 |
| hsa04141111 | Endometrium | AEH | Protein processing in endoplasmic reticulum | 62/1197 | 174/8465 | 5.97e-13 | 1.39e-11 | 1.01e-11 | 62 |
| hsa0414127 | Endometrium | EEC | Protein processing in endoplasmic reticulum | 64/1237 | 174/8465 | 2.17e-13 | 5.09e-12 | 3.80e-12 | 64 |
| hsa0414136 | Endometrium | EEC | Protein processing in endoplasmic reticulum | 64/1237 | 174/8465 | 2.17e-13 | 5.09e-12 | 3.80e-12 | 64 |
| hsa0414139 | Esophagus | HGIN | Protein processing in endoplasmic reticulum | 67/1383 | 174/8465 | 1.06e-12 | 2.16e-11 | 1.72e-11 | 67 |
| hsa04141114 | Esophagus | HGIN | Protein processing in endoplasmic reticulum | 67/1383 | 174/8465 | 1.06e-12 | 2.16e-11 | 1.72e-11 | 67 |
| hsa04141211 | Esophagus | ESCC | Protein processing in endoplasmic reticulum | 147/4205 | 174/8465 | 3.29e-22 | 1.10e-19 | 5.64e-20 | 147 |
| hsa04141310 | Esophagus | ESCC | Protein processing in endoplasmic reticulum | 147/4205 | 174/8465 | 3.29e-22 | 1.10e-19 | 5.64e-20 | 147 |
| hsa0414114 | Liver | Cirrhotic | Protein processing in endoplasmic reticulum | 114/2530 | 174/8465 | 1.16e-22 | 9.67e-21 | 5.96e-21 | 114 |
| hsa0414115 | Liver | Cirrhotic | Protein processing in endoplasmic reticulum | 114/2530 | 174/8465 | 1.16e-22 | 9.67e-21 | 5.96e-21 | 114 |
| hsa0414122 | Liver | HCC | Protein processing in endoplasmic reticulum | 146/4020 | 174/8465 | 7.34e-24 | 2.46e-21 | 1.37e-21 | 146 |
| hsa0414132 | Liver | HCC | Protein processing in endoplasmic reticulum | 146/4020 | 174/8465 | 7.34e-24 | 2.46e-21 | 1.37e-21 | 146 |
| hsa0414116 | Lung | IAC | Protein processing in endoplasmic reticulum | 37/1053 | 174/8465 | 6.53e-04 | 5.73e-03 | 3.81e-03 | 37 |
| hsa0414117 | Lung | IAC | Protein processing in endoplasmic reticulum | 37/1053 | 174/8465 | 6.53e-04 | 5.73e-03 | 3.81e-03 | 37 |
| Page: 1 2 |
Top |
Cell-cell communication analysis |
| Identification of potential cell-cell interactions between two cell types and their ligand-receptor pairs for different disease states |
| Ligand | Receptor | LRpair | Pathway | Tissue | Disease Stage |
| Page: 1 |
Top |
Single-cell gene regulatory network inference analysis |
| Find out the significant the regulons (TFs) and the target genes of each regulon across cell types for different disease states |
| TF | Cell Type | Tissue | Disease Stage | Target Gene | RSS | Regulon Activity |
| ∗The dot plots of a searched regulon are shown for all cell subpopulations in each disease state of each tissue based on the regulon specific score inferred using pySCENIC and by calculating the average expression. |
| Page: 1 |
Top |
Somatic mutation of malignant transformation related genes |
| Annotation of somatic variants for genes involved in malignant transformation |
| Hugo Symbol | Variant Class | Variant Classification | dbSNP RS | HGVSc | HGVSp | HGVSp Short | SWISSPROT | BIOTYPE | SIFT | PolyPhen | Tumor Sample Barcode | Tissue | Histology | Sex | Age | Stage | Therapy Types | Drugs | Outcome |
| UBXN4 | SNV | Missense_Mutation | novel | c.451N>C | p.Asn151His | p.N151H | Q92575 | protein_coding | tolerated(0.13) | benign(0.188) | TCGA-A7-A4SA-01 | Breast | breast invasive carcinoma | Female | <65 | I/II | Chemotherapy | doxorubicin | CR |
| UBXN4 | SNV | Missense_Mutation | c.567G>C | p.Gln189His | p.Q189H | Q92575 | protein_coding | tolerated(0.09) | benign(0.078) | TCGA-A8-A0A9-01 | Breast | breast invasive carcinoma | Female | >=65 | I/II | Hormone Therapy | anastrozole | SD | |
| UBXN4 | SNV | Missense_Mutation | novel | c.293N>A | p.Ser98Tyr | p.S98Y | Q92575 | protein_coding | deleterious(0) | possibly_damaging(0.553) | TCGA-AN-A046-01 | Breast | breast invasive carcinoma | Female | >=65 | I/II | Unknown | Unknown | SD |
| UBXN4 | SNV | Missense_Mutation | novel | c.79N>C | p.Ala27Pro | p.A27P | Q92575 | protein_coding | deleterious(0.05) | benign(0.445) | TCGA-DS-A1OD-01 | Cervix | cervical & endocervical cancer | Female | <65 | I/II | Chemotherapy | cisplatin | SD |
| UBXN4 | SNV | Missense_Mutation | c.25N>T | p.Pro9Ser | p.P9S | Q92575 | protein_coding | deleterious(0.02) | possibly_damaging(0.448) | TCGA-IR-A3LH-01 | Cervix | cervical & endocervical cancer | Female | <65 | I/II | Chemotherapy | cisplatin | CR | |
| UBXN4 | SNV | Missense_Mutation | c.1472N>G | p.Asp491Gly | p.D491G | Q92575 | protein_coding | tolerated(0.07) | possibly_damaging(0.613) | TCGA-JW-A5VI-01 | Cervix | cervical & endocervical cancer | Female | <65 | I/II | Chemotherapy | topotecan | PD | |
| UBXN4 | SNV | Missense_Mutation | novel | c.719G>C | p.Arg240Thr | p.R240T | Q92575 | protein_coding | deleterious(0.04) | possibly_damaging(0.522) | TCGA-PN-A8MA-01 | Cervix | cervical & endocervical cancer | Female | <65 | I/II | Chemotherapy | cisplatin | SD |
| UBXN4 | insertion | Frame_Shift_Ins | novel | c.78_79insCC | p.Ala27ProfsTer49 | p.A27Pfs*49 | Q92575 | protein_coding | TCGA-DS-A1OD-01 | Cervix | cervical & endocervical cancer | Female | <65 | I/II | Chemotherapy | cisplatin | SD | ||
| UBXN4 | SNV | Missense_Mutation | c.1033N>T | p.Ala345Ser | p.A345S | Q92575 | protein_coding | deleterious(0.01) | possibly_damaging(0.875) | TCGA-AA-3681-01 | Colorectum | colon adenocarcinoma | Female | >=65 | III/IV | Unknown | Unknown | SD | |
| UBXN4 | SNV | Missense_Mutation | c.1166C>T | p.Ala389Val | p.A389V | Q92575 | protein_coding | deleterious(0) | probably_damaging(0.999) | TCGA-AA-3864-01 | Colorectum | colon adenocarcinoma | Male | >=65 | I/II | Unknown | Unknown | SD |
| Page: 1 2 3 4 5 6 |
Top |
Related drugs of malignant transformation related genes |
| Identification of chemicals and drugs interact with genes involved in malignant transfromation |
| (DGIdb 4.0) |
| Entrez ID | Symbol | Category | Interaction Types | Drug Claim Name | Drug Name | PMIDs |
| Page: 1 |

Copyright 2023-Present -The University of Texas Health Science Center at Houston |