| Tissue | Expression Dynamics | Abbreviation |
| Cervix | 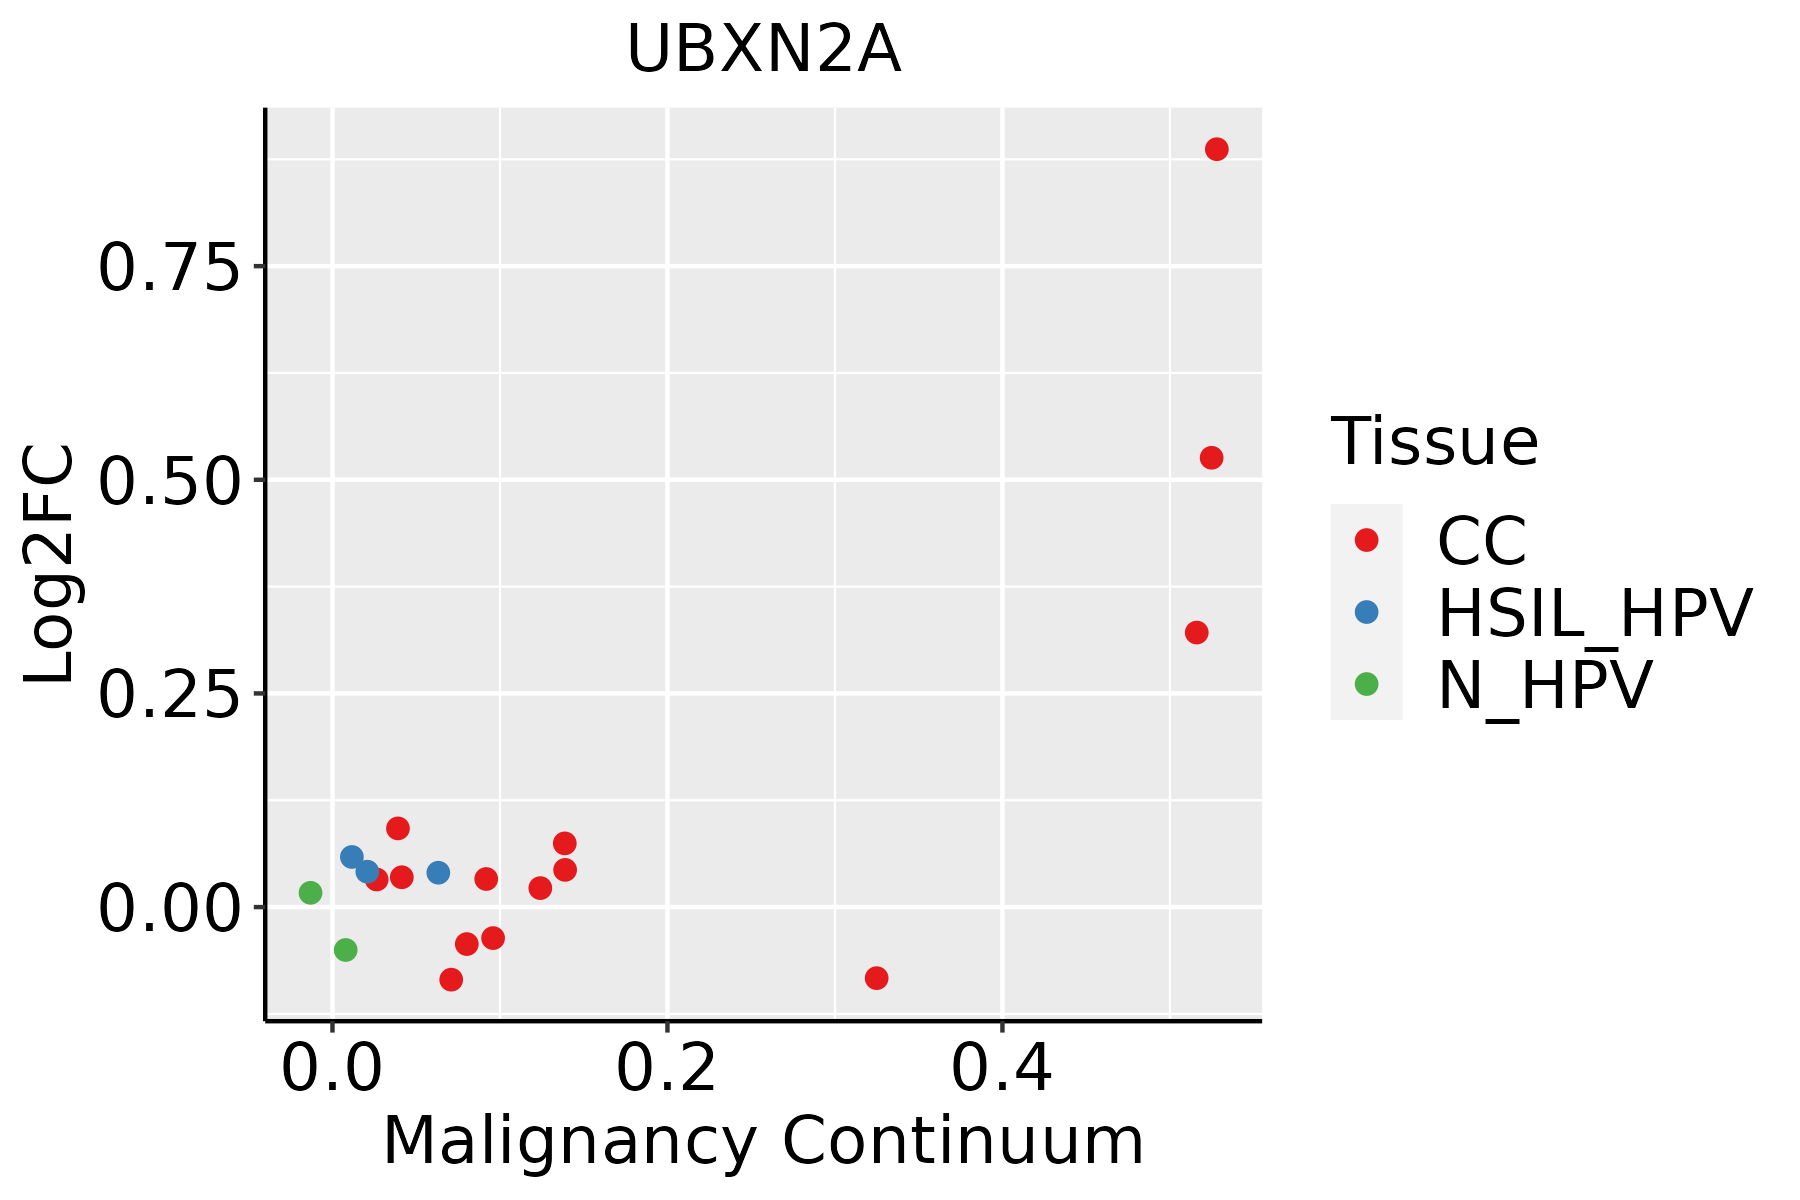 | CC: Cervix cancer |
| HSIL_HPV: HPV-infected high-grade squamous intraepithelial lesions |
| N_HPV: HPV-infected normal cervix |
| Esophagus |  | ESCC: Esophageal squamous cell carcinoma |
| HGIN: High-grade intraepithelial neoplasias |
| LGIN: Low-grade intraepithelial neoplasias |
| Liver | 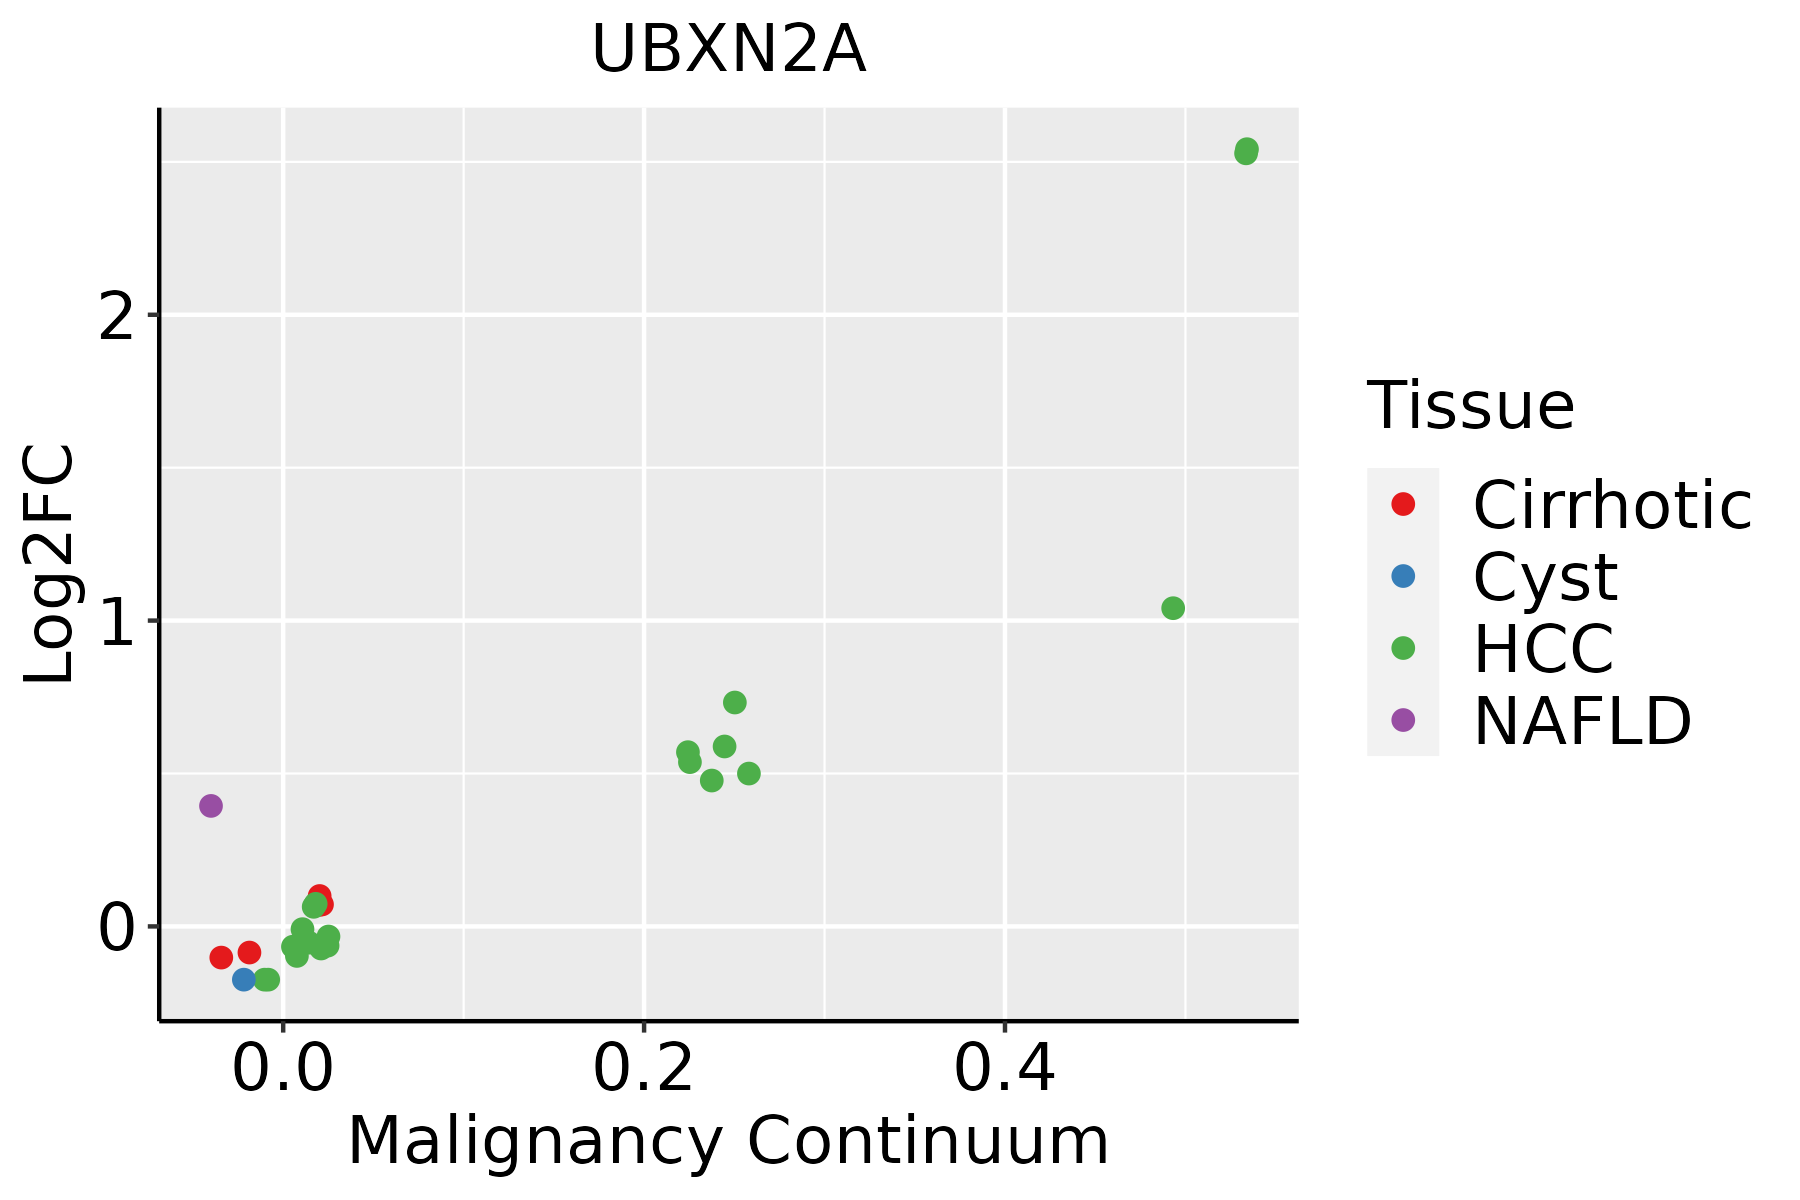 | HCC: Hepatocellular carcinoma |
| NAFLD: Non-alcoholic fatty liver disease |
| Oral Cavity |  | EOLP: Erosive Oral lichen planus |
| LP: leukoplakia |
| NEOLP: Non-erosive oral lichen planus |
| OSCC: Oral squamous cell carcinoma |
| Skin | 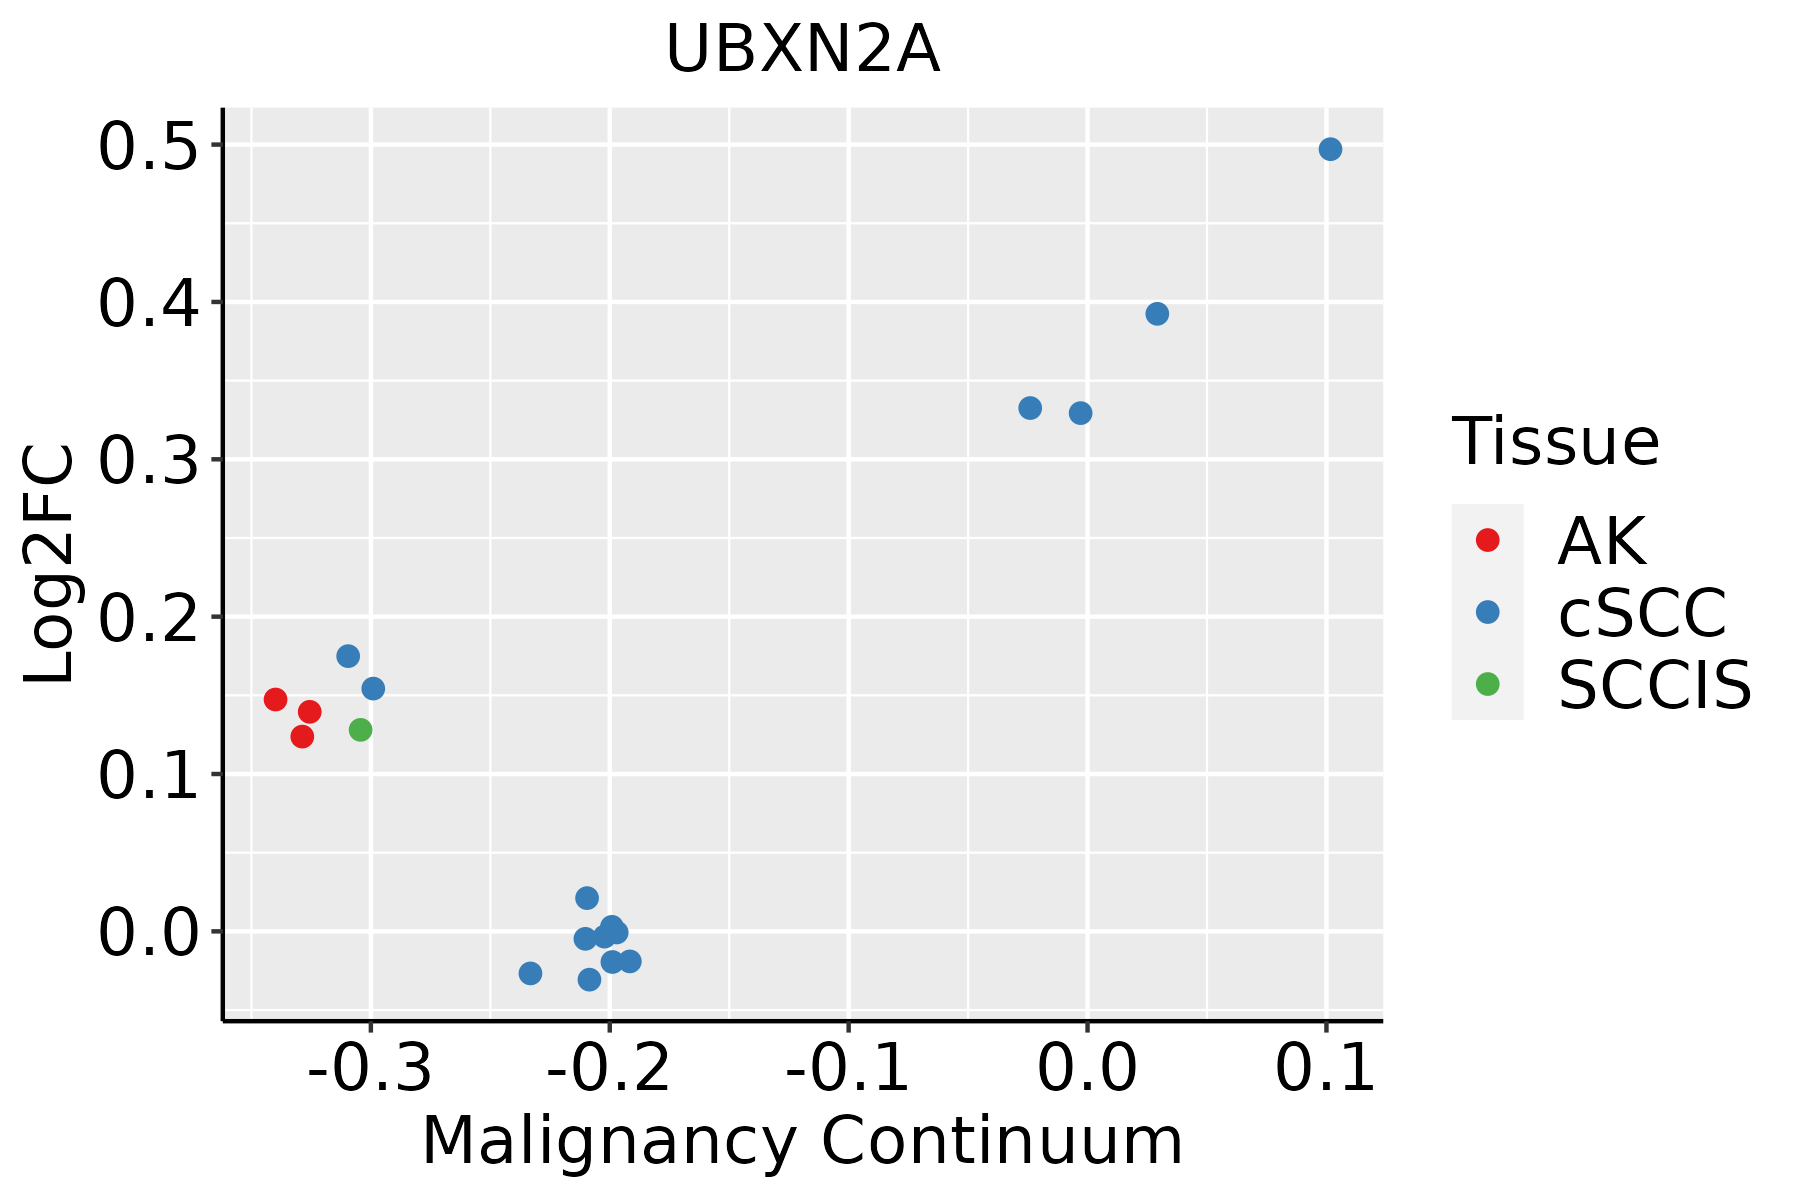 | AK: Actinic keratosis |
| cSCC: Cutaneous squamous cell carcinoma |
| SCCIS:squamous cell carcinoma in situ |
| Thyroid | 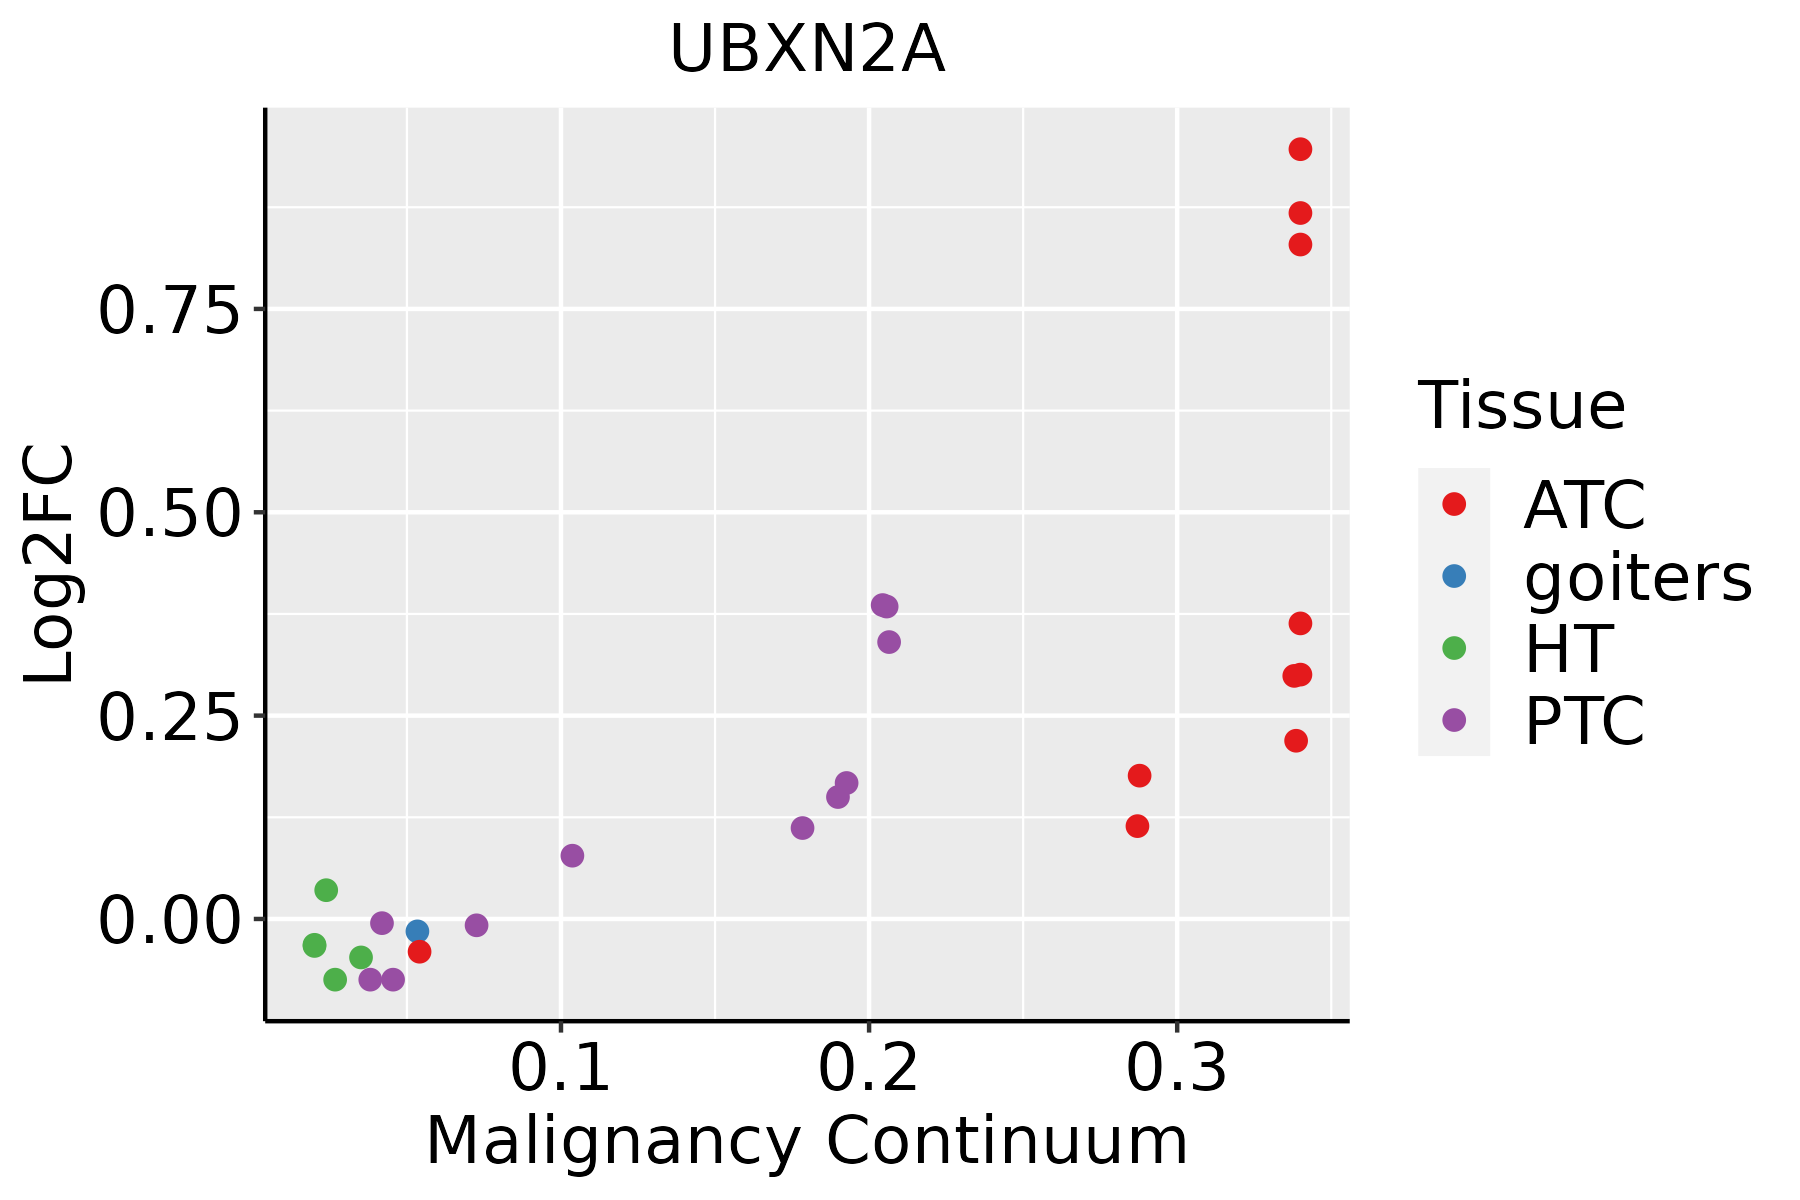 | ATC: Anaplastic thyroid cancer |
| HT: Hashimoto's thyroiditis |
| PTC: Papillary thyroid cancer |
| GO ID | Tissue | Disease Stage | Description | Gene Ratio | Bg Ratio | pvalue | p.adjust | Count |
| GO:004217610 | Cervix | CC | regulation of protein catabolic process | 104/2311 | 391/18723 | 9.39e-15 | 9.36e-12 | 104 |
| GO:001049810 | Cervix | CC | proteasomal protein catabolic process | 111/2311 | 490/18723 | 8.98e-11 | 1.58e-08 | 111 |
| GO:190332010 | Cervix | CC | regulation of protein modification by small protein conjugation or removal | 66/2311 | 242/18723 | 2.31e-10 | 3.46e-08 | 66 |
| GO:003139610 | Cervix | CC | regulation of protein ubiquitination | 59/2311 | 210/18723 | 5.90e-10 | 7.51e-08 | 59 |
| GO:004316110 | Cervix | CC | proteasome-mediated ubiquitin-dependent protein catabolic process | 91/2311 | 412/18723 | 1.65e-08 | 1.25e-06 | 91 |
| GO:00162367 | Cervix | CC | macroautophagy | 58/2311 | 291/18723 | 1.40e-04 | 1.70e-03 | 58 |
| GO:19908234 | Cervix | CC | response to leukemia inhibitory factor | 22/2311 | 95/18723 | 2.40e-03 | 1.70e-02 | 22 |
| GO:00070304 | Cervix | CC | Golgi organization | 32/2311 | 157/18723 | 2.78e-03 | 1.87e-02 | 32 |
| GO:19908304 | Cervix | CC | cellular response to leukemia inhibitory factor | 21/2311 | 94/18723 | 4.68e-03 | 2.82e-02 | 21 |
| GO:00000452 | Cervix | CC | autophagosome assembly | 21/2311 | 99/18723 | 8.67e-03 | 4.46e-02 | 21 |
| GO:004217627 | Esophagus | HGIN | regulation of protein catabolic process | 119/2587 | 391/18723 | 8.09e-18 | 2.43e-15 | 119 |
| GO:001049826 | Esophagus | HGIN | proteasomal protein catabolic process | 139/2587 | 490/18723 | 1.20e-17 | 3.41e-15 | 139 |
| GO:004316126 | Esophagus | HGIN | proteasome-mediated ubiquitin-dependent protein catabolic process | 114/2587 | 412/18723 | 7.00e-14 | 1.20e-11 | 114 |
| GO:190332027 | Esophagus | HGIN | regulation of protein modification by small protein conjugation or removal | 78/2587 | 242/18723 | 1.40e-13 | 2.26e-11 | 78 |
| GO:003139627 | Esophagus | HGIN | regulation of protein ubiquitination | 64/2587 | 210/18723 | 3.02e-10 | 2.71e-08 | 64 |
| GO:001623616 | Esophagus | HGIN | macroautophagy | 77/2587 | 291/18723 | 7.15e-09 | 4.61e-07 | 77 |
| GO:00070336 | Esophagus | HGIN | vacuole organization | 44/2587 | 180/18723 | 8.97e-05 | 1.96e-03 | 44 |
| GO:00069975 | Esophagus | HGIN | nucleus organization | 34/2587 | 133/18723 | 2.20e-04 | 4.00e-03 | 34 |
| GO:19050375 | Esophagus | HGIN | autophagosome organization | 28/2587 | 103/18723 | 2.58e-04 | 4.53e-03 | 28 |
| GO:00000455 | Esophagus | HGIN | autophagosome assembly | 26/2587 | 99/18723 | 7.45e-04 | 9.90e-03 | 26 |
| Pathway ID | Tissue | Disease Stage | Description | Gene Ratio | Bg Ratio | pvalue | p.adjust | qvalue | Count |
| hsa0414120 | Cervix | CC | Protein processing in endoplasmic reticulum | 55/1267 | 174/8465 | 1.74e-08 | 2.68e-07 | 1.58e-07 | 55 |
| hsa04141110 | Cervix | CC | Protein processing in endoplasmic reticulum | 55/1267 | 174/8465 | 1.74e-08 | 2.68e-07 | 1.58e-07 | 55 |
| hsa0414139 | Esophagus | HGIN | Protein processing in endoplasmic reticulum | 67/1383 | 174/8465 | 1.06e-12 | 2.16e-11 | 1.72e-11 | 67 |
| hsa04141114 | Esophagus | HGIN | Protein processing in endoplasmic reticulum | 67/1383 | 174/8465 | 1.06e-12 | 2.16e-11 | 1.72e-11 | 67 |
| hsa04141211 | Esophagus | ESCC | Protein processing in endoplasmic reticulum | 147/4205 | 174/8465 | 3.29e-22 | 1.10e-19 | 5.64e-20 | 147 |
| hsa04141310 | Esophagus | ESCC | Protein processing in endoplasmic reticulum | 147/4205 | 174/8465 | 3.29e-22 | 1.10e-19 | 5.64e-20 | 147 |
| hsa0414114 | Liver | Cirrhotic | Protein processing in endoplasmic reticulum | 114/2530 | 174/8465 | 1.16e-22 | 9.67e-21 | 5.96e-21 | 114 |
| hsa0414115 | Liver | Cirrhotic | Protein processing in endoplasmic reticulum | 114/2530 | 174/8465 | 1.16e-22 | 9.67e-21 | 5.96e-21 | 114 |
| hsa0414122 | Liver | HCC | Protein processing in endoplasmic reticulum | 146/4020 | 174/8465 | 7.34e-24 | 2.46e-21 | 1.37e-21 | 146 |
| hsa0414132 | Liver | HCC | Protein processing in endoplasmic reticulum | 146/4020 | 174/8465 | 7.34e-24 | 2.46e-21 | 1.37e-21 | 146 |
| hsa0414130 | Oral cavity | OSCC | Protein processing in endoplasmic reticulum | 143/3704 | 174/8465 | 6.82e-26 | 2.28e-23 | 1.16e-23 | 143 |
| hsa04141113 | Oral cavity | OSCC | Protein processing in endoplasmic reticulum | 143/3704 | 174/8465 | 6.82e-26 | 2.28e-23 | 1.16e-23 | 143 |
| hsa0414145 | Oral cavity | EOLP | Protein processing in endoplasmic reticulum | 70/1218 | 174/8465 | 2.84e-17 | 3.06e-15 | 1.81e-15 | 70 |
| hsa0414155 | Oral cavity | EOLP | Protein processing in endoplasmic reticulum | 70/1218 | 174/8465 | 2.84e-17 | 3.06e-15 | 1.81e-15 | 70 |
| hsa0414162 | Oral cavity | NEOLP | Protein processing in endoplasmic reticulum | 49/1112 | 174/8465 | 9.02e-08 | 1.37e-06 | 8.59e-07 | 49 |
| hsa0414172 | Oral cavity | NEOLP | Protein processing in endoplasmic reticulum | 49/1112 | 174/8465 | 9.02e-08 | 1.37e-06 | 8.59e-07 | 49 |
| Hugo Symbol | Variant Class | Variant Classification | dbSNP RS | HGVSc | HGVSp | HGVSp Short | SWISSPROT | BIOTYPE | SIFT | PolyPhen | Tumor Sample Barcode | Tissue | Histology | Sex | Age | Stage | Therapy Types | Drugs | Outcome |
| UBXN2A | SNV | Missense_Mutation | novel | c.34N>A | p.Glu12Lys | p.E12K | P68543 | protein_coding | tolerated(0.22) | benign(0.001) | TCGA-5L-AAT0-01 | Breast | breast invasive carcinoma | Female | <65 | I/II | Hormone Therapy | tamoxiphen | SD |
| UBXN2A | SNV | Missense_Mutation | novel | c.301N>A | p.Glu101Lys | p.E101K | P68543 | protein_coding | deleterious(0.01) | probably_damaging(0.952) | TCGA-A2-A0CR-01 | Breast | breast invasive carcinoma | Female | <65 | I/II | Chemotherapy | adriamycin | CR |
| UBXN2A | SNV | Missense_Mutation | | c.83A>G | p.Asn28Ser | p.N28S | P68543 | protein_coding | tolerated(0.82) | benign(0) | TCGA-AR-A250-01 | Breast | breast invasive carcinoma | Female | <65 | I/II | Chemotherapy | doxorubicin | SD |
| UBXN2A | insertion | In_Frame_Ins | novel | c.557_558insATCCTCCTGCCTCAGCCCCTCTAGTAGCTGGGA | p.Ile186_Val187insSerSerCysLeuSerProSerSerSerTrpAsp | p.I186_V187insSSCLSPSSSWD | P68543 | protein_coding | | | TCGA-AO-A0JB-01 | Breast | breast invasive carcinoma | Female | <65 | III/IV | Chemotherapy | cyclophosphamide | SD |
| UBXN2A | deletion | Frame_Shift_Del | | c.209delA | p.Asn70ThrfsTer21 | p.N70Tfs*21 | P68543 | protein_coding | | | TCGA-BH-A18G-01 | Breast | breast invasive carcinoma | Female | >=65 | I/II | Unknown | Unknown | SD |
| UBXN2A | SNV | Missense_Mutation | rs753336862 | c.703N>A | p.Glu235Lys | p.E235K | P68543 | protein_coding | deleterious(0) | probably_damaging(0.999) | TCGA-VS-A8EL-01 | Cervix | cervical & endocervical cancer | Female | <65 | I/II | Chemotherapy | cisplatin | CR |
| UBXN2A | SNV | Missense_Mutation | rs13386425 | c.220G>A | p.Val74Ile | p.V74I | P68543 | protein_coding | tolerated(0.09) | possibly_damaging(0.66) | TCGA-AA-3947-01 | Colorectum | colon adenocarcinoma | Female | <65 | I/II | Unknown | Unknown | SD |
| UBXN2A | SNV | Missense_Mutation | novel | c.626N>T | p.Ser209Phe | p.S209F | P68543 | protein_coding | tolerated(0.18) | benign(0.024) | TCGA-AA-A02R-01 | Colorectum | colon adenocarcinoma | Female | >=65 | I/II | Unknown | Unknown | PD |
| UBXN2A | insertion | Frame_Shift_Ins | rs780605417 | c.742_743insA | p.Thr250AsnfsTer5 | p.T250Nfs*5 | P68543 | protein_coding | | | TCGA-AA-3672-01 | Colorectum | colon adenocarcinoma | Female | >=65 | III/IV | Unknown | Unknown | SD |
| UBXN2A | SNV | Missense_Mutation | novel | c.512N>T | p.Glu171Val | p.E171V | P68543 | protein_coding | deleterious(0.03) | possibly_damaging(0.867) | TCGA-A5-A0G2-01 | Endometrium | uterine corpus endometrioid carcinoma | Female | <65 | III/IV | Unknown | Unknown | SD |


