Schematic overview of the cellular and molecular mechanisms involved in the cancer progression, including the proposed cellular and molecular mechanisms in cancer cells trajectory. AT1: alveolar type 1 cells; AT2: alveolar type 2 cells; AAH: atypical adenomatous hyperplasia; AIS: adenocarcinoma in situ; MIA: minimally invasive adenocarcinoma; IA: invasive adenocarcinoma; EMT: epithelial-mesenchymal transition

Home

Download

Statistics

Help

Contact

Center for Computational Systems Medicine
leaf

Gene summary

leaf

Malignant transformation analysis

leaf

Malignant transformation related pathway analysis

leaf

Cell-cell communication analysis

leaf

Single-cell gene regulatory network inference analysis

leaf

Somatic mutation of malignant transformation related genes

leaf

Related drugs of malignant transformation related genes

Gene: UBTF

Gene summary for UBTF

check button Gene summary.

Gene informationSpeciesHuman
Gene symbol

UBTF

Gene ID

7343

Gene nameupstream binding transcription factor
Gene AliasCONDBA
Cytomap17q21.31
Gene Typeprotein-coding
GO ID

GO:0001188

UniProtAcc

P17480


Top

Malignant transformation analysis

check button Identification of the aberrant gene expression in precancerous and cancerous lesions by comparing the gene expression of stem-like cells in diseased tissues with normal stem cells
check button Malignant transformation involving gene list.
Entrez IDSymbolReplicatesSpeciesOrganTissueAdj P-valueLog2FCMalignancy
7343UBTFLZE4THumanEsophagusESCC1.89e-183.99e-010.0811
7343UBTFLZE5THumanEsophagusESCC1.55e-042.75e-010.0514
7343UBTFLZE7THumanEsophagusESCC1.99e-023.37e-010.0667
7343UBTFLZE8THumanEsophagusESCC1.14e-082.07e-010.067
7343UBTFLZE20THumanEsophagusESCC7.30e-051.31e-010.0662
7343UBTFLZE22THumanEsophagusESCC2.28e-033.99e-010.068
7343UBTFLZE24THumanEsophagusESCC6.03e-155.29e-010.0596
7343UBTFP1T-EHumanEsophagusESCC2.22e-053.70e-010.0875
7343UBTFP2T-EHumanEsophagusESCC5.52e-488.17e-010.1177
7343UBTFP4T-EHumanEsophagusESCC4.65e-206.59e-010.1323
7343UBTFP5T-EHumanEsophagusESCC8.99e-255.14e-010.1327
7343UBTFP8T-EHumanEsophagusESCC9.20e-254.14e-010.0889
7343UBTFP9T-EHumanEsophagusESCC9.66e-083.34e-010.1131
7343UBTFP10T-EHumanEsophagusESCC3.32e-194.70e-010.116
7343UBTFP11T-EHumanEsophagusESCC1.20e-086.38e-010.1426
7343UBTFP12T-EHumanEsophagusESCC8.48e-387.11e-010.1122
7343UBTFP15T-EHumanEsophagusESCC3.78e-258.28e-010.1149
7343UBTFP16T-EHumanEsophagusESCC7.89e-285.13e-010.1153
7343UBTFP17T-EHumanEsophagusESCC4.70e-095.17e-010.1278
7343UBTFP19T-EHumanEsophagusESCC1.60e-055.81e-010.1662
Page: 1 2 3 4 5 6 7 

check button Transcriptomic changes along malignancy continuum.
TissueExpression DynamicsAbbreviation
EsophagusThe image shows the transcriptomic changes along malignancy continuum.log2FC in expression of this searched gene in stem-like cells from each diseased tissue sample relative to stem-like cells in normal samples in each tissue plotted against the malignancy continuum. Samples are colored based on if they are from different disease stage.ESCC: Esophageal squamous cell carcinoma
HGIN: High-grade intraepithelial neoplasias
LGIN: Low-grade intraepithelial neoplasias
LiverThe image shows the transcriptomic changes along malignancy continuum.log2FC in expression of this searched gene in stem-like cells from each diseased tissue sample relative to stem-like cells in normal samples in each tissue plotted against the malignancy continuum. Samples are colored based on if they are from different disease stage.HCC: Hepatocellular carcinoma
NAFLD: Non-alcoholic fatty liver disease
Oral CavityThe image shows the transcriptomic changes along malignancy continuum.log2FC in expression of this searched gene in stem-like cells from each diseased tissue sample relative to stem-like cells in normal samples in each tissue plotted against the malignancy continuum. Samples are colored based on if they are from different disease stage.
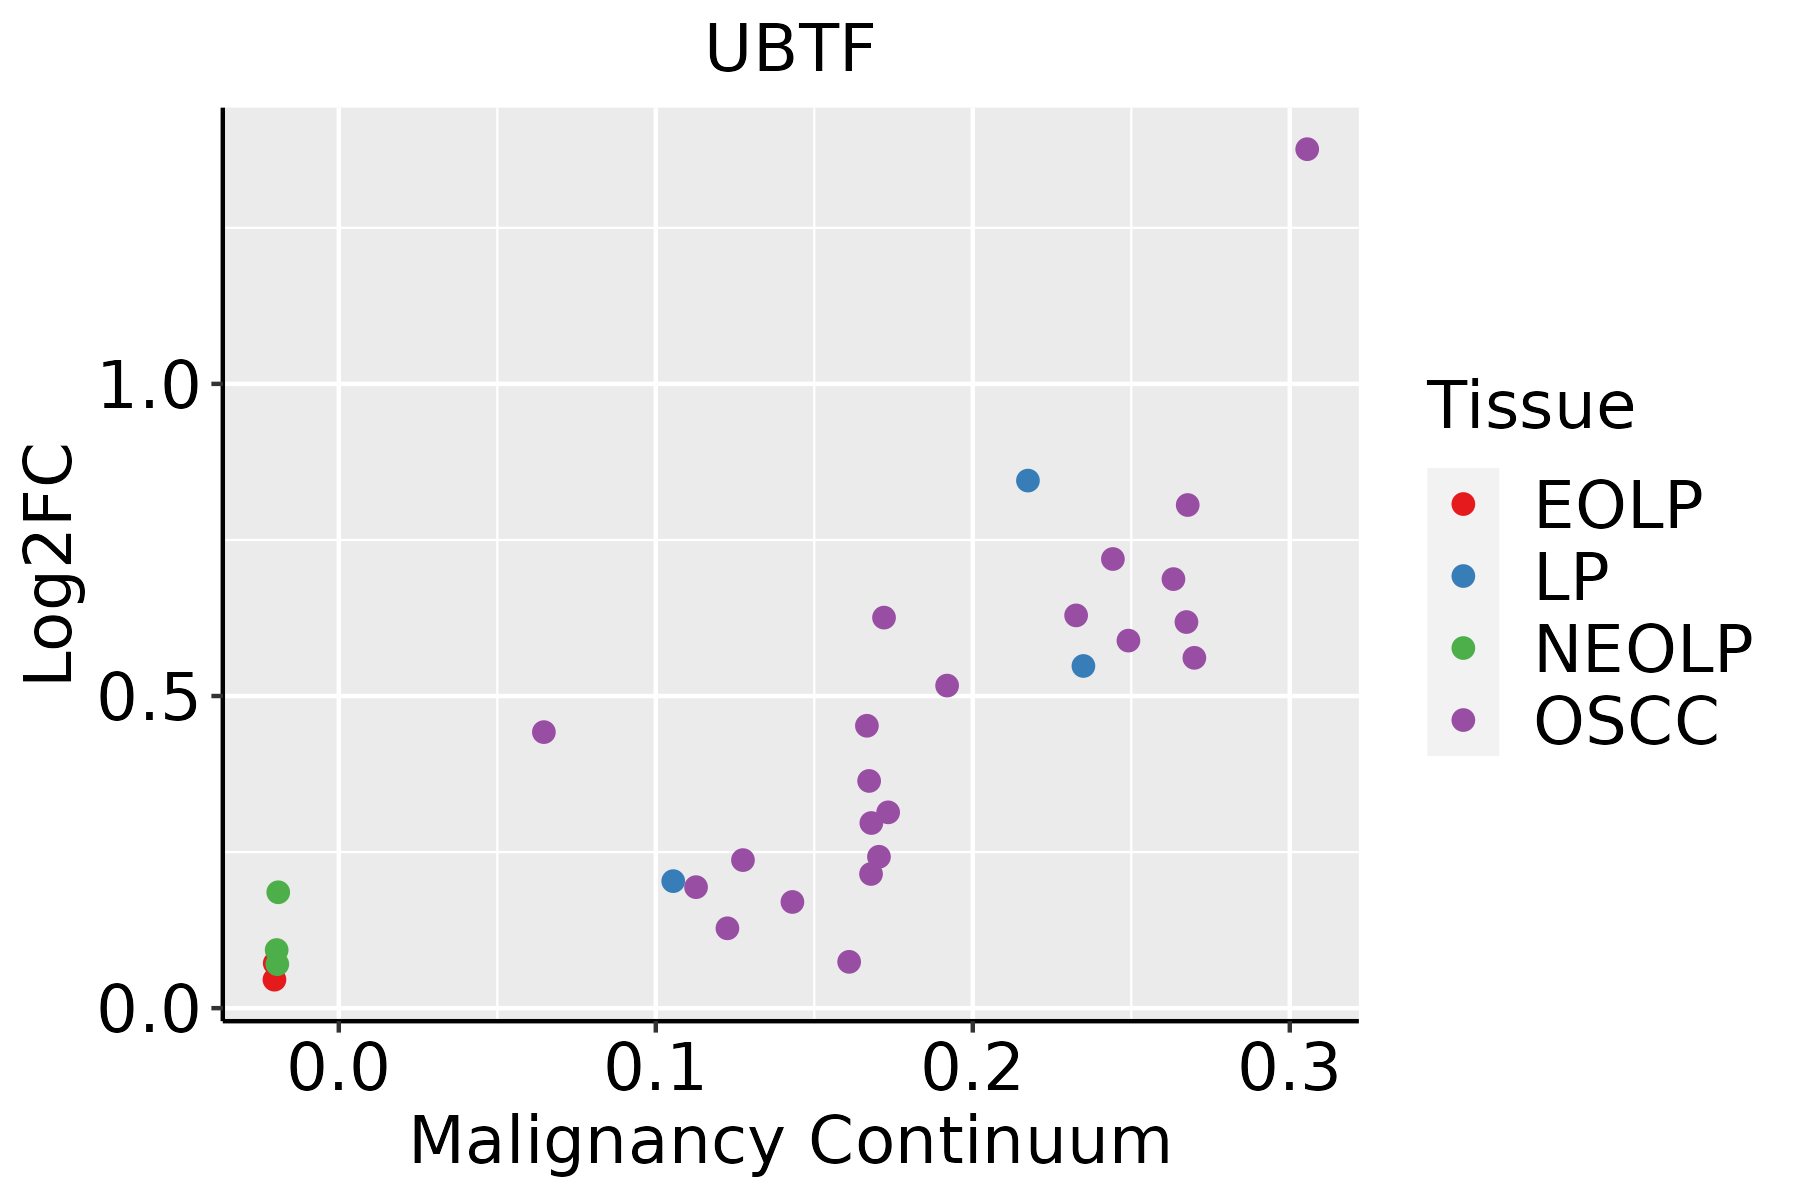
EOLP: Erosive Oral lichen planus
LP: leukoplakia
NEOLP: Non-erosive oral lichen planus
OSCC: Oral squamous cell carcinoma
ProstateThe image shows the transcriptomic changes along malignancy continuum.log2FC in expression of this searched gene in stem-like cells from each diseased tissue sample relative to stem-like cells in normal samples in each tissue plotted against the malignancy continuum. Samples are colored based on if they are from different disease stage.
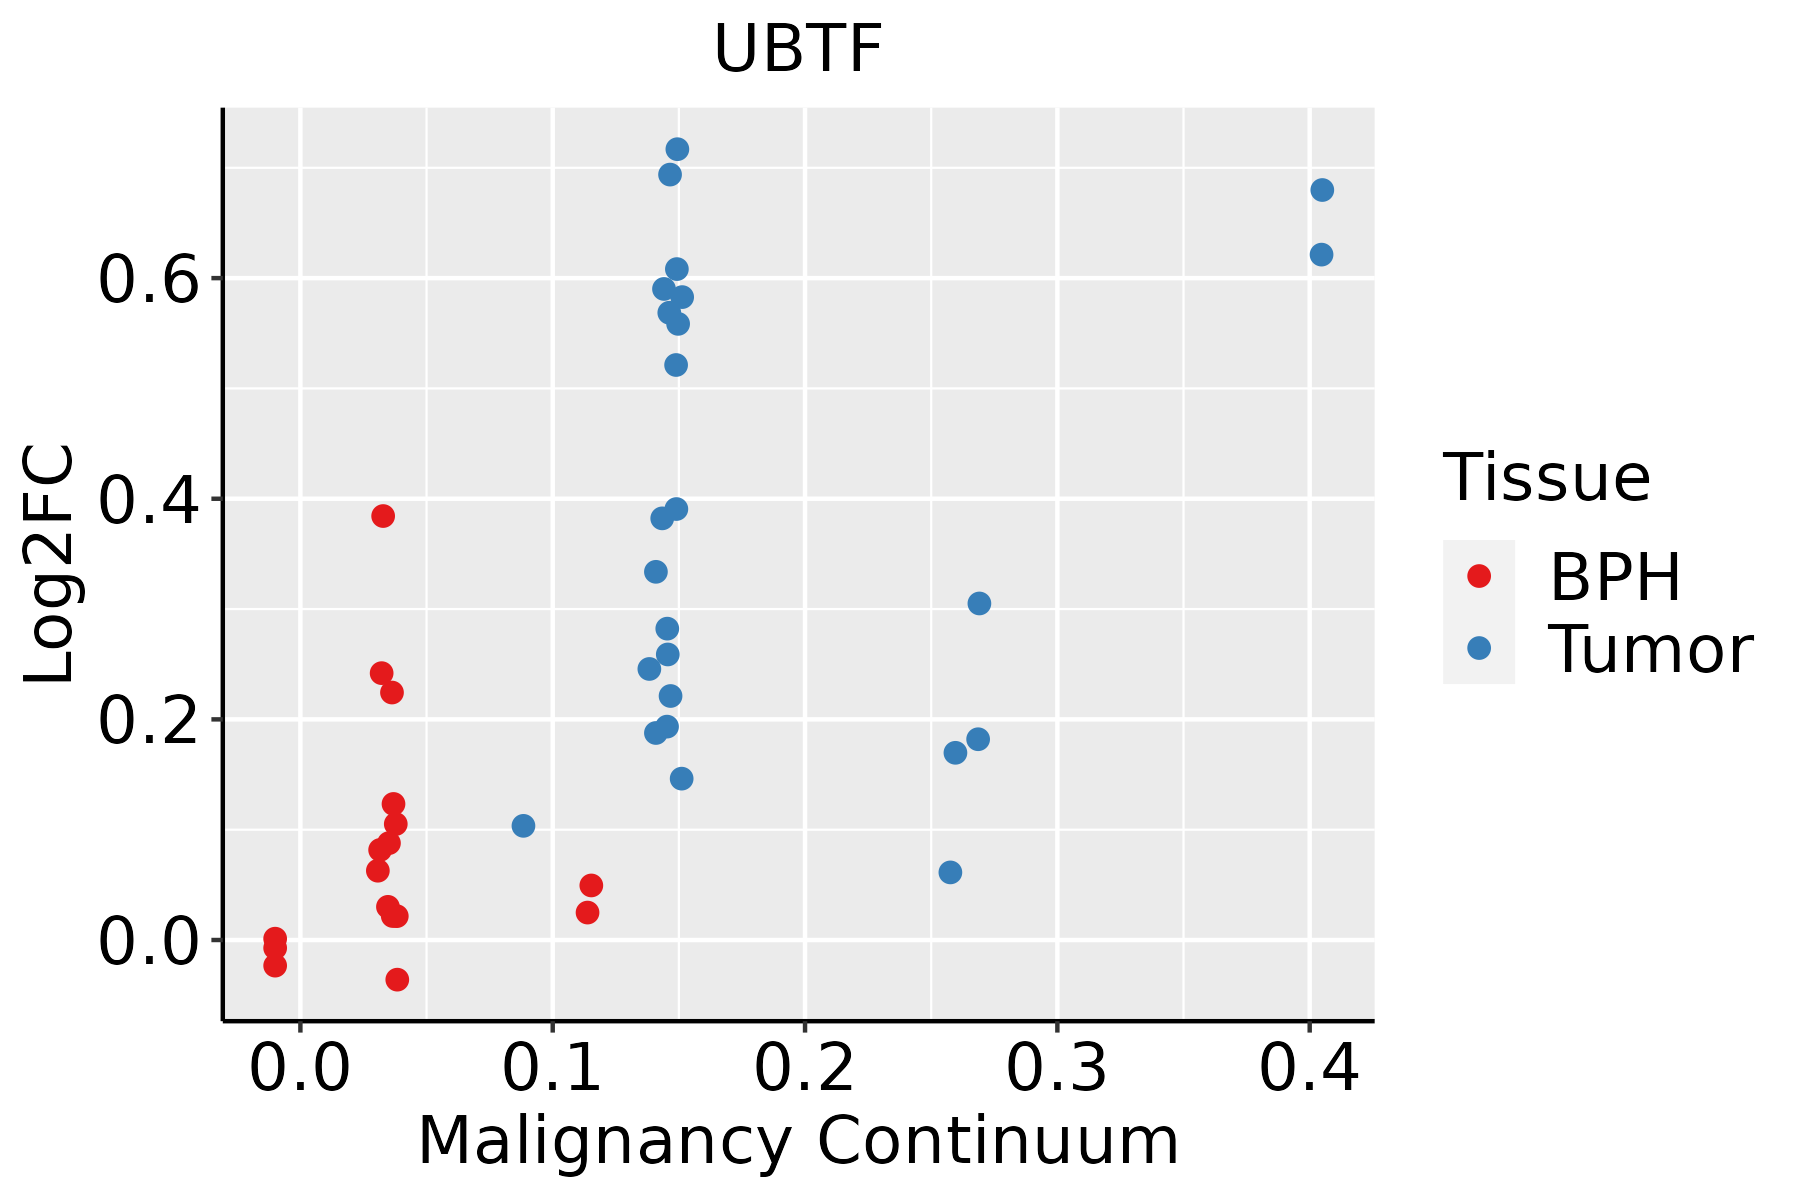
BPH: Benign Prostatic Hyperplasia
SkinThe image shows the transcriptomic changes along malignancy continuum.log2FC in expression of this searched gene in stem-like cells from each diseased tissue sample relative to stem-like cells in normal samples in each tissue plotted against the malignancy continuum. Samples are colored based on if they are from different disease stage.
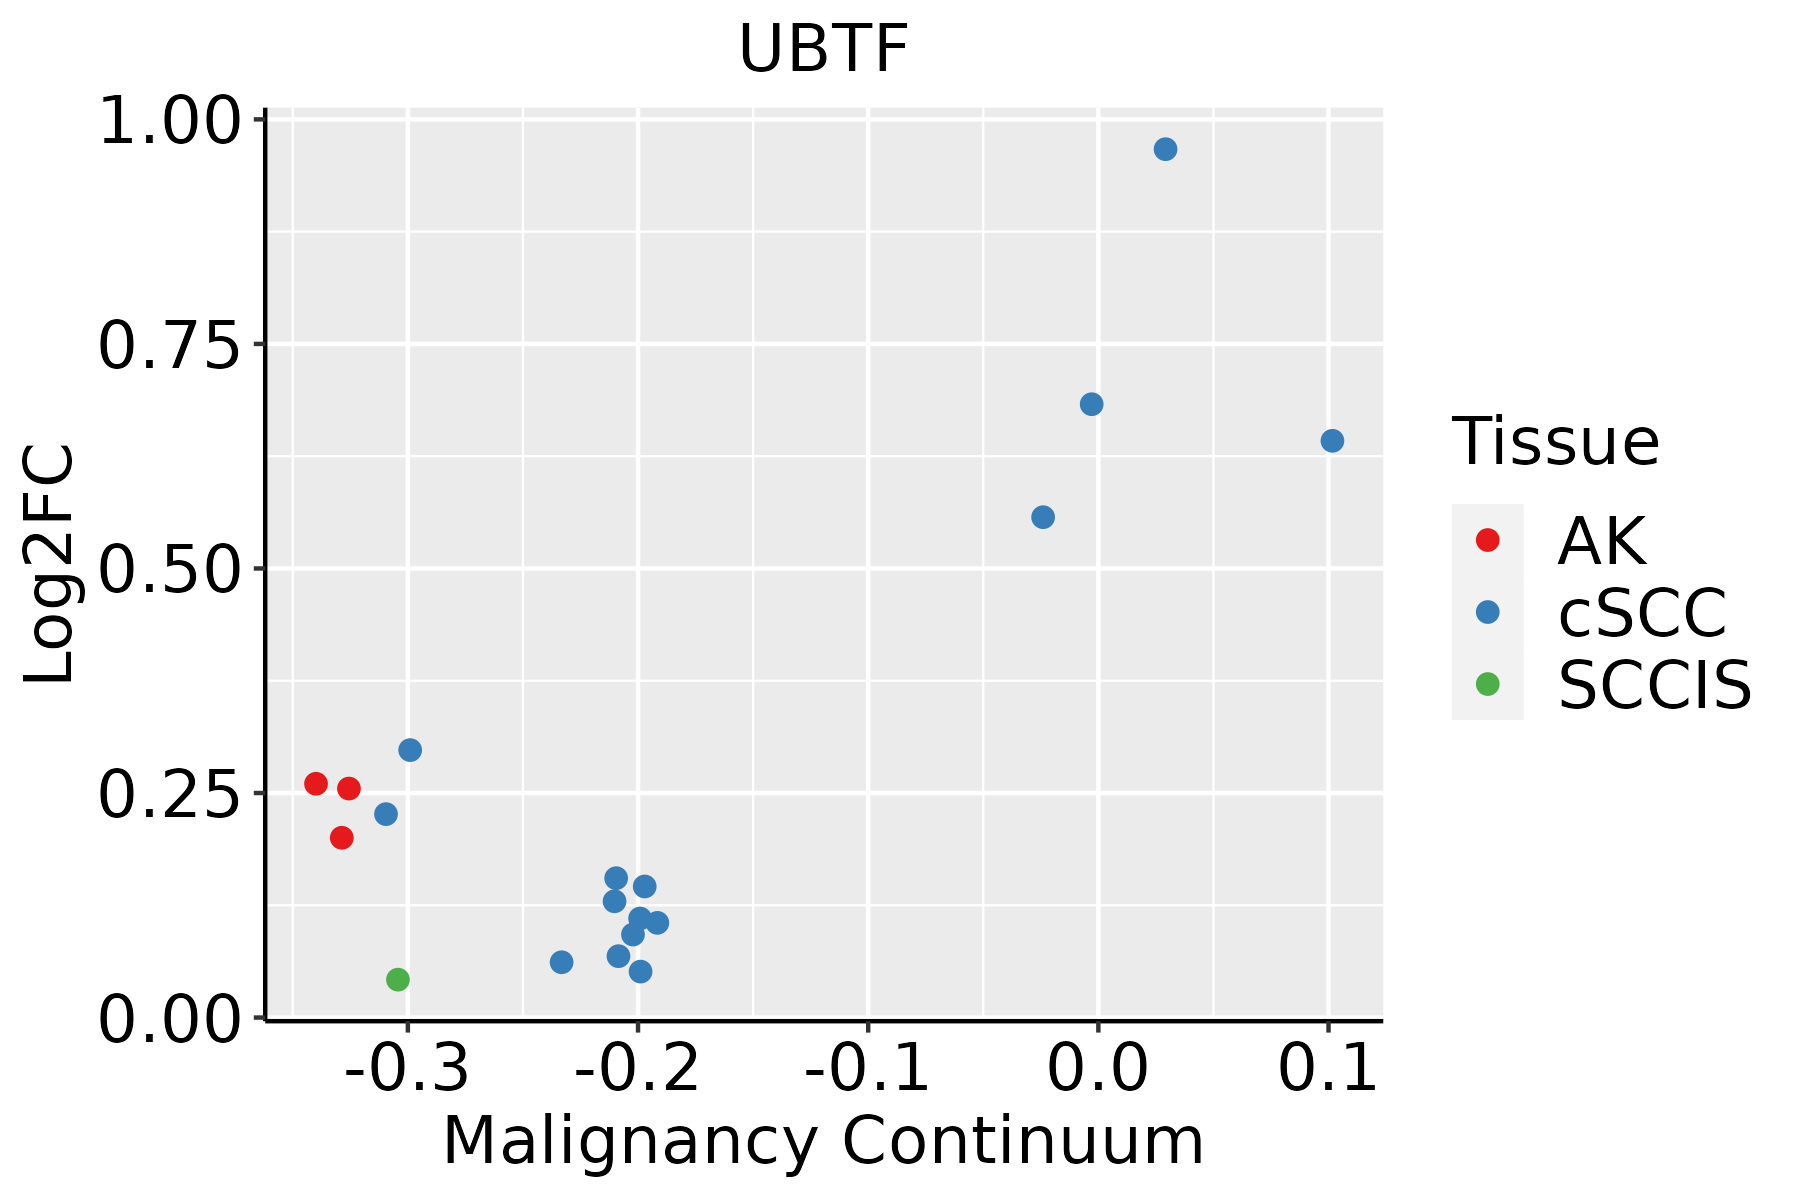
AK: Actinic keratosis
cSCC: Cutaneous squamous cell carcinoma
SCCIS:squamous cell carcinoma in situ
ThyroidThe image shows the transcriptomic changes along malignancy continuum.log2FC in expression of this searched gene in stem-like cells from each diseased tissue sample relative to stem-like cells in normal samples in each tissue plotted against the malignancy continuum. Samples are colored based on if they are from different disease stage.
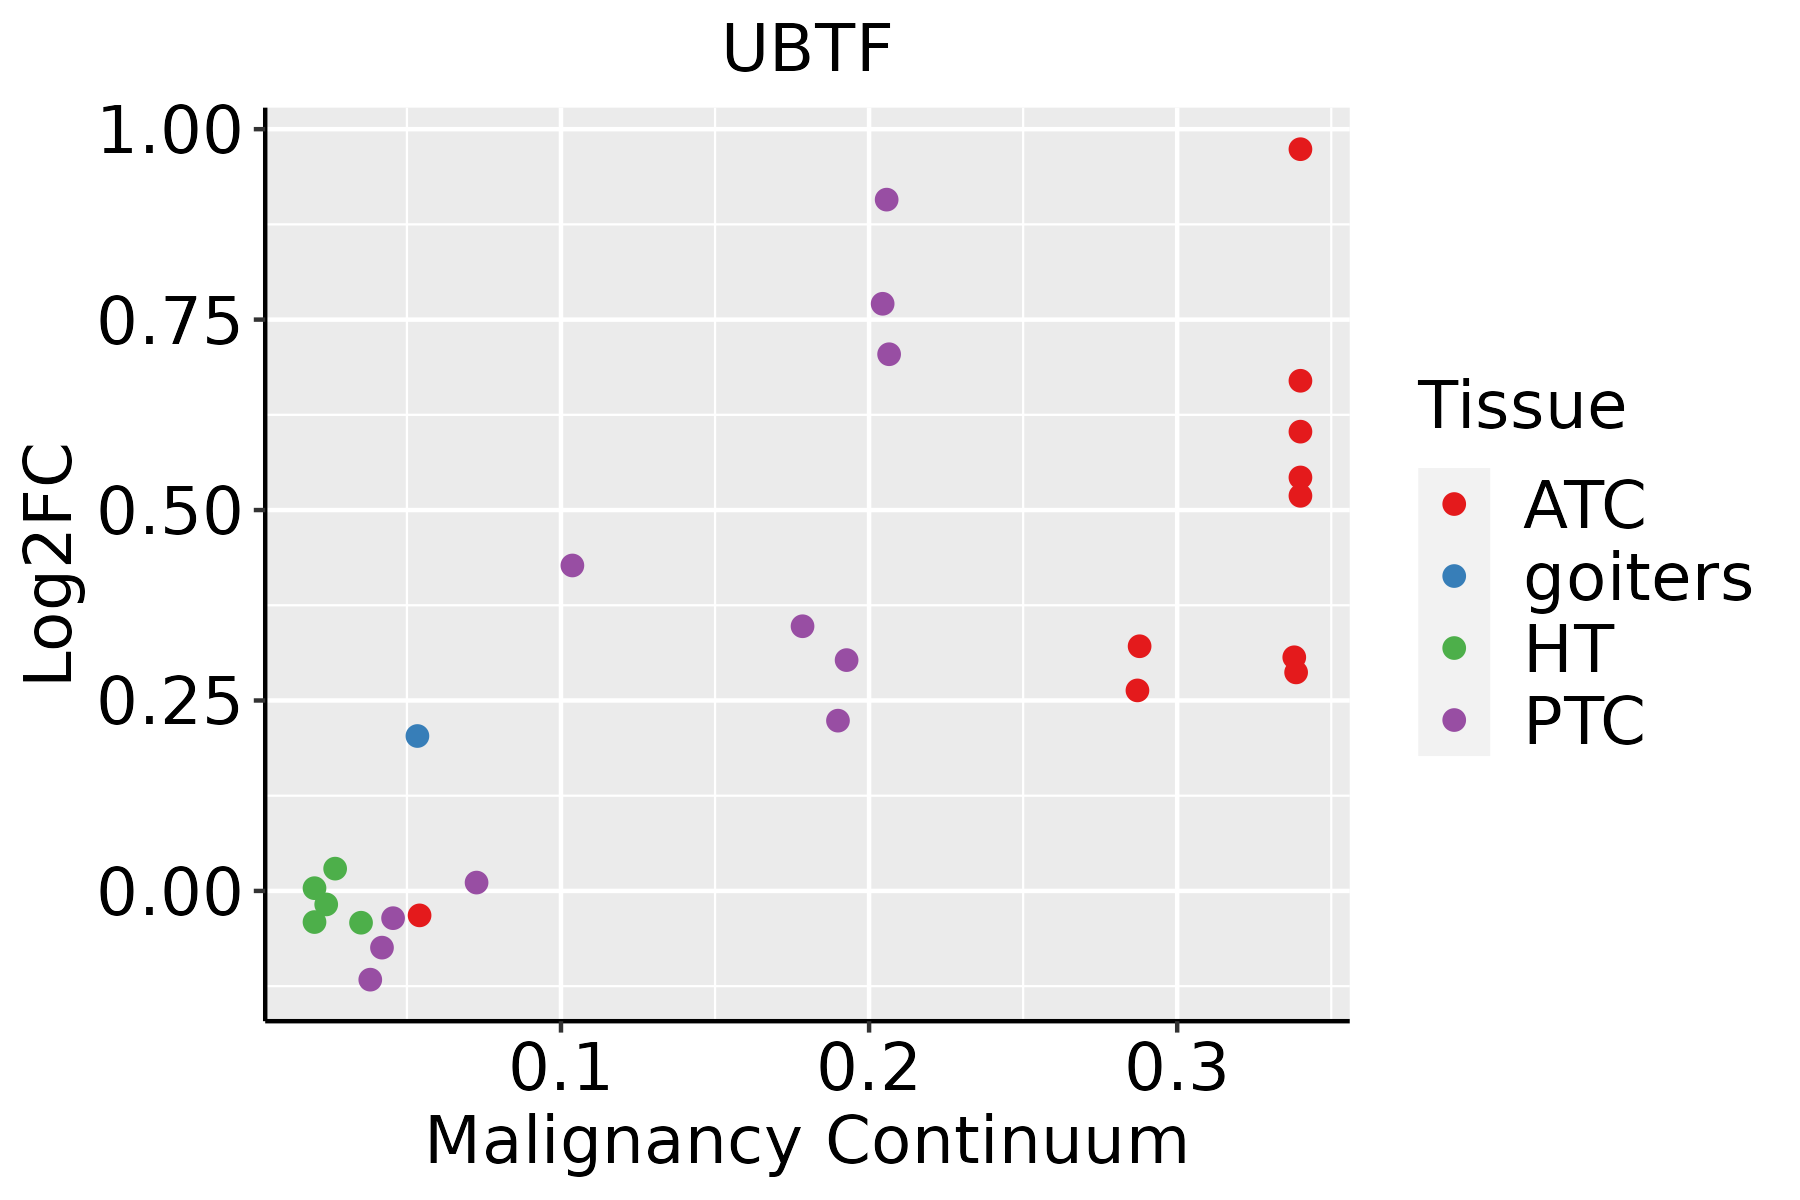
ATC: Anaplastic thyroid cancer
HT: Hashimoto's thyroiditis
PTC: Papillary thyroid cancer
∗log2FC in expression of this searched gene in stem-like cells from each diseased tissue sample relative to stem-like cells in normal samples in each tissue plotted against the malignancy continuum. Samples are colored based on if they are from different disease stage.

Top

Malignant transformation related pathway analysis

check buttonFind out the enriched GO biological processes and KEGG pathways involved in transition from healthy to precancer to cancer
check button Figure of enriched GO biological processes.
TissueDisease StageEnriched GO biological Processes
ColorectumADGO analysis - Figure of enriched GO biological processes: Top 15 enriched GO BP terms are showed in the bar plot of each disease state in each tissue. Each row represents a significant GO biological process which is colored according to the -log10(p.adjust).
ColorectumSERGO analysis - Figure of enriched GO biological processes: Top 15 enriched GO BP terms are showed in the bar plot of each disease state in each tissue. Each row represents a significant GO biological process which is colored according to the -log10(p.adjust).
ColorectumMSSGO analysis - Figure of enriched GO biological processes: Top 15 enriched GO BP terms are showed in the bar plot of each disease state in each tissue. Each row represents a significant GO biological process which is colored according to the -log10(p.adjust).
ColorectumMSI-HGO analysis - Figure of enriched GO biological processes: Top 15 enriched GO BP terms are showed in the bar plot of each disease state in each tissue. Each row represents a significant GO biological process which is colored according to the -log10(p.adjust).
ColorectumFAPGO analysis - Figure of enriched GO biological processes: Top 15 enriched GO BP terms are showed in the bar plot of each disease state in each tissue. Each row represents a significant GO biological process which is colored according to the -log10(p.adjust).
∗Top 15 enriched GO BP terms are showed in the bar plot of each disease state in each tissue. Each row represents a significant GO biological process which is colored according to the -log10(p.adjust).
Page: 1 2 3 4 5 6 7 8 9 

check button Enriched GO biological processes.
GO IDTissueDisease StageDescriptionGene RatioBg Ratiopvaluep.adjustCount
GO:000635211EsophagusESCCDNA-templated transcription, initiation86/8552130/187231.88e-062.19e-0586
GO:00063602EsophagusESCCtranscription by RNA polymerase I42/855255/187233.41e-063.78e-0542
GO:00708973EsophagusESCCtranscription preinitiation complex assembly30/855236/187233.60e-063.95e-0530
GO:00063564EsophagusESCCregulation of transcription by RNA polymerase I27/855234/187236.01e-054.62e-0427
GO:00459432EsophagusESCCpositive regulation of transcription by RNA polymerase I19/855223/187233.12e-041.85e-0319
GO:00063611EsophagusESCCtranscription initiation from RNA polymerase I promoter11/855213/187234.76e-031.85e-0211
GO:0070897LiverCirrhotictranscription preinitiation complex assembly17/463436/187232.82e-031.63e-0217
GO:0006352LiverHCCDNA-templated transcription, initiation78/7958130/187234.19e-054.11e-0478
GO:0006360LiverHCCtranscription by RNA polymerase I36/795855/187234.94e-043.23e-0336
GO:0006356LiverHCCregulation of transcription by RNA polymerase I24/795834/187238.62e-045.13e-0324
GO:00708971LiverHCCtranscription preinitiation complex assembly25/795836/187239.87e-045.71e-0325
GO:0045943LiverHCCpositive regulation of transcription by RNA polymerase I16/795823/187238.04e-033.17e-0216
GO:00063522Oral cavityOSCCDNA-templated transcription, initiation74/7305130/187232.56e-052.39e-0474
GO:00063563Oral cavityOSCCregulation of transcription by RNA polymerase I25/730534/187234.63e-053.90e-0425
GO:00063601Oral cavityOSCCtranscription by RNA polymerase I36/730555/187236.42e-055.22e-0436
GO:00459431Oral cavityOSCCpositive regulation of transcription by RNA polymerase I18/730523/187231.47e-041.04e-0318
GO:00708972Oral cavityOSCCtranscription preinitiation complex assembly24/730536/187237.18e-043.95e-0324
GO:0006361Oral cavityNEOLPtranscription initiation from RNA polymerase I promoter5/200513/187238.62e-034.15e-025
GO:00063561ProstateTumorregulation of transcription by RNA polymerase I13/324634/187233.09e-031.63e-0213
GO:0071824SkinAKprotein-DNA complex subunit organization38/1910241/187234.43e-032.57e-0238
Page: 1 2 

check button Enriched KEGG pathways.
Pathway IDTissueDisease StageDescriptionGene RatioBg Ratiopvaluep.adjustqvalueCount
Page: 1 

Top

Cell-cell communication analysis

check buttonIdentification of potential cell-cell interactions between two cell types and their ligand-receptor pairs for different disease states
LigandReceptorLRpairPathwayTissueDisease Stage
Page: 1 

Top

Single-cell gene regulatory network inference analysis

check buttonFind out the significant the regulons (TFs) and the target genes of each regulon across cell types for different disease states
TFCell TypeTissueDisease StageTarget GeneRSSRegulon Activity
UBTFDStomachHealthySCFD1,ADAM15,TGOLN2, etc.9.50e-03The dot plots of a searched regulon are shown for all cell subpopulations in each disease state of each tissue based on the regulon specific score inferred using pySCENIC and by calculating the average expression.
UBTFA.XStomachHealthySCFD1,ADAM15,TGOLN2, etc.2.17e-02The dot plots of a searched regulon are shown for all cell subpopulations in each disease state of each tissue based on the regulon specific score inferred using pySCENIC and by calculating the average expression.
UBTFPTCThyroidHealthyPPP1CC,TRIP11,CNPY2, etc.3.19e-02The dot plots of a searched regulon are shown for all cell subpopulations in each disease state of each tissue based on the regulon specific score inferred using pySCENIC and by calculating the average expression.
∗The dot plots of a searched regulon are shown for all cell subpopulations in each disease state of each tissue based on the regulon specific score inferred using pySCENIC and by calculating the average expression.
Page: 1 

Top

Somatic mutation of malignant transformation related genes

check buttonAnnotation of somatic variants for genes involved in malignant transformation
Hugo SymbolVariant ClassVariant ClassificationdbSNP RSHGVScHGVSpHGVSp ShortSWISSPROTBIOTYPESIFTPolyPhenTumor Sample BarcodeTissueHistologySexAgeStageTherapy TypesDrugsOutcome
UBTFSNVMissense_Mutationc.246C>Ap.Phe82Leup.F82LP17480protein_codingdeleterious(0.04)benign(0.164)TCGA-A2-A25C-01Breastbreast invasive carcinomaFemale<65I/IIChemotherapytaxotereSD
UBTFSNVMissense_Mutationnovelc.1964N>Cp.Ser655Thrp.S655TP17480protein_codingtolerated(0.14)benign(0.019)TCGA-A7-A6VY-01Breastbreast invasive carcinomaFemale<65I/IIChemotherapycyclophosphamideCR
UBTFSNVMissense_Mutationc.1974N>Tp.Lys658Asnp.K658NP17480protein_codingdeleterious(0.01)probably_damaging(0.993)TCGA-BH-A18G-01Breastbreast invasive carcinomaFemale>=65I/IIUnknownUnknownSD
UBTFSNVMissense_Mutationnovelc.2176N>Cp.Glu726Glnp.E726QP17480protein_codingtolerated_low_confidence(0.17)benign(0.013)TCGA-D8-A1J8-01Breastbreast invasive carcinomaFemale>=65I/IIHormone TherapynolvadexSD
UBTFSNVMissense_Mutationc.1682N>Cp.Met561Thrp.M561TP17480protein_codingtolerated(0.31)benign(0.191)TCGA-D8-A1Y1-01Breastbreast invasive carcinomaFemale>=65III/IVHormone TherapytamoxiphenPD
UBTFinsertionFrame_Shift_Insnovelc.1334_1335insCGGCCGCGCAp.Trp445CysfsTer9p.W445Cfs*9P17480protein_codingTCGA-A1-A0SO-01Breastbreast invasive carcinomaFemale>=65I/IIChemotherapySD
UBTFSNVMissense_Mutationrs758229343c.2122N>Ap.Asp708Asnp.D708NP17480protein_codingtolerated_low_confidence(0.09)probably_damaging(0.978)TCGA-2W-A8YY-01Cervixcervical & endocervical cancerFemale<65I/IIChemotherapycisplatinCR
UBTFSNVMissense_Mutationnovelc.1551N>Cp.Met517Ilep.M517IP17480protein_codingtolerated(0.17)benign(0.007)TCGA-VS-A94Z-01Cervixcervical & endocervical cancerFemale<65I/IIChemotherapycisplatinCR
UBTFSNVMissense_Mutationnovelc.1099N>Ap.Glu367Lysp.E367KP17480protein_codingdeleterious(0.03)probably_damaging(0.913)TCGA-VS-A94Z-01Cervixcervical & endocervical cancerFemale<65I/IIChemotherapycisplatinCR
UBTFSNVMissense_Mutationnovelc.1408A>Gp.Lys470Glup.K470EP17480protein_codingtolerated(0.13)benign(0.345)TCGA-5M-AAT6-01Colorectumcolon adenocarcinomaFemale<65III/IVUnknownUnknownPD
Page: 1 2 3 4 5 6 7 

Top

Related drugs of malignant transformation related genes

check buttonIdentification of chemicals and drugs interact with genes involved in malignant transfromation
(DGIdb 4.0)
Entrez IDSymbolCategoryInteraction TypesDrug Claim NameDrug NamePMIDs
Page: 1