Schematic overview of the cellular and molecular mechanisms involved in the cancer progression, including the proposed cellular and molecular mechanisms in cancer cells trajectory. AT1: alveolar type 1 cells; AT2: alveolar type 2 cells; AAH: atypical adenomatous hyperplasia; AIS: adenocarcinoma in situ; MIA: minimally invasive adenocarcinoma; IA: invasive adenocarcinoma; EMT: epithelial-mesenchymal transition

Home

Download

Statistics

Help

Contact

Center for Computational Systems Medicine
leaf

Gene summary

leaf

Malignant transformation analysis

leaf

Malignant transformation related pathway analysis

leaf

Cell-cell communication analysis

leaf

Single-cell gene regulatory network inference analysis

leaf

Somatic mutation of malignant transformation related genes

leaf

Related drugs of malignant transformation related genes

Gene: UBR4

Gene summary for UBR4

check button Gene summary.

Gene informationSpeciesHuman
Gene symbol

UBR4

Gene ID

23352

Gene nameubiquitin protein ligase E3 component n-recognin 4
Gene AliasRBAF600
Cytomap1p36.13
Gene Typeprotein-coding
GO ID

GO:0006464

UniProtAcc

Q5T4S7


Top

Malignant transformation analysis

check button Identification of the aberrant gene expression in precancerous and cancerous lesions by comparing the gene expression of stem-like cells in diseased tissues with normal stem cells
check button Malignant transformation involving gene list.
Entrez IDSymbolReplicatesSpeciesOrganTissueAdj P-valueLog2FCMalignancy
23352UBR4LZE2THumanEsophagusESCC1.92e-089.84e-010.082
23352UBR4LZE4THumanEsophagusESCC7.62e-103.29e-010.0811
23352UBR4LZE5THumanEsophagusESCC2.50e-043.46e-010.0514
23352UBR4LZE7THumanEsophagusESCC1.44e-229.20e-010.0667
23352UBR4LZE8THumanEsophagusESCC3.29e-093.89e-010.067
23352UBR4LZE20THumanEsophagusESCC2.11e-113.64e-010.0662
23352UBR4LZE22D1HumanEsophagusHGIN7.90e-052.75e-010.0595
23352UBR4LZE22THumanEsophagusESCC2.25e-022.92e-010.068
23352UBR4LZE24THumanEsophagusESCC2.04e-225.92e-010.0596
23352UBR4LZE21THumanEsophagusESCC2.86e-095.12e-010.0655
23352UBR4LZE6THumanEsophagusESCC2.51e-054.35e-010.0845
23352UBR4P1T-EHumanEsophagusESCC3.61e-146.12e-010.0875
23352UBR4P2T-EHumanEsophagusESCC4.16e-345.82e-010.1177
23352UBR4P4T-EHumanEsophagusESCC1.10e-103.36e-010.1323
23352UBR4P5T-EHumanEsophagusESCC6.95e-122.60e-010.1327
23352UBR4P8T-EHumanEsophagusESCC1.94e-275.14e-010.0889
23352UBR4P9T-EHumanEsophagusESCC4.02e-183.86e-010.1131
23352UBR4P10T-EHumanEsophagusESCC3.53e-356.35e-010.116
23352UBR4P11T-EHumanEsophagusESCC1.28e-179.84e-010.1426
23352UBR4P12T-EHumanEsophagusESCC1.15e-234.97e-010.1122
Page: 1 2 3 4 5 6 7 8 

check button Transcriptomic changes along malignancy continuum.
TissueExpression DynamicsAbbreviation
EsophagusThe image shows the transcriptomic changes along malignancy continuum.log2FC in expression of this searched gene in stem-like cells from each diseased tissue sample relative to stem-like cells in normal samples in each tissue plotted against the malignancy continuum. Samples are colored based on if they are from different disease stage.
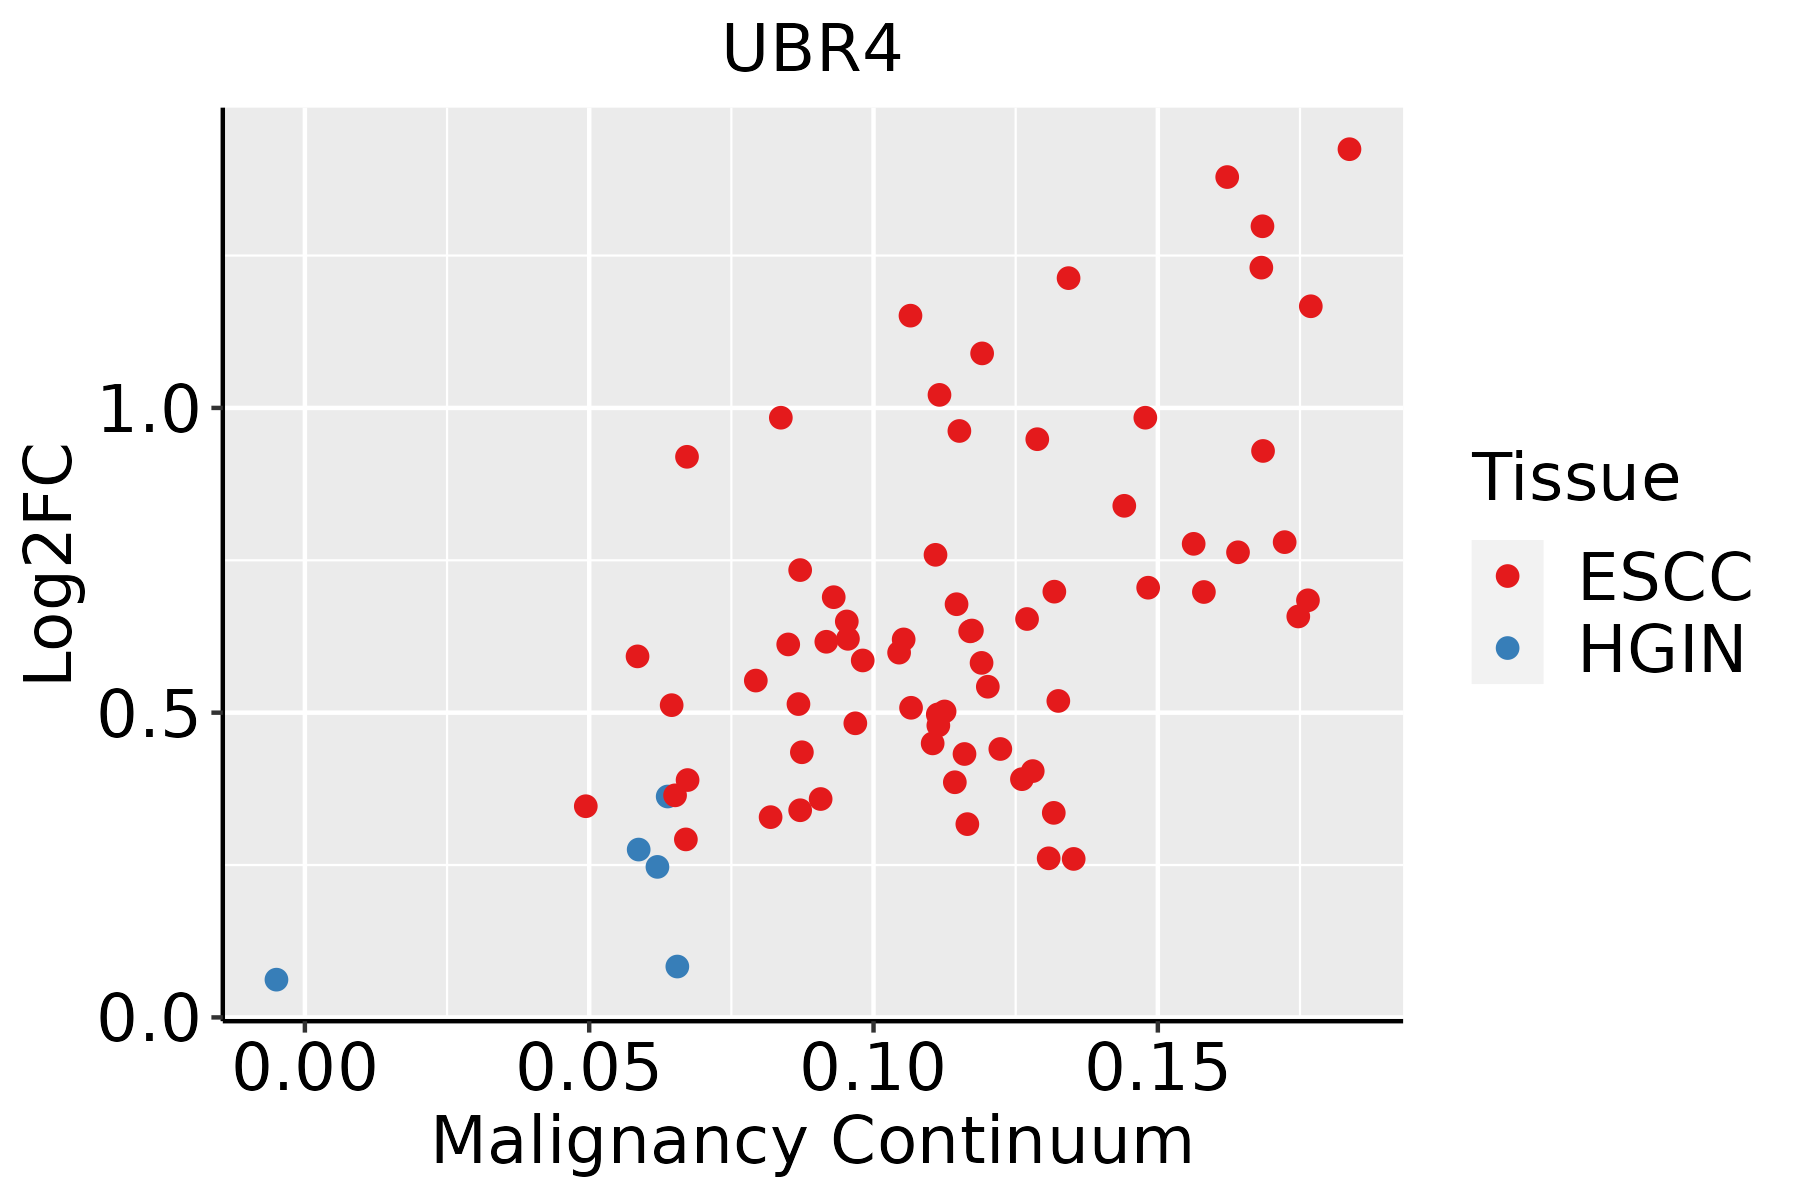
ESCC: Esophageal squamous cell carcinoma
HGIN: High-grade intraepithelial neoplasias
LGIN: Low-grade intraepithelial neoplasias
LiverThe image shows the transcriptomic changes along malignancy continuum.log2FC in expression of this searched gene in stem-like cells from each diseased tissue sample relative to stem-like cells in normal samples in each tissue plotted against the malignancy continuum. Samples are colored based on if they are from different disease stage.
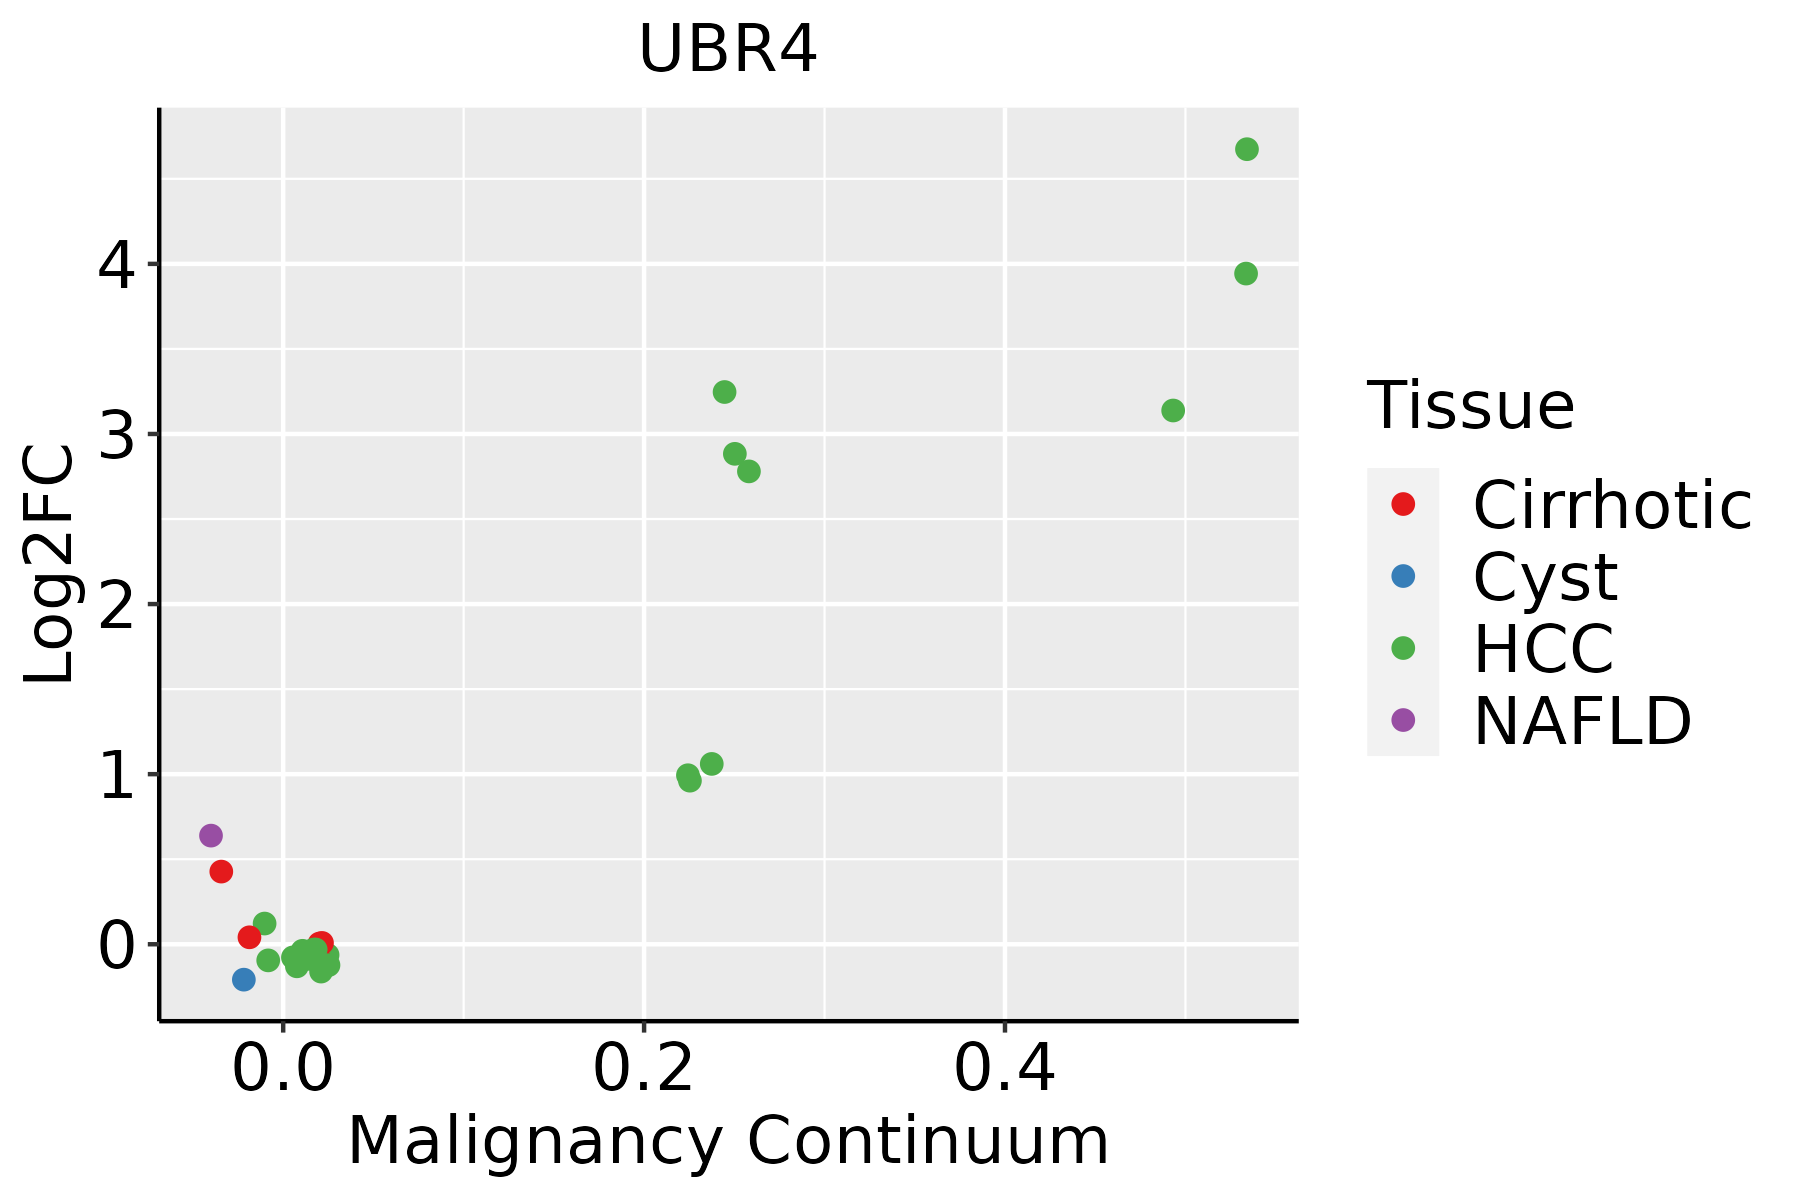
HCC: Hepatocellular carcinoma
NAFLD: Non-alcoholic fatty liver disease
LungThe image shows the transcriptomic changes along malignancy continuum.log2FC in expression of this searched gene in stem-like cells from each diseased tissue sample relative to stem-like cells in normal samples in each tissue plotted against the malignancy continuum. Samples are colored based on if they are from different disease stage.AAH: Atypical adenomatous hyperplasia
AIS: Adenocarcinoma in situ
IAC: Invasive lung adenocarcinoma
MIA: Minimally invasive adenocarcinoma
Oral CavityThe image shows the transcriptomic changes along malignancy continuum.log2FC in expression of this searched gene in stem-like cells from each diseased tissue sample relative to stem-like cells in normal samples in each tissue plotted against the malignancy continuum. Samples are colored based on if they are from different disease stage.
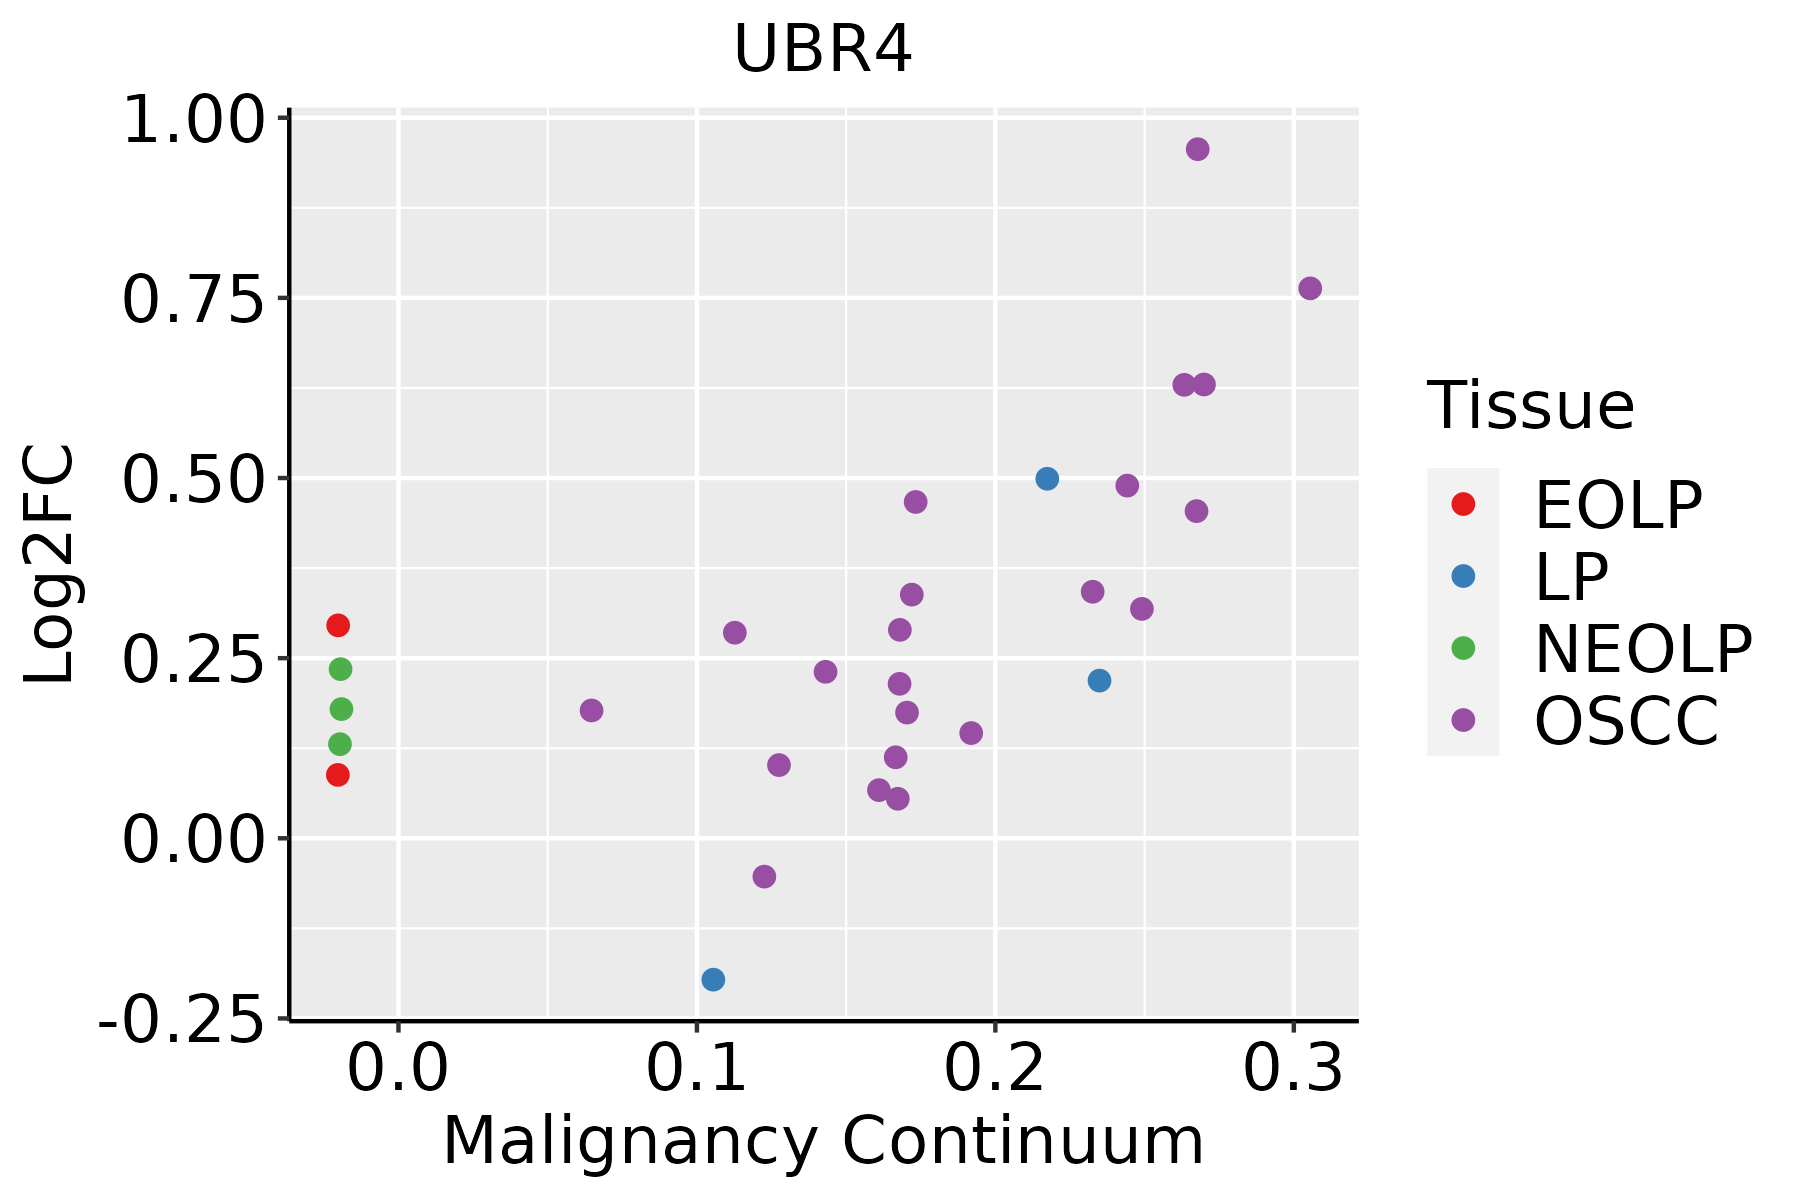
EOLP: Erosive Oral lichen planus
LP: leukoplakia
NEOLP: Non-erosive oral lichen planus
OSCC: Oral squamous cell carcinoma
ProstateThe image shows the transcriptomic changes along malignancy continuum.log2FC in expression of this searched gene in stem-like cells from each diseased tissue sample relative to stem-like cells in normal samples in each tissue plotted against the malignancy continuum. Samples are colored based on if they are from different disease stage.
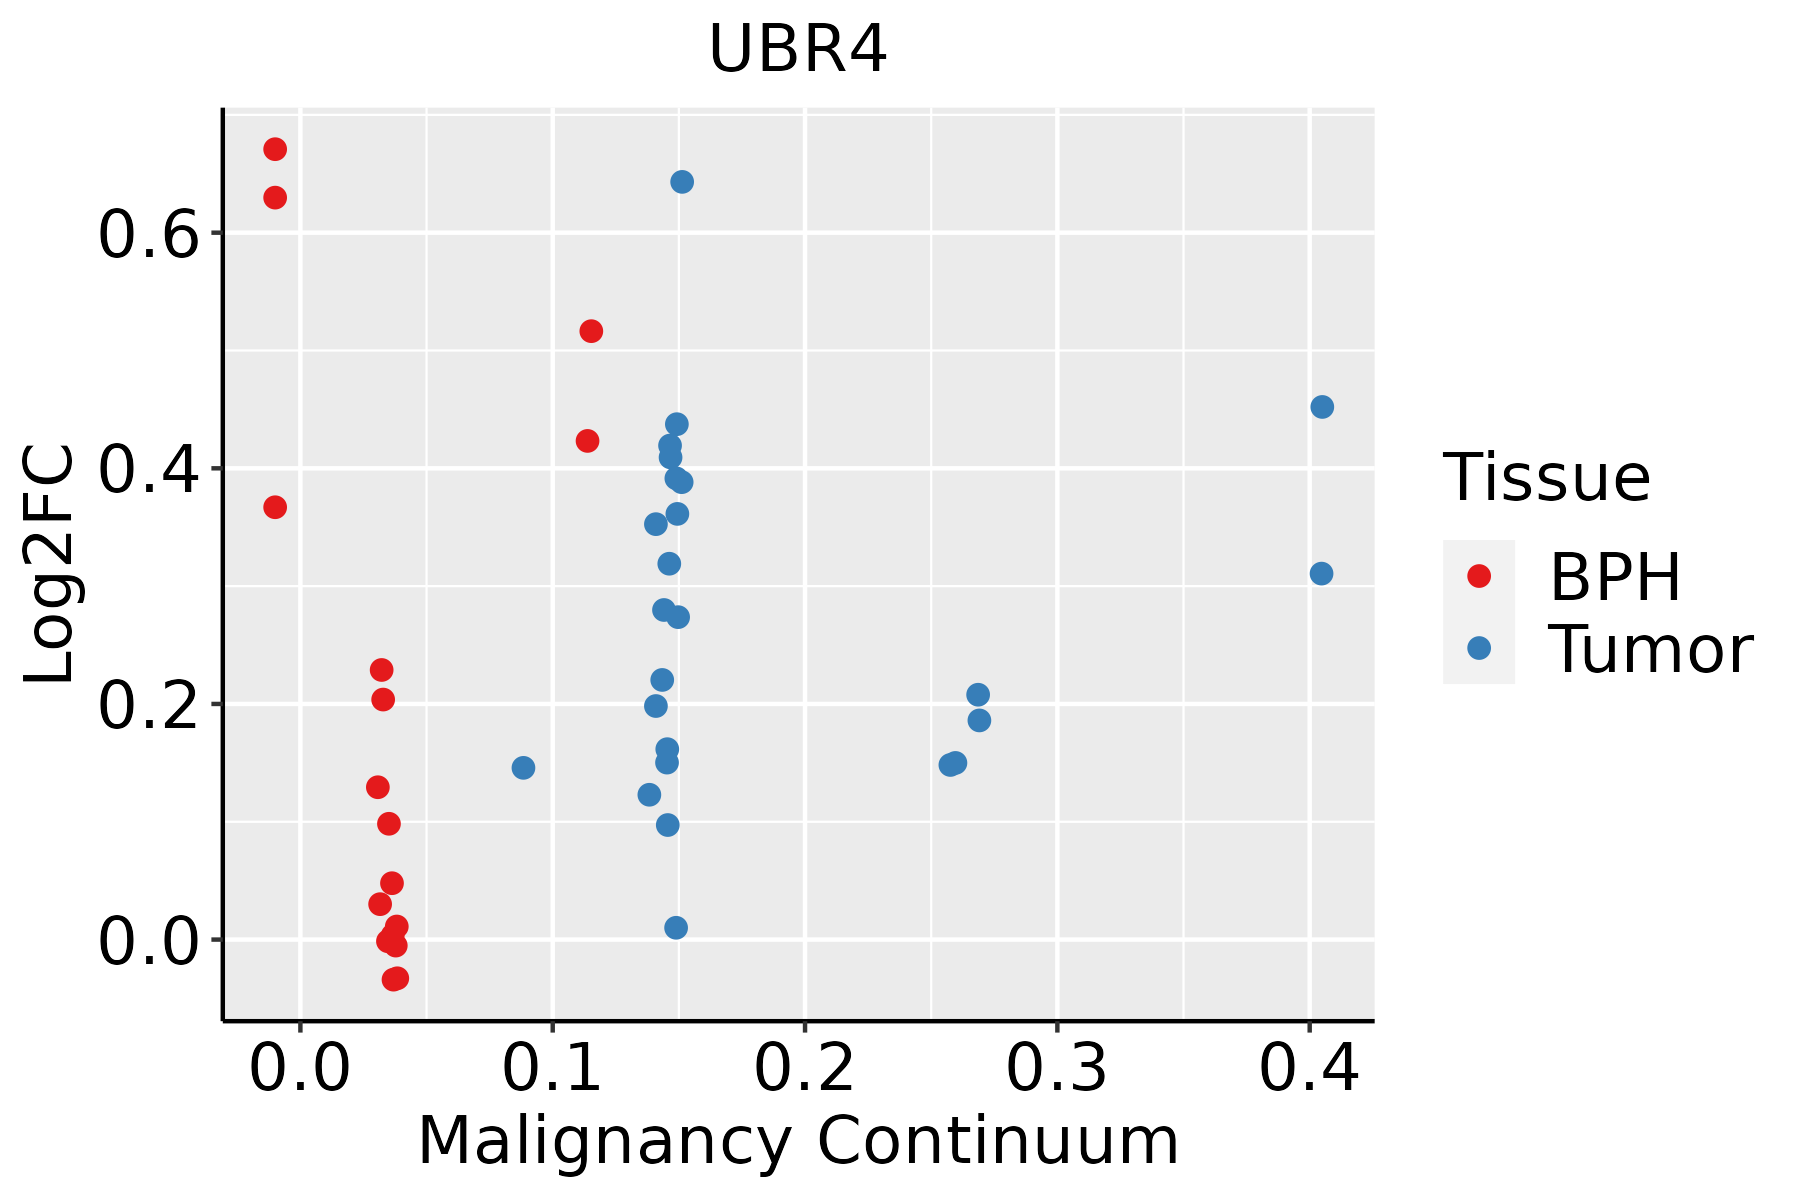
BPH: Benign Prostatic Hyperplasia
SkinThe image shows the transcriptomic changes along malignancy continuum.log2FC in expression of this searched gene in stem-like cells from each diseased tissue sample relative to stem-like cells in normal samples in each tissue plotted against the malignancy continuum. Samples are colored based on if they are from different disease stage.
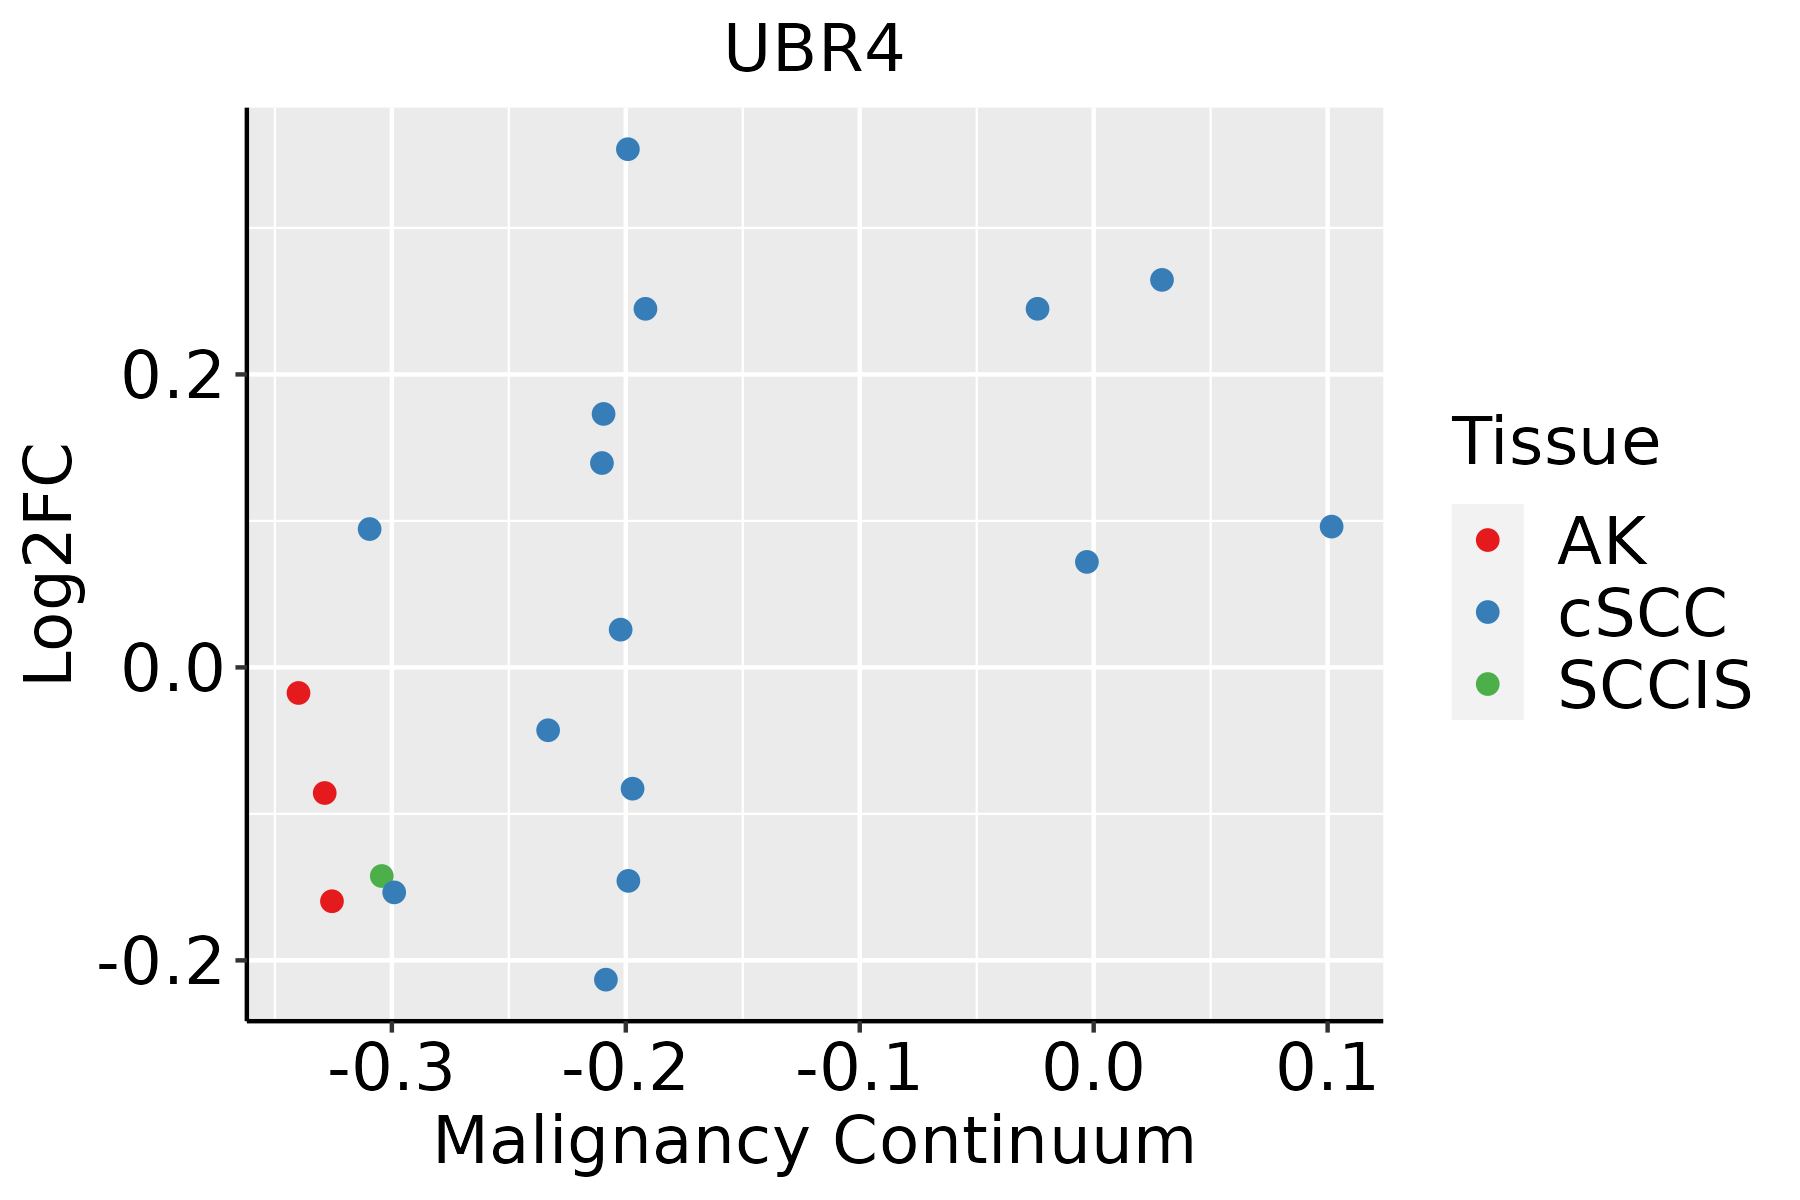
AK: Actinic keratosis
cSCC: Cutaneous squamous cell carcinoma
SCCIS:squamous cell carcinoma in situ
ThyroidThe image shows the transcriptomic changes along malignancy continuum.log2FC in expression of this searched gene in stem-like cells from each diseased tissue sample relative to stem-like cells in normal samples in each tissue plotted against the malignancy continuum. Samples are colored based on if they are from different disease stage.
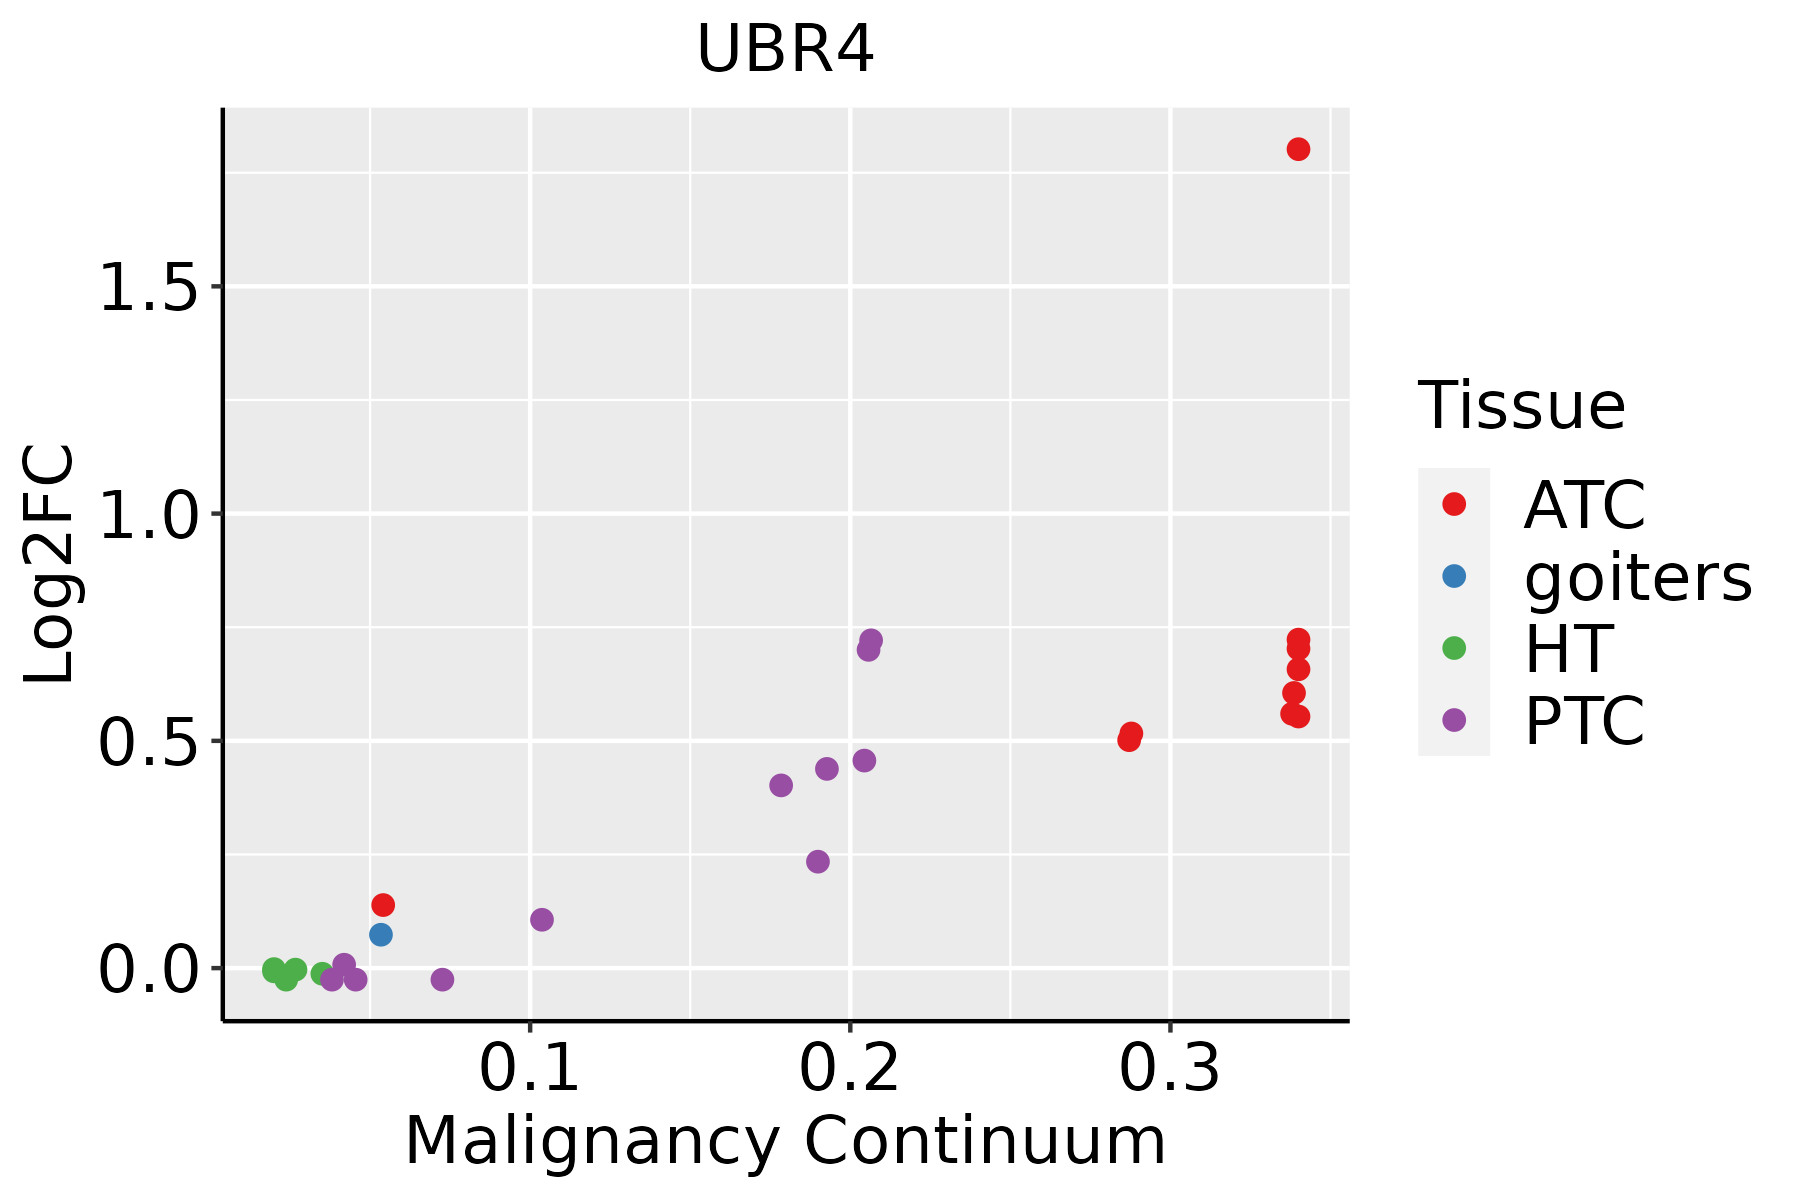
ATC: Anaplastic thyroid cancer
HT: Hashimoto's thyroiditis
PTC: Papillary thyroid cancer
∗log2FC in expression of this searched gene in stem-like cells from each diseased tissue sample relative to stem-like cells in normal samples in each tissue plotted against the malignancy continuum. Samples are colored based on if they are from different disease stage.

Top

Malignant transformation related pathway analysis

check buttonFind out the enriched GO biological processes and KEGG pathways involved in transition from healthy to precancer to cancer
check button Figure of enriched GO biological processes.
TissueDisease StageEnriched GO biological Processes
ColorectumADGO analysis - Figure of enriched GO biological processes: Top 15 enriched GO BP terms are showed in the bar plot of each disease state in each tissue. Each row represents a significant GO biological process which is colored according to the -log10(p.adjust).
ColorectumSERGO analysis - Figure of enriched GO biological processes: Top 15 enriched GO BP terms are showed in the bar plot of each disease state in each tissue. Each row represents a significant GO biological process which is colored according to the -log10(p.adjust).
ColorectumMSSGO analysis - Figure of enriched GO biological processes: Top 15 enriched GO BP terms are showed in the bar plot of each disease state in each tissue. Each row represents a significant GO biological process which is colored according to the -log10(p.adjust).
ColorectumMSI-HGO analysis - Figure of enriched GO biological processes: Top 15 enriched GO BP terms are showed in the bar plot of each disease state in each tissue. Each row represents a significant GO biological process which is colored according to the -log10(p.adjust).
ColorectumFAPGO analysis - Figure of enriched GO biological processes: Top 15 enriched GO BP terms are showed in the bar plot of each disease state in each tissue. Each row represents a significant GO biological process which is colored according to the -log10(p.adjust).
∗Top 15 enriched GO BP terms are showed in the bar plot of each disease state in each tissue. Each row represents a significant GO biological process which is colored according to the -log10(p.adjust).
Page: 1 2 3 4 5 6 7 8 9 

check button Enriched GO biological processes.
GO IDTissueDisease StageDescriptionGene RatioBg Ratiopvaluep.adjustCount
Page: 1 

check button Enriched KEGG pathways.
Pathway IDTissueDisease StageDescriptionGene RatioBg Ratiopvaluep.adjustqvalueCount
hsa052039EsophagusHGINViral carcinogenesis53/1383204/84652.58e-042.71e-032.15e-0353
hsa0520315EsophagusHGINViral carcinogenesis53/1383204/84652.58e-042.71e-032.15e-0353
hsa0516510EsophagusESCCHuman papillomavirus infection215/4205331/84657.86e-097.12e-083.65e-08215
hsa0520325EsophagusESCCViral carcinogenesis137/4205204/84652.47e-071.88e-069.62e-07137
hsa0516515EsophagusESCCHuman papillomavirus infection215/4205331/84657.86e-097.12e-083.65e-08215
hsa0520335EsophagusESCCViral carcinogenesis137/4205204/84652.47e-071.88e-069.62e-07137
hsa05165LiverCirrhoticHuman papillomavirus infection124/2530331/84651.55e-037.83e-034.83e-03124
hsa05203LiverCirrhoticViral carcinogenesis76/2530204/84651.34e-024.20e-022.59e-0276
hsa051651LiverCirrhoticHuman papillomavirus infection124/2530331/84651.55e-037.83e-034.83e-03124
hsa052031LiverCirrhoticViral carcinogenesis76/2530204/84651.34e-024.20e-022.59e-0276
hsa051652LiverHCCHuman papillomavirus infection188/4020331/84653.34e-041.49e-038.29e-04188
hsa052032LiverHCCViral carcinogenesis117/4020204/84652.68e-038.98e-035.00e-03117
hsa051653LiverHCCHuman papillomavirus infection188/4020331/84653.34e-041.49e-038.29e-04188
hsa052033LiverHCCViral carcinogenesis117/4020204/84652.68e-038.98e-035.00e-03117
hsa051656LungIACHuman papillomavirus infection71/1053331/84651.88e-067.63e-055.06e-0571
hsa052034LungIACViral carcinogenesis43/1053204/84653.02e-043.07e-032.04e-0343
hsa0516511LungIACHuman papillomavirus infection71/1053331/84651.88e-067.63e-055.06e-0571
hsa0520311LungIACViral carcinogenesis43/1053204/84653.02e-043.07e-032.04e-0343
hsa0516521LungAISHuman papillomavirus infection64/961331/84651.03e-053.04e-041.95e-0464
hsa0520321LungAISViral carcinogenesis37/961204/84652.49e-031.49e-029.55e-0337
Page: 1 2 3 

Top

Cell-cell communication analysis

check buttonIdentification of potential cell-cell interactions between two cell types and their ligand-receptor pairs for different disease states
LigandReceptorLRpairPathwayTissueDisease Stage
Page: 1 

Top

Single-cell gene regulatory network inference analysis

check buttonFind out the significant the regulons (TFs) and the target genes of each regulon across cell types for different disease states
TFCell TypeTissueDisease StageTarget GeneRSSRegulon Activity
∗The dot plots of a searched regulon are shown for all cell subpopulations in each disease state of each tissue based on the regulon specific score inferred using pySCENIC and by calculating the average expression.
Page: 1 

Top

Somatic mutation of malignant transformation related genes

check buttonAnnotation of somatic variants for genes involved in malignant transformation
Hugo SymbolVariant ClassVariant ClassificationdbSNP RSHGVScHGVSpHGVSp ShortSWISSPROTBIOTYPESIFTPolyPhenTumor Sample BarcodeTissueHistologySexAgeStageTherapy TypesDrugsOutcome
UBR4SNVMissense_Mutationc.2370G>Ap.Met790Ilep.M790IQ5T4S7protein_codingtolerated(0.09)benign(0)TCGA-A2-A0EU-01Breastbreast invasive carcinomaFemale>=65I/IIUnknownUnknownSD
UBR4SNVMissense_Mutationc.8743A>Cp.Ser2915Argp.S2915RQ5T4S7protein_codingdeleterious(0)probably_damaging(0.962)TCGA-A2-A0T0-01Breastbreast invasive carcinomaFemale<65I/IIChemotherapytaxotereSD
UBR4SNVMissense_Mutationrs772692146c.7600N>Cp.Thr2534Prop.T2534PQ5T4S7protein_codingtolerated(0.21)possibly_damaging(0.72)TCGA-A2-A0YD-01Breastbreast invasive carcinomaFemale<65I/IIChemotherapycytoxanSD
UBR4SNVMissense_Mutationc.15224N>Cp.Gly5075Alap.G5075AQ5T4S7protein_codingtolerated(0.55)benign(0.099)TCGA-A2-A0YK-01Breastbreast invasive carcinomaFemale<65I/IIChemotherapycytoxanSD
UBR4SNVMissense_Mutationnovelc.12940N>Tp.Ile4314Phep.I4314FQ5T4S7protein_codingdeleterious(0)benign(0.021)TCGA-A2-A4RW-01Breastbreast invasive carcinomaFemale<65III/IVUnknownUnknownSD
UBR4SNVMissense_Mutationc.6962N>Ap.Leu2321Glnp.L2321QQ5T4S7protein_codingdeleterious(0)possibly_damaging(0.548)TCGA-A8-A085-01Breastbreast invasive carcinomaMale<65I/IIHormone TherapytamoxiphenSD
UBR4SNVMissense_Mutationrs555728639c.3617N>Gp.Ser1206Cysp.S1206CQ5T4S7protein_codingdeleterious(0.02)probably_damaging(0.981)TCGA-A8-A085-01Breastbreast invasive carcinomaMale<65I/IIHormone TherapytamoxiphenSD
UBR4SNVMissense_Mutationc.12865G>Ap.Asp4289Asnp.D4289NQ5T4S7protein_codingtolerated(0.05)benign(0.001)TCGA-A8-A095-01Breastbreast invasive carcinomaFemale<65I/IIChemotherapy5-fluorouracilCR
UBR4SNVMissense_Mutationc.14108N>Tp.Lys4703Metp.K4703MQ5T4S7protein_codingdeleterious(0)probably_damaging(0.997)TCGA-A8-A09W-01Breastbreast invasive carcinomaFemale>=65III/IVUnknownUnknownSD
UBR4SNVMissense_Mutationc.4820N>Tp.Thr1607Metp.T1607MQ5T4S7protein_codingtolerated(0.33)benign(0.015)TCGA-A8-A09Z-01Breastbreast invasive carcinomaFemale>=65I/IIUnknownUnknownSD
Page: 1 2 3 4 5 6 7 8 9 10 11 12 13 14 15 16 17 18 19 20 21 22 23 24 25 26 27 28 29 30 31 32 33 34 35 36 37 38 39 40 41 42 43 

Top

Related drugs of malignant transformation related genes

check buttonIdentification of chemicals and drugs interact with genes involved in malignant transfromation
(DGIdb 4.0)
Entrez IDSymbolCategoryInteraction TypesDrug Claim NameDrug NamePMIDs
Page: 1