| Tissue | Expression Dynamics | Abbreviation |
| Cervix | 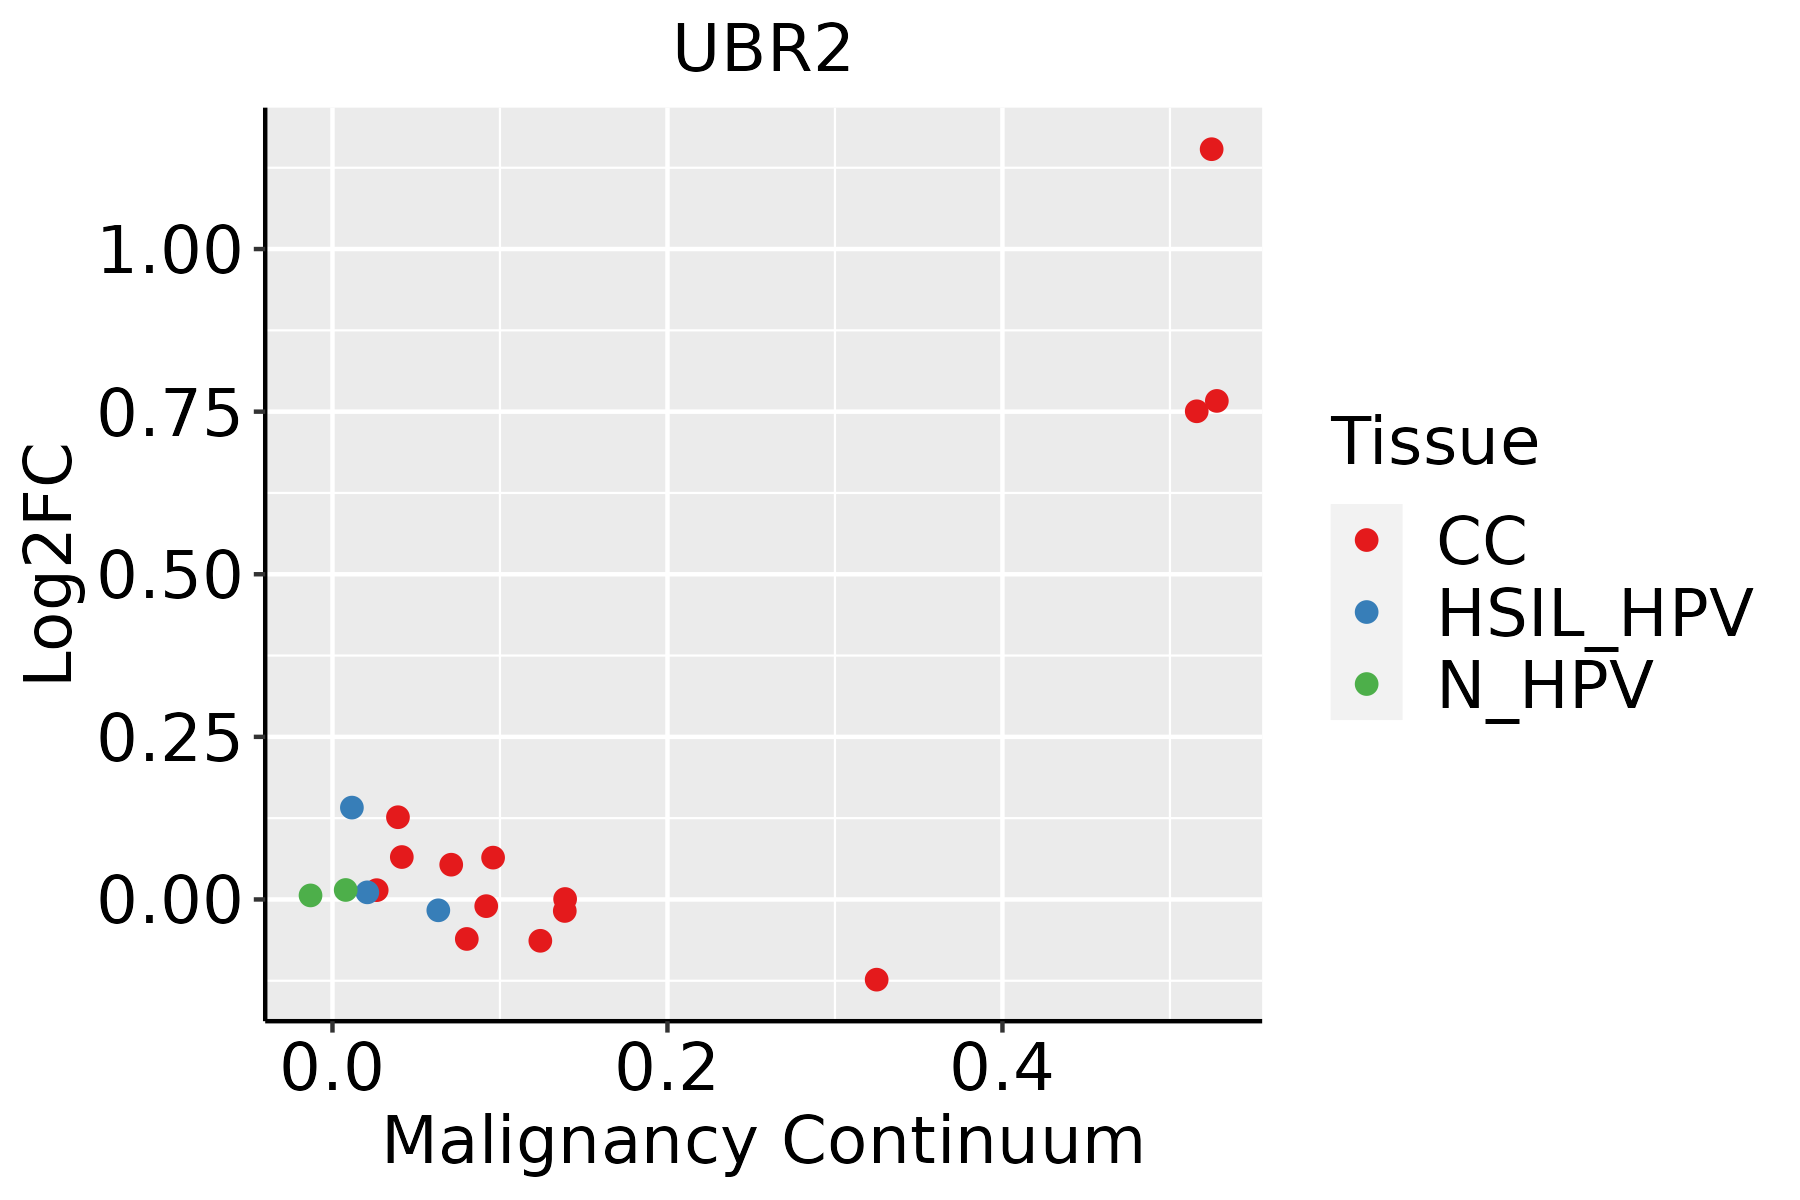 | CC: Cervix cancer |
| HSIL_HPV: HPV-infected high-grade squamous intraepithelial lesions |
| N_HPV: HPV-infected normal cervix |
| Colorectum (GSE201348) |  | FAP: Familial adenomatous polyposis |
| CRC: Colorectal cancer |
| Colorectum (HTA11) |  | AD: Adenomas |
| SER: Sessile serrated lesions |
| MSI-H: Microsatellite-high colorectal cancer |
| MSS: Microsatellite stable colorectal cancer |
| Esophagus |  | ESCC: Esophageal squamous cell carcinoma |
| HGIN: High-grade intraepithelial neoplasias |
| LGIN: Low-grade intraepithelial neoplasias |
| Liver | 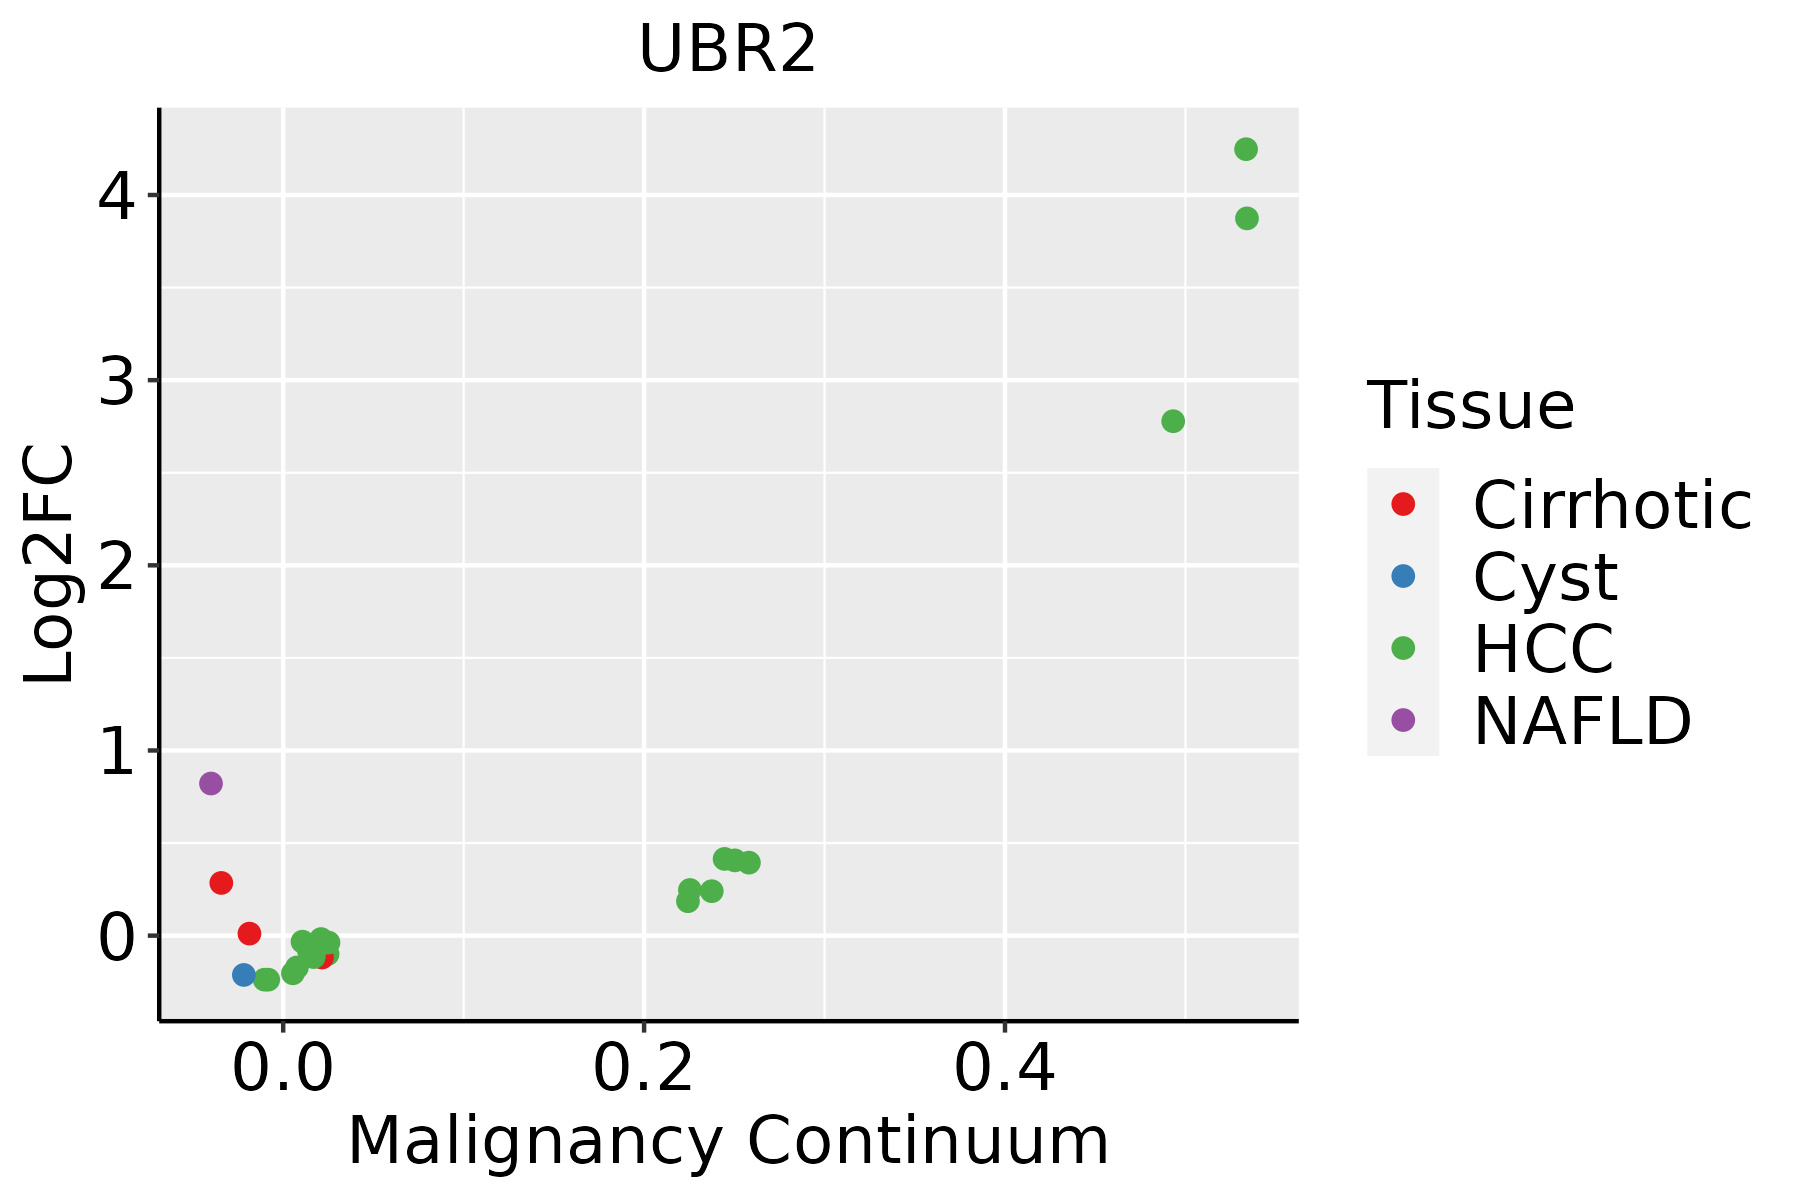 | HCC: Hepatocellular carcinoma |
| NAFLD: Non-alcoholic fatty liver disease |
| Lung | 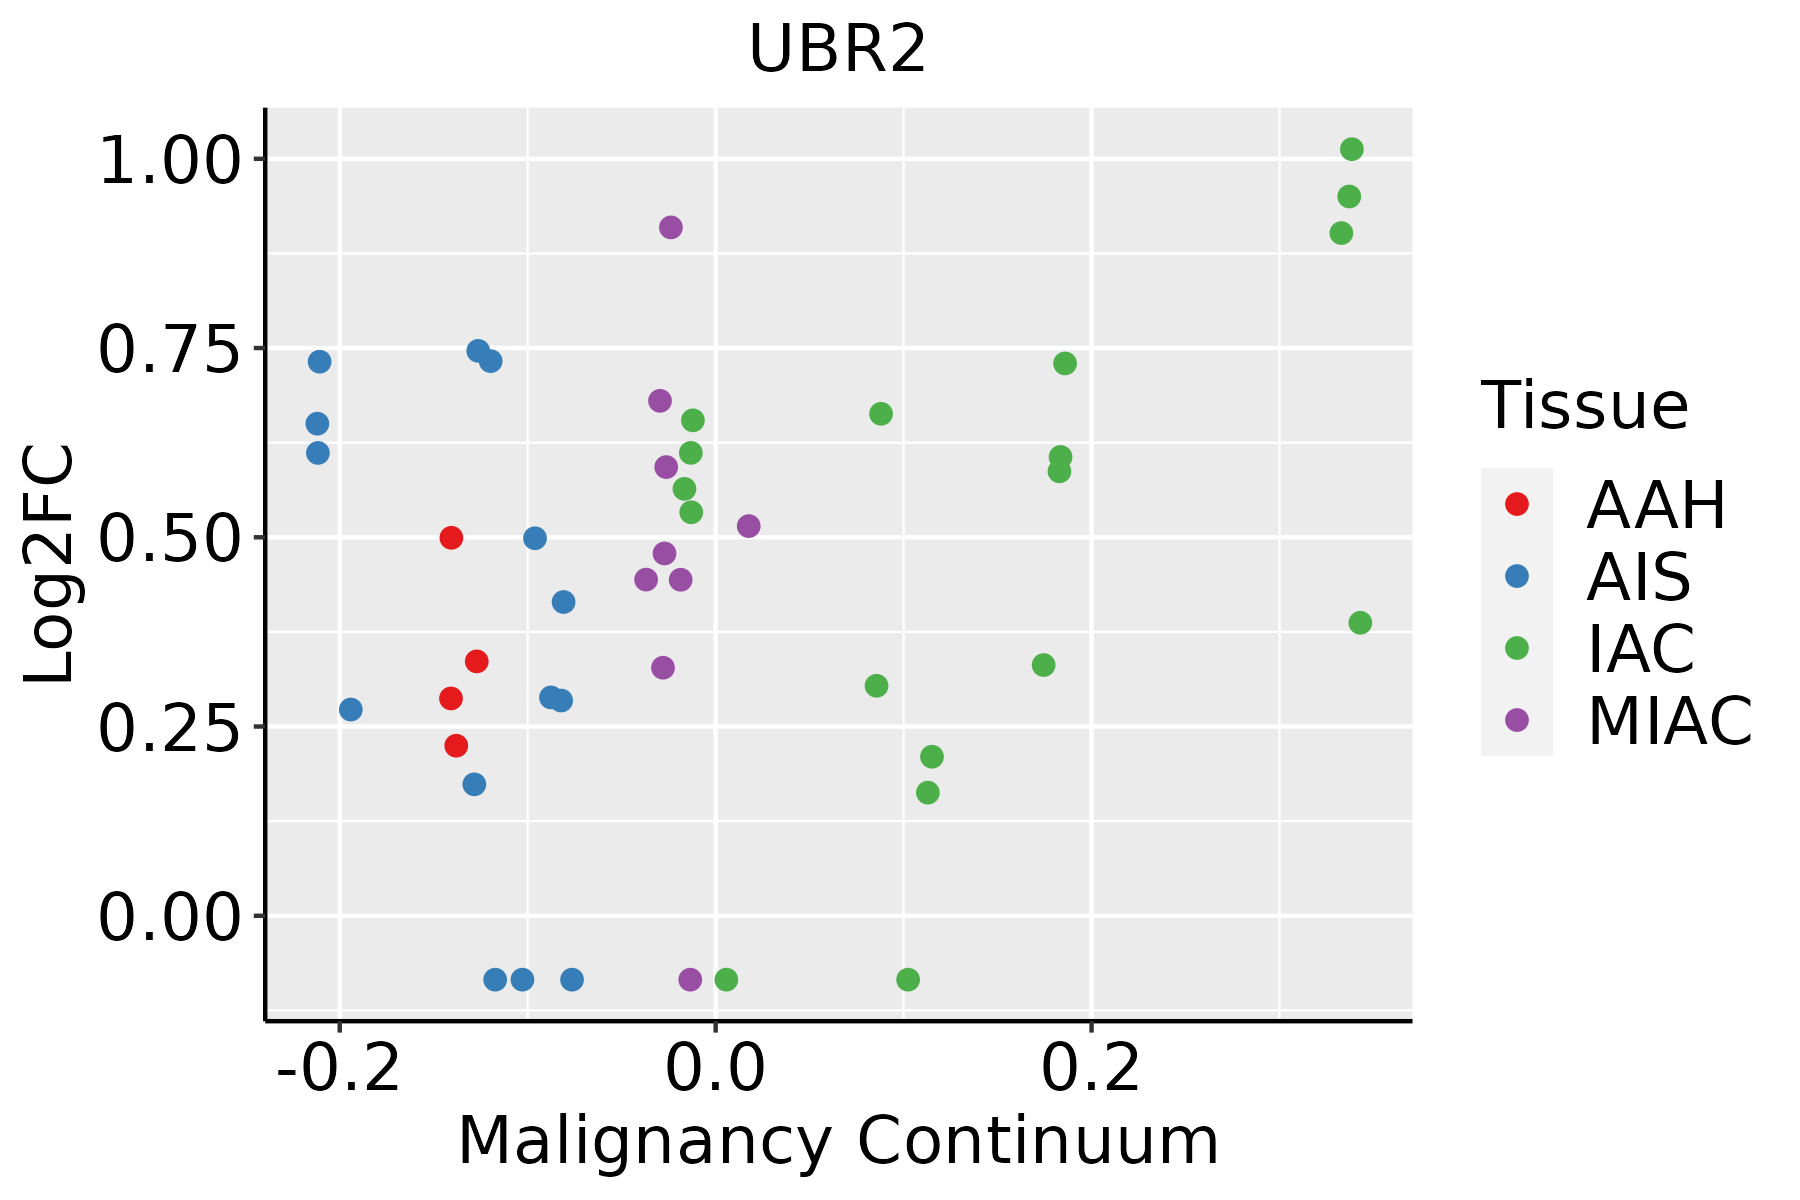 | AAH: Atypical adenomatous hyperplasia |
| AIS: Adenocarcinoma in situ |
| IAC: Invasive lung adenocarcinoma |
| MIA: Minimally invasive adenocarcinoma |
| Oral Cavity |  | EOLP: Erosive Oral lichen planus |
| LP: leukoplakia |
| NEOLP: Non-erosive oral lichen planus |
| OSCC: Oral squamous cell carcinoma |
| Skin |  | AK: Actinic keratosis |
| cSCC: Cutaneous squamous cell carcinoma |
| SCCIS:squamous cell carcinoma in situ |
| Thyroid | 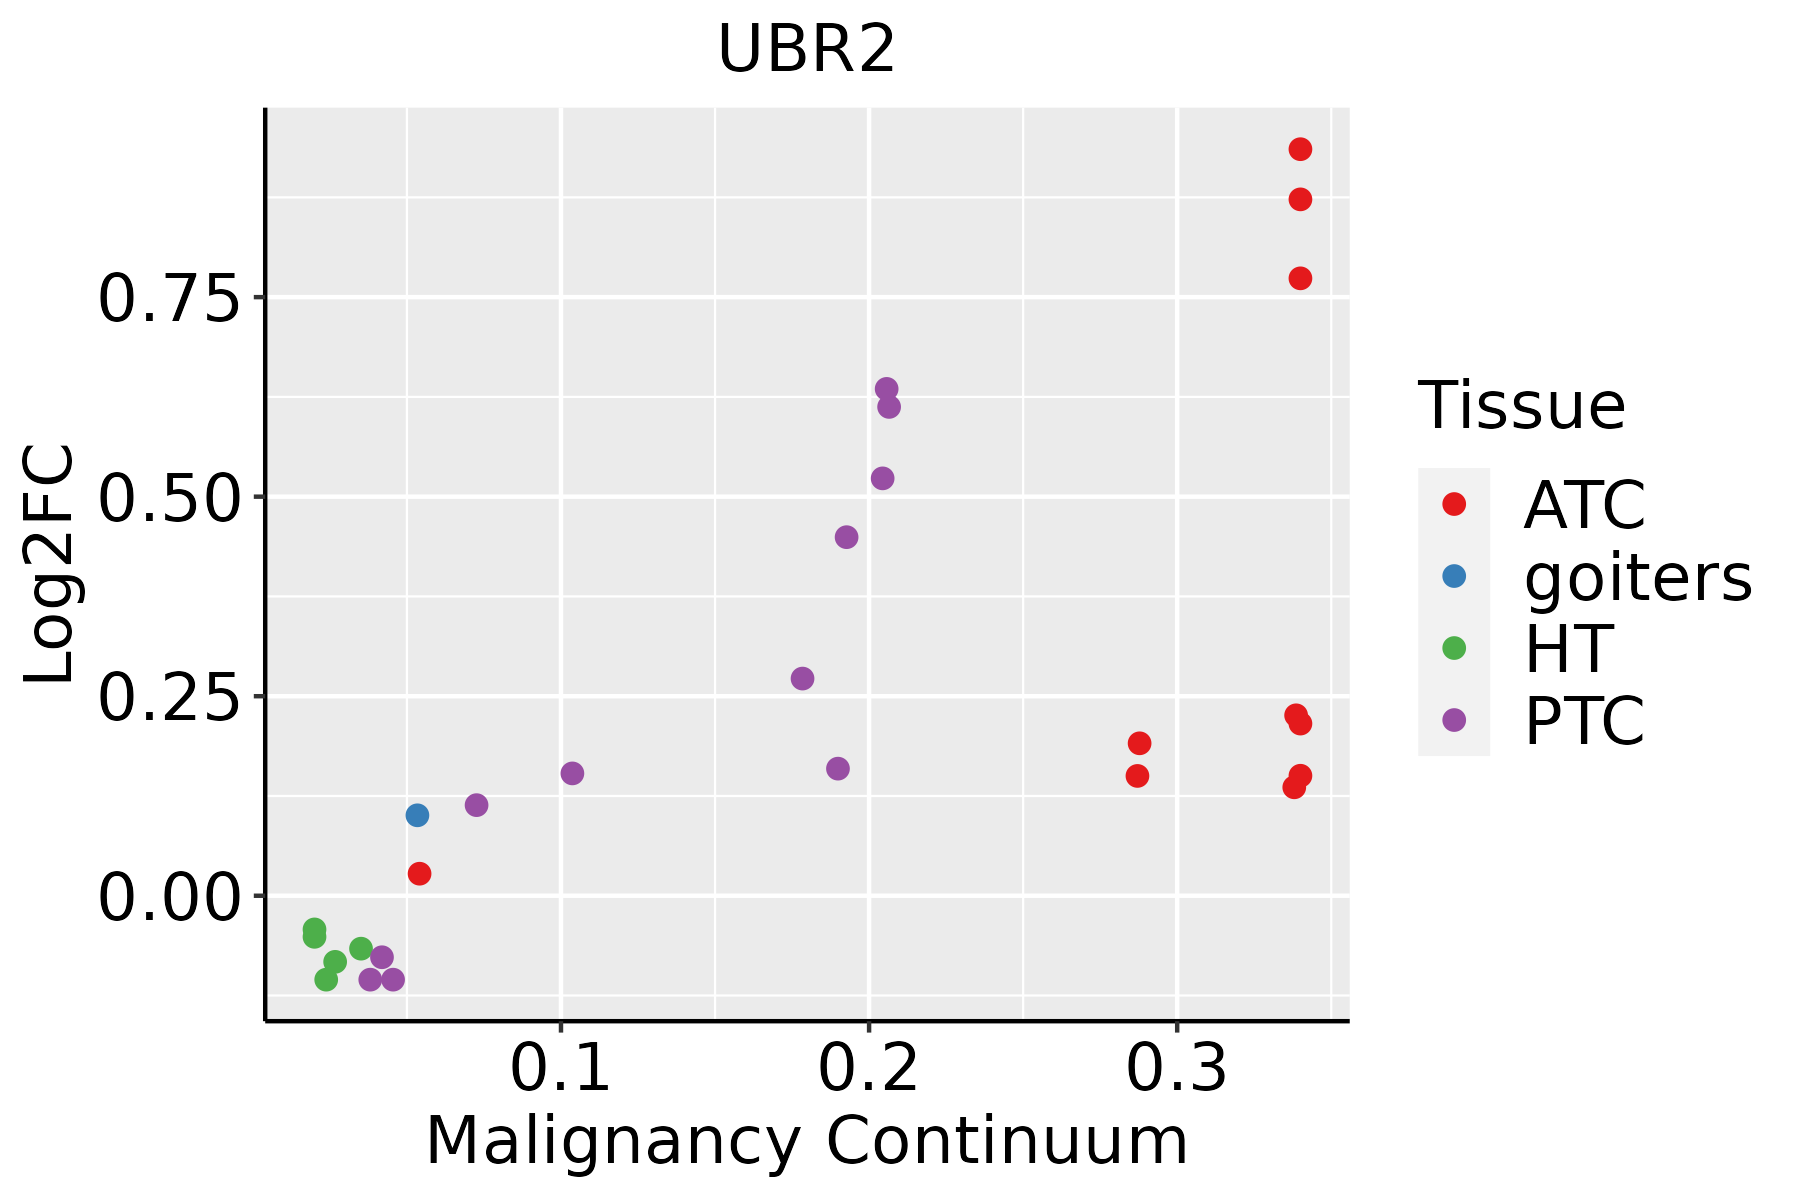 | ATC: Anaplastic thyroid cancer |
| HT: Hashimoto's thyroiditis |
| PTC: Papillary thyroid cancer |
| GO ID | Tissue | Disease Stage | Description | Gene Ratio | Bg Ratio | pvalue | p.adjust | Count |
| GO:001049810 | Cervix | CC | proteasomal protein catabolic process | 111/2311 | 490/18723 | 8.98e-11 | 1.58e-08 | 111 |
| GO:004316110 | Cervix | CC | proteasome-mediated ubiquitin-dependent protein catabolic process | 91/2311 | 412/18723 | 1.65e-08 | 1.25e-06 | 91 |
| GO:00165705 | Cervix | CC | histone modification | 84/2311 | 463/18723 | 1.70e-04 | 2.01e-03 | 84 |
| GO:00011016 | Cervix | CC | response to acid chemical | 31/2311 | 135/18723 | 4.16e-04 | 4.22e-03 | 31 |
| GO:00712292 | Cervix | CC | cellular response to acid chemical | 20/2311 | 80/18723 | 1.40e-03 | 1.10e-02 | 20 |
| GO:00712301 | Cervix | CC | cellular response to amino acid stimulus | 18/2311 | 71/18723 | 2.01e-03 | 1.47e-02 | 18 |
| GO:00432004 | Cervix | CC | response to amino acid | 25/2311 | 116/18723 | 3.59e-03 | 2.30e-02 | 25 |
| GO:00482851 | Cervix | CC | organelle fission | 78/2311 | 488/18723 | 9.70e-03 | 4.79e-02 | 78 |
| GO:0010498 | Colorectum | AD | proteasomal protein catabolic process | 174/3918 | 490/18723 | 3.18e-14 | 7.66e-12 | 174 |
| GO:0043161 | Colorectum | AD | proteasome-mediated ubiquitin-dependent protein catabolic process | 141/3918 | 412/18723 | 1.77e-10 | 1.68e-08 | 141 |
| GO:0033522 | Colorectum | AD | histone H2A ubiquitination | 12/3918 | 26/18723 | 3.47e-03 | 2.51e-02 | 12 |
| GO:00104982 | Colorectum | MSS | proteasomal protein catabolic process | 157/3467 | 490/18723 | 2.39e-13 | 5.25e-11 | 157 |
| GO:00431612 | Colorectum | MSS | proteasome-mediated ubiquitin-dependent protein catabolic process | 127/3467 | 412/18723 | 7.70e-10 | 6.32e-08 | 127 |
| GO:0016570 | Colorectum | MSS | histone modification | 113/3467 | 463/18723 | 8.37e-04 | 8.68e-03 | 113 |
| GO:00335221 | Colorectum | MSS | histone H2A ubiquitination | 12/3467 | 26/18723 | 1.16e-03 | 1.12e-02 | 12 |
| GO:0031929 | Colorectum | MSS | TOR signaling | 35/3467 | 126/18723 | 6.91e-03 | 4.44e-02 | 35 |
| GO:0016574 | Colorectum | MSS | histone ubiquitination | 16/3467 | 47/18723 | 8.22e-03 | 4.99e-02 | 16 |
| GO:00431614 | Colorectum | FAP | proteasome-mediated ubiquitin-dependent protein catabolic process | 98/2622 | 412/18723 | 5.41e-08 | 4.20e-06 | 98 |
| GO:00104984 | Colorectum | FAP | proteasomal protein catabolic process | 110/2622 | 490/18723 | 2.12e-07 | 1.26e-05 | 110 |
| GO:00165701 | Colorectum | FAP | histone modification | 94/2622 | 463/18723 | 1.06e-04 | 1.76e-03 | 94 |
| Hugo Symbol | Variant Class | Variant Classification | dbSNP RS | HGVSc | HGVSp | HGVSp Short | SWISSPROT | BIOTYPE | SIFT | PolyPhen | Tumor Sample Barcode | Tissue | Histology | Sex | Age | Stage | Therapy Types | Drugs | Outcome |
| UBR2 | SNV | Missense_Mutation | | c.574N>C | p.Tyr192His | p.Y192H | Q8IWV8 | protein_coding | tolerated(0.51) | benign(0.017) | TCGA-A2-A0EQ-01 | Breast | breast invasive carcinoma | Female | <65 | I/II | Chemotherapy | adriamycin | SD |
| UBR2 | SNV | Missense_Mutation | | c.2204C>T | p.Ser735Phe | p.S735F | Q8IWV8 | protein_coding | tolerated(0.29) | benign(0.129) | TCGA-AC-A23H-01 | Breast | breast invasive carcinoma | Female | >=65 | I/II | Unknown | Unknown | PD |
| UBR2 | SNV | Missense_Mutation | novel | c.3472N>A | p.Asp1158Asn | p.D1158N | Q8IWV8 | protein_coding | tolerated(0.06) | benign(0.017) | TCGA-AR-A0TS-01 | Breast | breast invasive carcinoma | Female | <65 | I/II | Chemotherapy | doxorubicin | SD |
| UBR2 | SNV | Missense_Mutation | novel | c.3039N>C | p.Glu1013Asp | p.E1013D | Q8IWV8 | protein_coding | tolerated(0.39) | benign(0.003) | TCGA-BH-A0B6-01 | Breast | breast invasive carcinoma | Female | <65 | I/II | Unknown | Unknown | SD |
| UBR2 | SNV | Missense_Mutation | | c.4187N>C | p.Leu1396Pro | p.L1396P | Q8IWV8 | protein_coding | deleterious(0) | probably_damaging(0.928) | TCGA-BH-A18G-01 | Breast | breast invasive carcinoma | Female | >=65 | I/II | Unknown | Unknown | SD |
| UBR2 | SNV | Missense_Mutation | novel | c.2206G>A | p.Glu736Lys | p.E736K | Q8IWV8 | protein_coding | tolerated(0.72) | benign(0.003) | TCGA-BH-A28O-01 | Breast | breast invasive carcinoma | Female | <65 | III/IV | Chemotherapy | cytoxan | CR |
| UBR2 | SNV | Missense_Mutation | novel | c.4444N>T | p.Ala1482Ser | p.A1482S | Q8IWV8 | protein_coding | tolerated(0.95) | benign(0) | TCGA-BH-A42U-01 | Breast | breast invasive carcinoma | Female | >=65 | I/II | Unknown | Unknown | SD |
| UBR2 | SNV | Missense_Mutation | | c.1702A>G | p.Lys568Glu | p.K568E | Q8IWV8 | protein_coding | tolerated(1) | benign(0.003) | TCGA-D8-A147-01 | Breast | breast invasive carcinoma | Female | <65 | I/II | Chemotherapy | doxorubicine | SD |
| UBR2 | SNV | Missense_Mutation | | c.8N>G | p.Ser3Trp | p.S3W | Q8IWV8 | protein_coding | deleterious_low_confidence(0) | possibly_damaging(0.461) | TCGA-D8-A27G-01 | Breast | breast invasive carcinoma | Female | >=65 | I/II | Unknown | Unknown | SD |
| UBR2 | SNV | Missense_Mutation | rs754681331 | c.2750C>T | p.Ser917Leu | p.S917L | Q8IWV8 | protein_coding | deleterious(0) | possibly_damaging(0.792) | TCGA-E2-A2P6-01 | Breast | breast invasive carcinoma | Female | >=65 | I/II | Hormone Therapy | anastrozole | SD |


