
|
|||||
|
 | |
| |
| |
| |
| |
| |
|
Gene: UBR1 |
Gene summary for UBR1 |
| Gene information | Species | Human | Gene symbol | UBR1 | Gene ID | 197131 |
| Gene name | ubiquitin protein ligase E3 component n-recognin 1 | |
| Gene Alias | JBS | |
| Cytomap | 15q15.2 | |
| Gene Type | protein-coding | GO ID | GO:0001101 | UniProtAcc | Q8IWV7 |
Top |
Malignant transformation analysis |
| Identification of the aberrant gene expression in precancerous and cancerous lesions by comparing the gene expression of stem-like cells in diseased tissues with normal stem cells |
| Entrez ID | Symbol | Replicates | Species | Organ | Tissue | Adj P-value | Log2FC | Malignancy |
| 197131 | UBR1 | HTA11_3410_2000001011 | Human | Colorectum | AD | 5.77e-08 | -3.80e-01 | 0.0155 |
| 197131 | UBR1 | HTA11_99999974143_84620 | Human | Colorectum | MSS | 3.75e-02 | -2.51e-01 | 0.3005 |
| 197131 | UBR1 | F007 | Human | Colorectum | FAP | 1.01e-05 | -3.73e-01 | 0.1176 |
| 197131 | UBR1 | A015-C-203 | Human | Colorectum | FAP | 4.60e-21 | -4.28e-01 | -0.1294 |
| 197131 | UBR1 | A015-C-204 | Human | Colorectum | FAP | 1.09e-10 | -4.08e-01 | -0.0228 |
| 197131 | UBR1 | A014-C-040 | Human | Colorectum | FAP | 7.89e-04 | -3.05e-01 | -0.1184 |
| 197131 | UBR1 | A002-C-201 | Human | Colorectum | FAP | 3.00e-15 | -2.85e-01 | 0.0324 |
| 197131 | UBR1 | A002-C-203 | Human | Colorectum | FAP | 2.84e-02 | -2.03e-01 | 0.2786 |
| 197131 | UBR1 | A001-C-119 | Human | Colorectum | FAP | 4.55e-06 | -2.22e-01 | -0.1557 |
| 197131 | UBR1 | A001-C-108 | Human | Colorectum | FAP | 8.23e-10 | -2.26e-01 | -0.0272 |
| 197131 | UBR1 | A002-C-205 | Human | Colorectum | FAP | 1.76e-19 | -3.80e-01 | -0.1236 |
| 197131 | UBR1 | A015-C-005 | Human | Colorectum | FAP | 7.18e-07 | -2.90e-01 | -0.0336 |
| 197131 | UBR1 | A015-C-006 | Human | Colorectum | FAP | 1.24e-15 | -3.86e-01 | -0.0994 |
| 197131 | UBR1 | A015-C-106 | Human | Colorectum | FAP | 3.30e-08 | -2.06e-01 | -0.0511 |
| 197131 | UBR1 | A002-C-114 | Human | Colorectum | FAP | 4.04e-19 | -4.28e-01 | -0.1561 |
| 197131 | UBR1 | A015-C-104 | Human | Colorectum | FAP | 4.58e-23 | -4.07e-01 | -0.1899 |
| 197131 | UBR1 | A001-C-014 | Human | Colorectum | FAP | 2.62e-10 | -2.31e-01 | 0.0135 |
| 197131 | UBR1 | A002-C-016 | Human | Colorectum | FAP | 1.27e-15 | -3.23e-01 | 0.0521 |
| 197131 | UBR1 | A015-C-002 | Human | Colorectum | FAP | 2.86e-12 | -4.03e-01 | -0.0763 |
| 197131 | UBR1 | A001-C-203 | Human | Colorectum | FAP | 5.72e-08 | -2.75e-01 | -0.0481 |
| Page: 1 2 3 |
| Tissue | Expression Dynamics | Abbreviation |
| Colorectum (GSE201348) |  | FAP: Familial adenomatous polyposis |
| CRC: Colorectal cancer | ||
| Colorectum (HTA11) |  | AD: Adenomas |
| SER: Sessile serrated lesions | ||
| MSI-H: Microsatellite-high colorectal cancer | ||
| MSS: Microsatellite stable colorectal cancer | ||
| Lung | 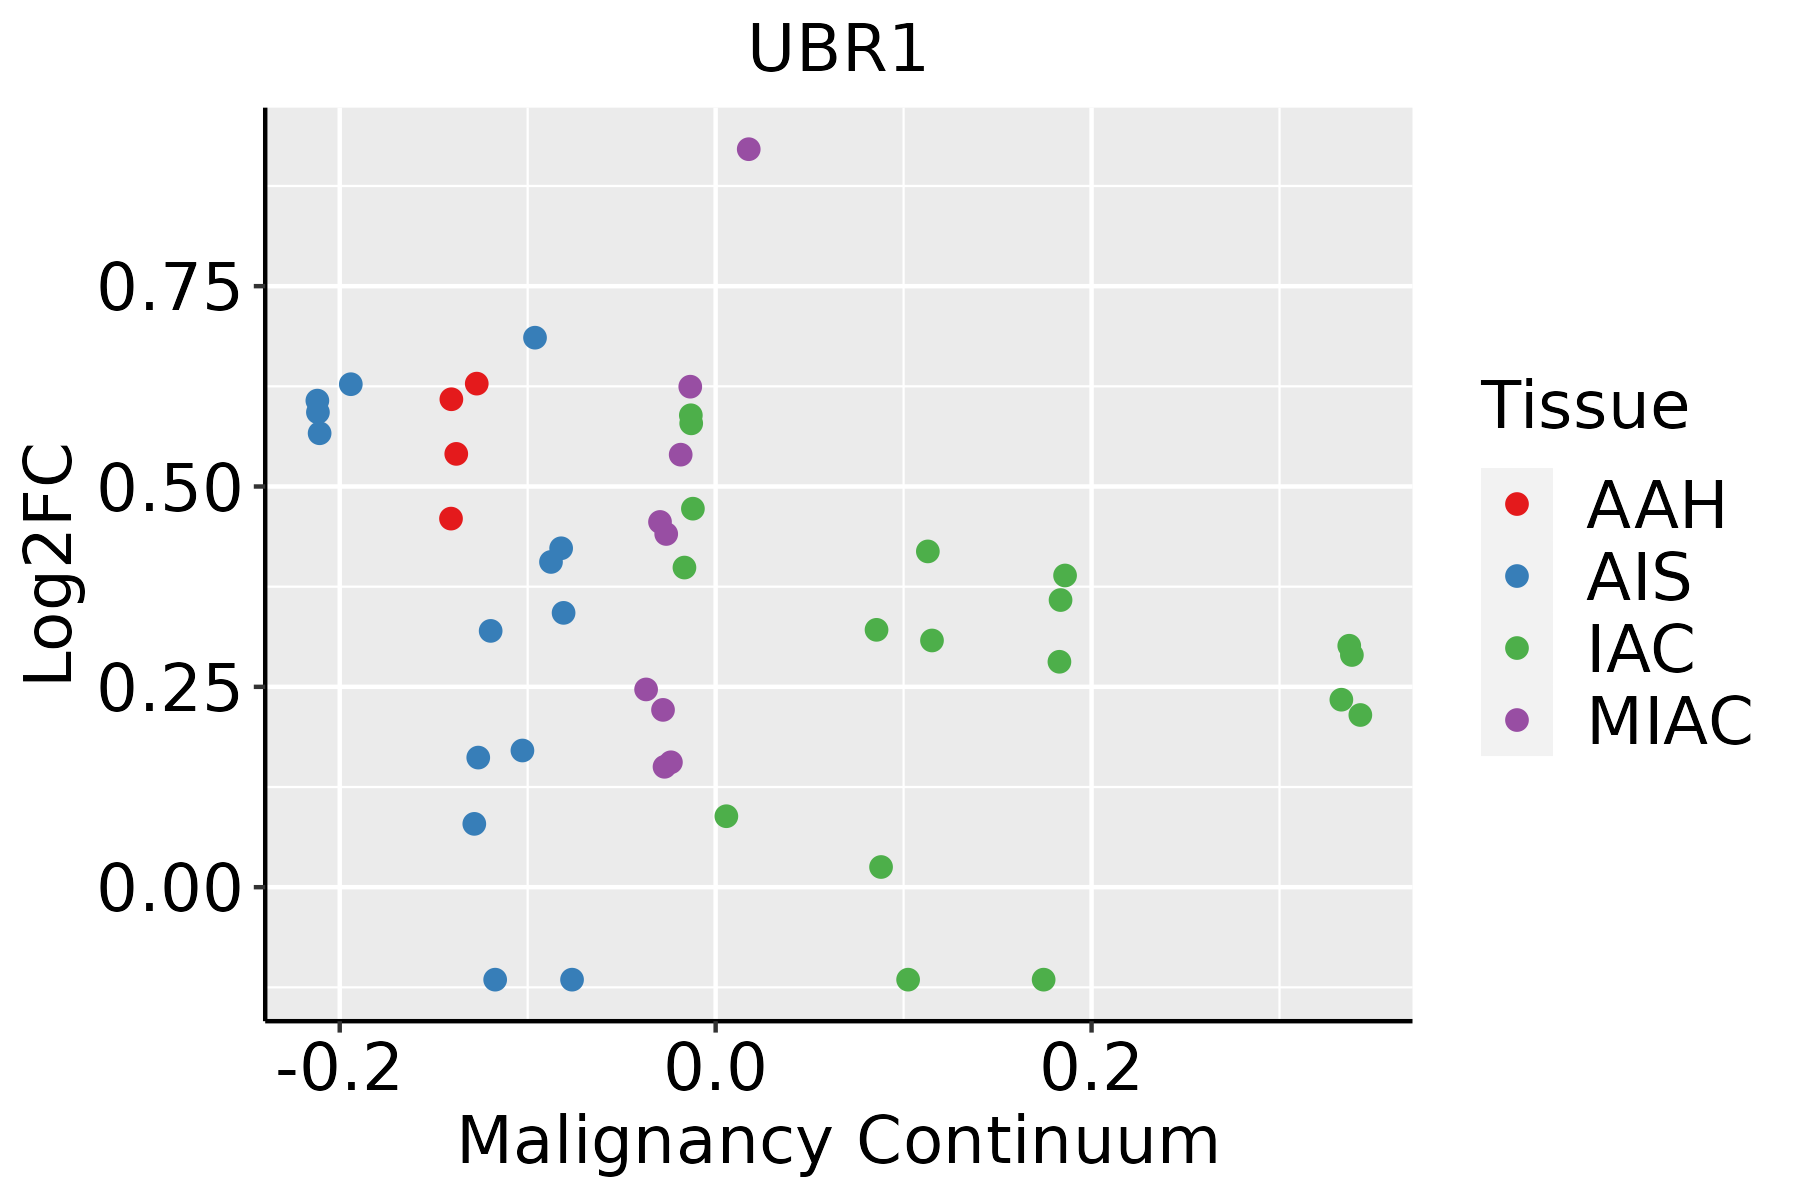 | AAH: Atypical adenomatous hyperplasia |
| AIS: Adenocarcinoma in situ | ||
| IAC: Invasive lung adenocarcinoma | ||
| MIA: Minimally invasive adenocarcinoma |
| ∗log2FC in expression of this searched gene in stem-like cells from each diseased tissue sample relative to stem-like cells in normal samples in each tissue plotted against the malignancy continuum. Samples are colored based on if they are from different disease stage. |
Top |
Malignant transformation related pathway analysis |
| Find out the enriched GO biological processes and KEGG pathways involved in transition from healthy to precancer to cancer |
| Tissue | Disease Stage | Enriched GO biological Processes |
| Colorectum | AD |  |
| Colorectum | SER |  |
| Colorectum | MSS |  |
| Colorectum | MSI-H |  |
| Colorectum | FAP |  |
| ∗Top 15 enriched GO BP terms are showed in the bar plot of each disease state in each tissue. Each row represents a significant GO biological process which is colored according to the -log10(p.adjust). |
| Page: 1 2 3 4 5 6 7 8 9 |
| GO ID | Tissue | Disease Stage | Description | Gene Ratio | Bg Ratio | pvalue | p.adjust | Count |
| GO:0010498 | Colorectum | AD | proteasomal protein catabolic process | 174/3918 | 490/18723 | 3.18e-14 | 7.66e-12 | 174 |
| GO:0043161 | Colorectum | AD | proteasome-mediated ubiquitin-dependent protein catabolic process | 141/3918 | 412/18723 | 1.77e-10 | 1.68e-08 | 141 |
| GO:00104982 | Colorectum | MSS | proteasomal protein catabolic process | 157/3467 | 490/18723 | 2.39e-13 | 5.25e-11 | 157 |
| GO:00431612 | Colorectum | MSS | proteasome-mediated ubiquitin-dependent protein catabolic process | 127/3467 | 412/18723 | 7.70e-10 | 6.32e-08 | 127 |
| GO:0031929 | Colorectum | MSS | TOR signaling | 35/3467 | 126/18723 | 6.91e-03 | 4.44e-02 | 35 |
| GO:00431614 | Colorectum | FAP | proteasome-mediated ubiquitin-dependent protein catabolic process | 98/2622 | 412/18723 | 5.41e-08 | 4.20e-06 | 98 |
| GO:00104984 | Colorectum | FAP | proteasomal protein catabolic process | 110/2622 | 490/18723 | 2.12e-07 | 1.26e-05 | 110 |
| GO:00431615 | Colorectum | CRC | proteasome-mediated ubiquitin-dependent protein catabolic process | 69/2078 | 412/18723 | 3.16e-04 | 4.90e-03 | 69 |
| GO:00104985 | Colorectum | CRC | proteasomal protein catabolic process | 77/2078 | 490/18723 | 1.03e-03 | 1.21e-02 | 77 |
| GO:00104988 | Lung | IAC | proteasomal protein catabolic process | 90/2061 | 490/18723 | 6.69e-07 | 3.89e-05 | 90 |
| GO:00431618 | Lung | IAC | proteasome-mediated ubiquitin-dependent protein catabolic process | 78/2061 | 412/18723 | 1.10e-06 | 6.02e-05 | 78 |
| GO:00011014 | Lung | IAC | response to acid chemical | 25/2061 | 135/18723 | 6.31e-03 | 4.51e-02 | 25 |
| GO:004316113 | Lung | AIS | proteasome-mediated ubiquitin-dependent protein catabolic process | 77/1849 | 412/18723 | 2.74e-08 | 3.47e-06 | 77 |
| GO:001049813 | Lung | AIS | proteasomal protein catabolic process | 87/1849 | 490/18723 | 4.15e-08 | 5.03e-06 | 87 |
| Page: 1 |
| Pathway ID | Tissue | Disease Stage | Description | Gene Ratio | Bg Ratio | pvalue | p.adjust | qvalue | Count |
| Page: 1 |
Top |
Cell-cell communication analysis |
| Identification of potential cell-cell interactions between two cell types and their ligand-receptor pairs for different disease states |
| Ligand | Receptor | LRpair | Pathway | Tissue | Disease Stage |
| Page: 1 |
Top |
Single-cell gene regulatory network inference analysis |
| Find out the significant the regulons (TFs) and the target genes of each regulon across cell types for different disease states |
| TF | Cell Type | Tissue | Disease Stage | Target Gene | RSS | Regulon Activity |
| ∗The dot plots of a searched regulon are shown for all cell subpopulations in each disease state of each tissue based on the regulon specific score inferred using pySCENIC and by calculating the average expression. |
| Page: 1 |
Top |
Somatic mutation of malignant transformation related genes |
| Annotation of somatic variants for genes involved in malignant transformation |
| Hugo Symbol | Variant Class | Variant Classification | dbSNP RS | HGVSc | HGVSp | HGVSp Short | SWISSPROT | BIOTYPE | SIFT | PolyPhen | Tumor Sample Barcode | Tissue | Histology | Sex | Age | Stage | Therapy Types | Drugs | Outcome |
| UBR1 | SNV | Missense_Mutation | novel | c.781N>G | p.Thr261Ala | p.T261A | Q8IWV7 | protein_coding | tolerated(0.08) | benign(0.063) | TCGA-A7-A4SF-01 | Breast | breast invasive carcinoma | Female | <65 | I/II | Chemotherapy | carboplatin | CR |
| UBR1 | SNV | Missense_Mutation | c.3841G>A | p.Glu1281Lys | p.E1281K | Q8IWV7 | protein_coding | tolerated(0.27) | benign(0.003) | TCGA-A8-A092-01 | Breast | breast invasive carcinoma | Female | <65 | III/IV | Chemotherapy | paclitaxel | CR | |
| UBR1 | SNV | Missense_Mutation | c.1353G>T | p.Glu451Asp | p.E451D | Q8IWV7 | protein_coding | tolerated(0.08) | benign(0.028) | TCGA-AO-A0JB-01 | Breast | breast invasive carcinoma | Female | <65 | III/IV | Chemotherapy | cyclophosphamide | SD | |
| UBR1 | SNV | Missense_Mutation | c.88N>T | p.Asp30Tyr | p.D30Y | Q8IWV7 | protein_coding | tolerated(0.1) | benign(0.125) | TCGA-AO-A1KR-01 | Breast | breast invasive carcinoma | Female | <65 | I/II | Chemotherapy | cyclophosphamide | SD | |
| UBR1 | SNV | Missense_Mutation | novel | c.4259A>T | p.Asp1420Val | p.D1420V | Q8IWV7 | protein_coding | deleterious(0) | possibly_damaging(0.796) | TCGA-C8-A26Y-01 | Breast | breast invasive carcinoma | Female | >=65 | I/II | Unknown | Unknown | SD |
| UBR1 | SNV | Missense_Mutation | c.4258G>A | p.Asp1420Asn | p.D1420N | Q8IWV7 | protein_coding | deleterious(0.04) | possibly_damaging(0.631) | TCGA-C8-A26Y-01 | Breast | breast invasive carcinoma | Female | >=65 | I/II | Unknown | Unknown | SD | |
| UBR1 | SNV | Missense_Mutation | c.3870C>G | p.Ile1290Met | p.I1290M | Q8IWV7 | protein_coding | tolerated(0.09) | possibly_damaging(0.853) | TCGA-EW-A1J5-01 | Breast | breast invasive carcinoma | Female | <65 | I/II | Chemotherapy | adriamycin | SD | |
| UBR1 | SNV | Missense_Mutation | novel | c.761C>A | p.Ala254Glu | p.A254E | Q8IWV7 | protein_coding | tolerated(0.22) | benign(0.197) | TCGA-OL-A6VQ-01 | Breast | breast invasive carcinoma | Female | <65 | I/II | Unknown | Unknown | SD |
| UBR1 | insertion | Frame_Shift_Ins | novel | c.3159_3160insGAGAT | p.Asn1054GlufsTer45 | p.N1054Efs*45 | Q8IWV7 | protein_coding | TCGA-A8-A09T-01 | Breast | breast invasive carcinoma | Female | >=65 | I/II | Hormone Therapy | anastrozole | SD | ||
| UBR1 | insertion | Frame_Shift_Ins | novel | c.3158_3159insGGTGGAGGTTGTAGCAAGC | p.Asp1053GlufsTer30 | p.D1053Efs*30 | Q8IWV7 | protein_coding | TCGA-A8-A09T-01 | Breast | breast invasive carcinoma | Female | >=65 | I/II | Hormone Therapy | anastrozole | SD |
| Page: 1 2 3 4 5 6 7 8 9 10 11 12 13 14 15 16 |
Top |
Related drugs of malignant transformation related genes |
| Identification of chemicals and drugs interact with genes involved in malignant transfromation |
| (DGIdb 4.0) |
| Entrez ID | Symbol | Category | Interaction Types | Drug Claim Name | Drug Name | PMIDs |
| 197131 | UBR1 | ENZYME | DEXAMETHASONE | DEXAMETHASONE | 17264220 |
| Page: 1 |

Copyright 2023-Present -The University of Texas Health Science Center at Houston |