
|
|||||
|
 | |
| |
| |
| |
| |
| |
|
Gene: UBQLN2 |
Gene summary for UBQLN2 |
| Gene information | Species | Human | Gene symbol | UBQLN2 | Gene ID | 29978 |
| Gene name | ubiquilin 2 | |
| Gene Alias | ALS15 | |
| Cytomap | Xp11.21 | |
| Gene Type | protein-coding | GO ID | GO:0000045 | UniProtAcc | Q9UHD9 |
Top |
Malignant transformation analysis |
| Identification of the aberrant gene expression in precancerous and cancerous lesions by comparing the gene expression of stem-like cells in diseased tissues with normal stem cells |
| Entrez ID | Symbol | Replicates | Species | Organ | Tissue | Adj P-value | Log2FC | Malignancy |
| 29978 | UBQLN2 | LZE4T | Human | Esophagus | ESCC | 2.46e-07 | 1.88e-01 | 0.0811 |
| 29978 | UBQLN2 | LZE20T | Human | Esophagus | ESCC | 2.09e-07 | 1.75e-01 | 0.0662 |
| 29978 | UBQLN2 | LZE22D1 | Human | Esophagus | HGIN | 6.33e-04 | 8.10e-02 | 0.0595 |
| 29978 | UBQLN2 | LZE22T | Human | Esophagus | ESCC | 4.01e-02 | 3.09e-01 | 0.068 |
| 29978 | UBQLN2 | LZE24T | Human | Esophagus | ESCC | 4.95e-19 | 5.32e-01 | 0.0596 |
| 29978 | UBQLN2 | P2T-E | Human | Esophagus | ESCC | 9.23e-24 | 5.21e-01 | 0.1177 |
| 29978 | UBQLN2 | P4T-E | Human | Esophagus | ESCC | 1.71e-22 | 2.81e-01 | 0.1323 |
| 29978 | UBQLN2 | P5T-E | Human | Esophagus | ESCC | 1.47e-19 | 1.43e-01 | 0.1327 |
| 29978 | UBQLN2 | P8T-E | Human | Esophagus | ESCC | 2.33e-17 | 3.41e-01 | 0.0889 |
| 29978 | UBQLN2 | P9T-E | Human | Esophagus | ESCC | 1.64e-20 | 5.77e-01 | 0.1131 |
| 29978 | UBQLN2 | P10T-E | Human | Esophagus | ESCC | 5.92e-17 | 1.47e-01 | 0.116 |
| 29978 | UBQLN2 | P11T-E | Human | Esophagus | ESCC | 1.81e-14 | 3.82e-01 | 0.1426 |
| 29978 | UBQLN2 | P12T-E | Human | Esophagus | ESCC | 1.02e-23 | 5.30e-01 | 0.1122 |
| 29978 | UBQLN2 | P15T-E | Human | Esophagus | ESCC | 1.98e-10 | 2.49e-01 | 0.1149 |
| 29978 | UBQLN2 | P16T-E | Human | Esophagus | ESCC | 1.13e-29 | 4.91e-01 | 0.1153 |
| 29978 | UBQLN2 | P17T-E | Human | Esophagus | ESCC | 2.90e-07 | 2.86e-01 | 0.1278 |
| 29978 | UBQLN2 | P19T-E | Human | Esophagus | ESCC | 2.96e-12 | 6.56e-01 | 0.1662 |
| 29978 | UBQLN2 | P20T-E | Human | Esophagus | ESCC | 3.19e-21 | 3.66e-01 | 0.1124 |
| 29978 | UBQLN2 | P21T-E | Human | Esophagus | ESCC | 4.53e-10 | 1.25e-01 | 0.1617 |
| 29978 | UBQLN2 | P22T-E | Human | Esophagus | ESCC | 1.87e-24 | 5.02e-01 | 0.1236 |
| Page: 1 2 3 4 5 |
| Tissue | Expression Dynamics | Abbreviation |
| Esophagus | 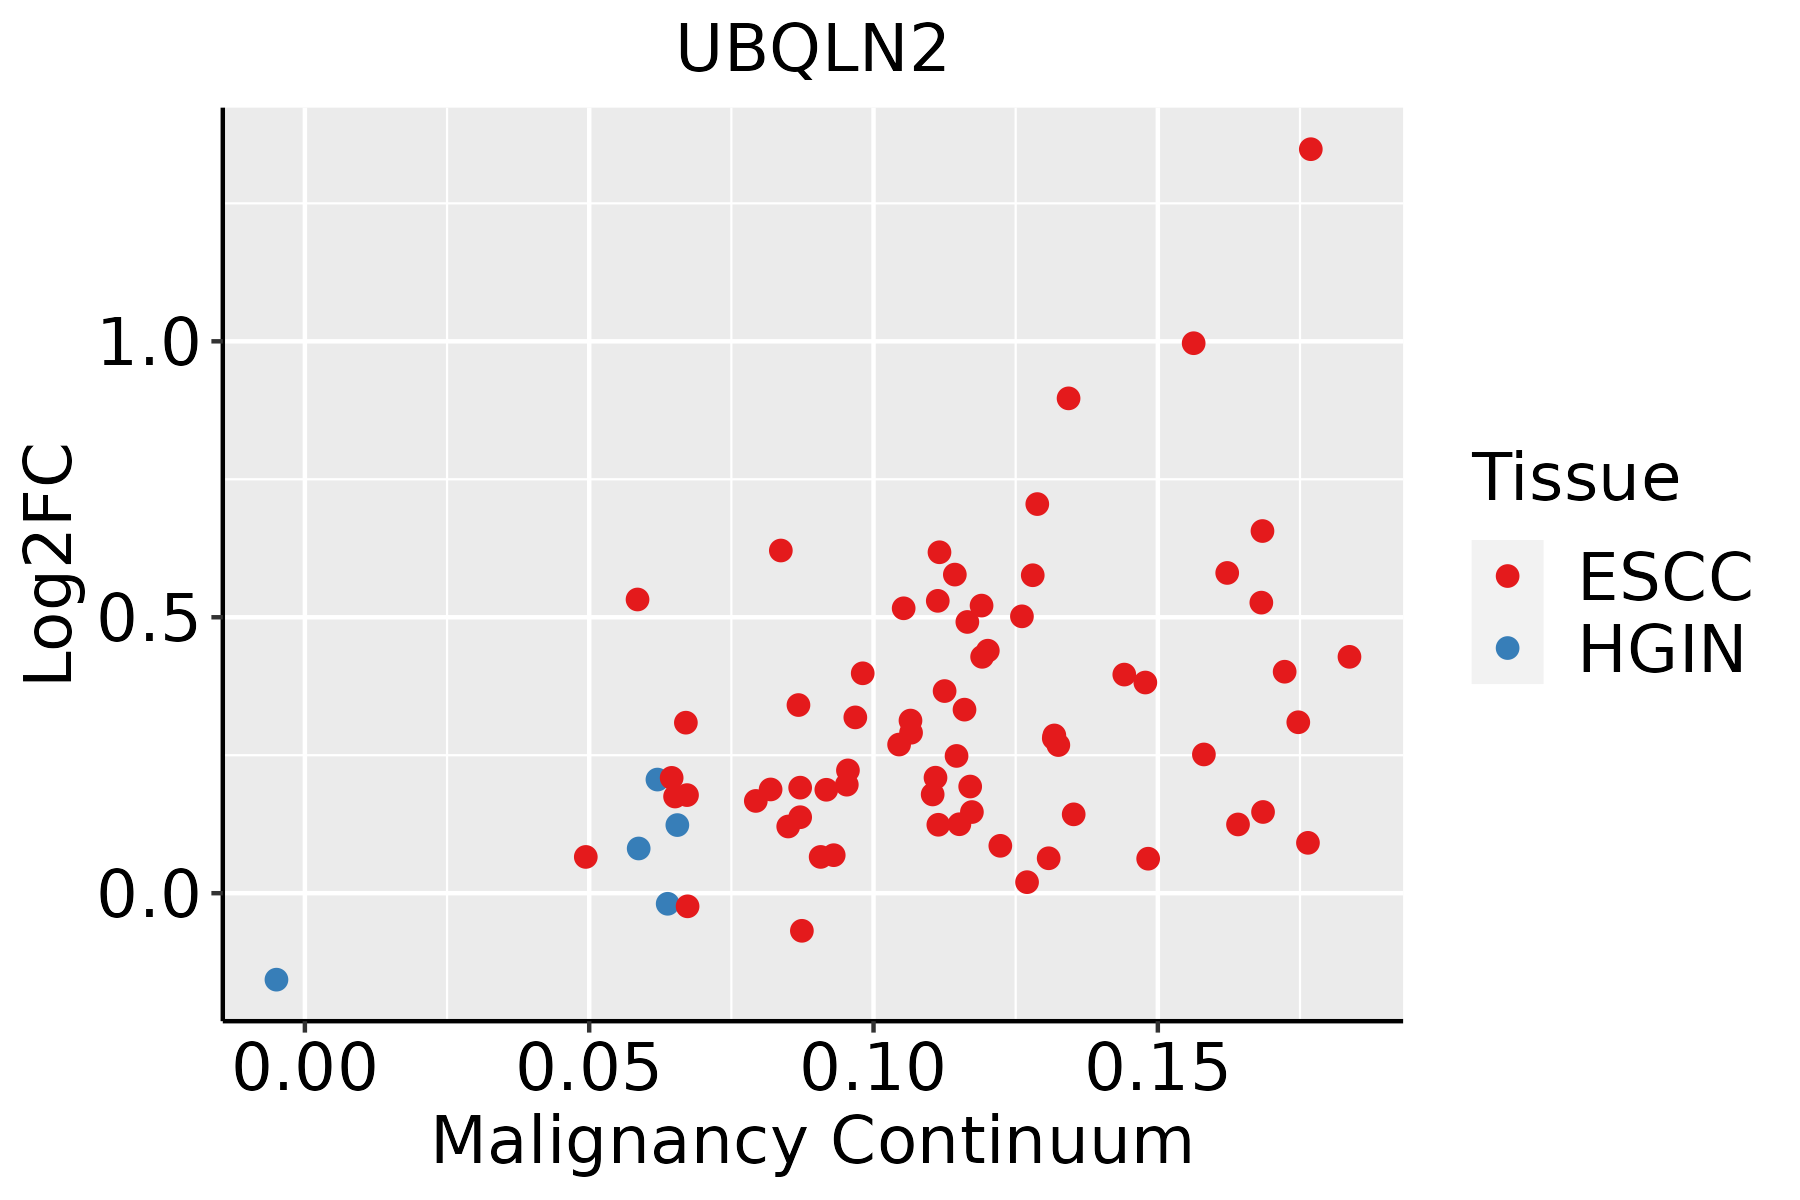 | ESCC: Esophageal squamous cell carcinoma |
| HGIN: High-grade intraepithelial neoplasias | ||
| LGIN: Low-grade intraepithelial neoplasias | ||
| Liver | 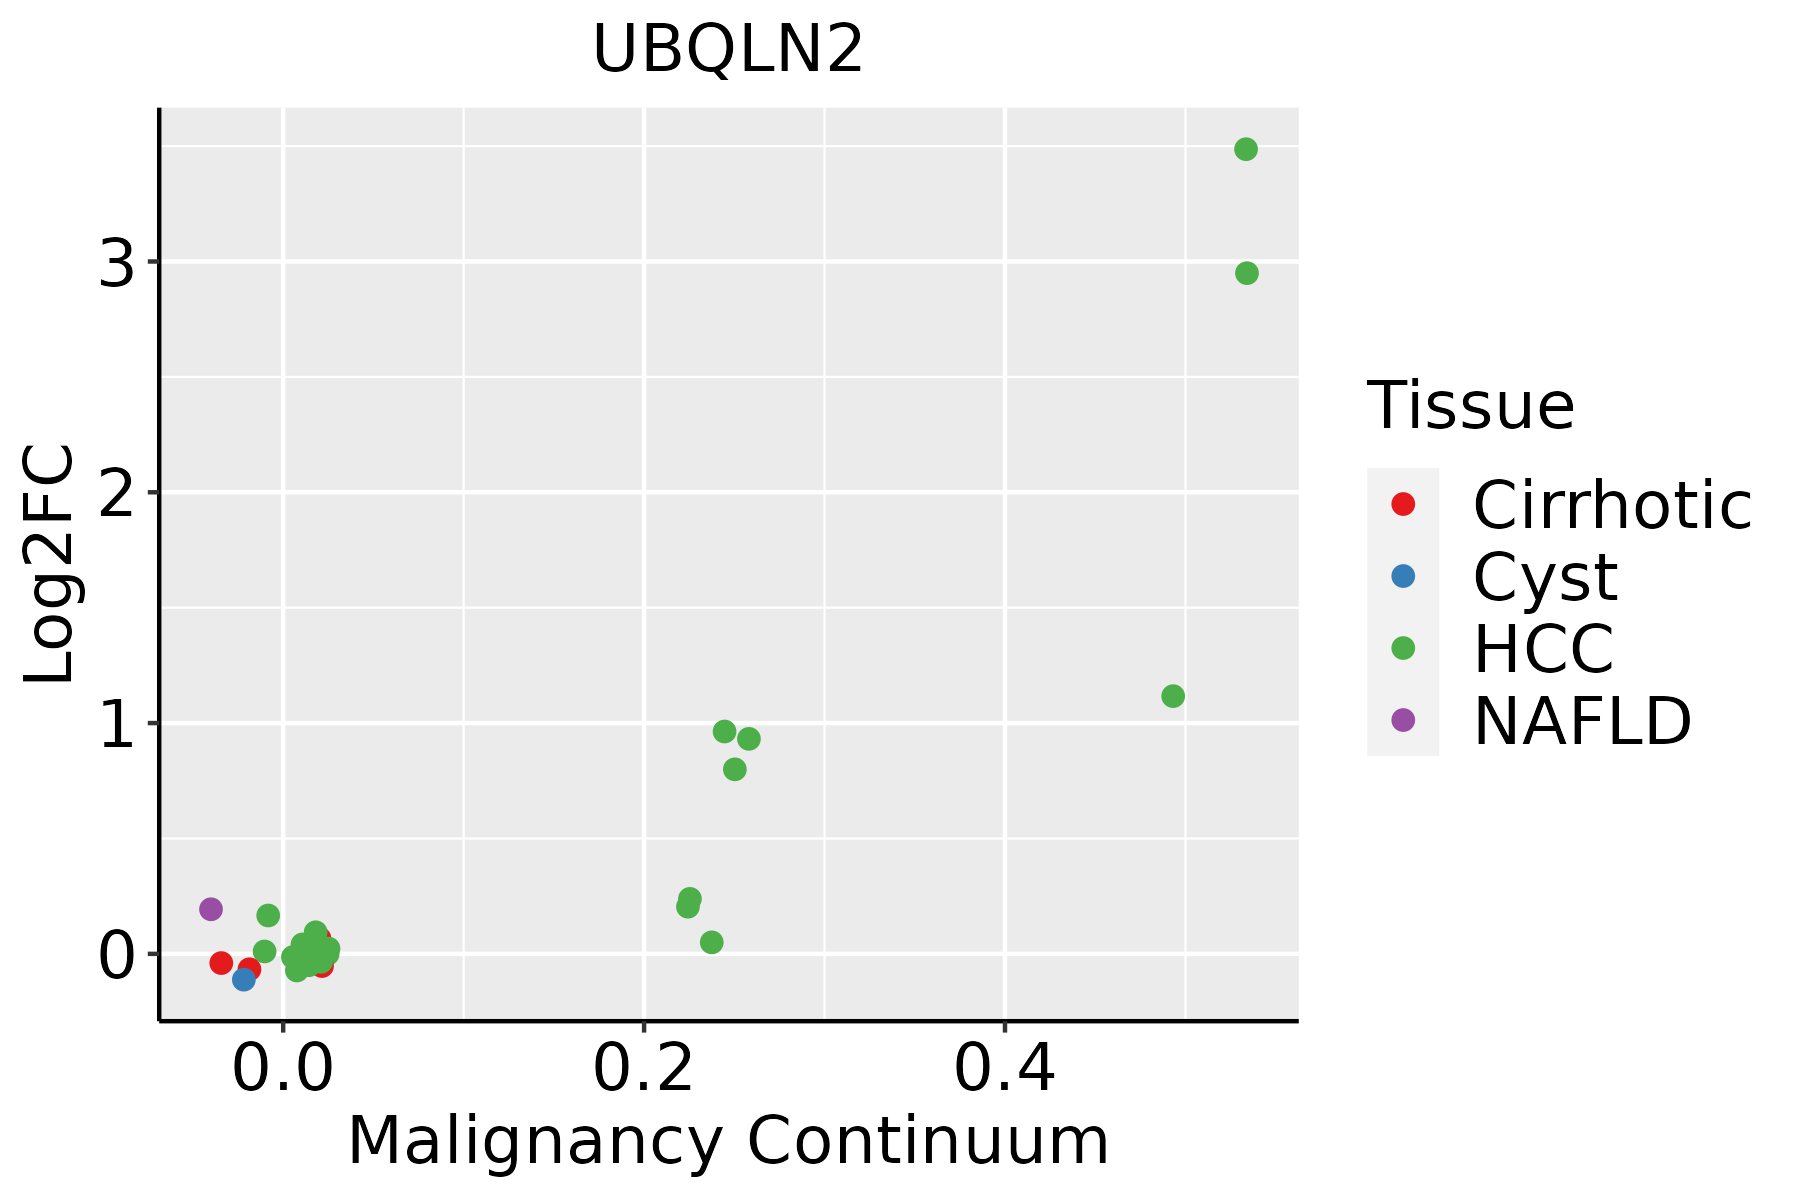 | HCC: Hepatocellular carcinoma |
| NAFLD: Non-alcoholic fatty liver disease | ||
| Oral Cavity |  | EOLP: Erosive Oral lichen planus |
| LP: leukoplakia | ||
| NEOLP: Non-erosive oral lichen planus | ||
| OSCC: Oral squamous cell carcinoma | ||
| Skin | 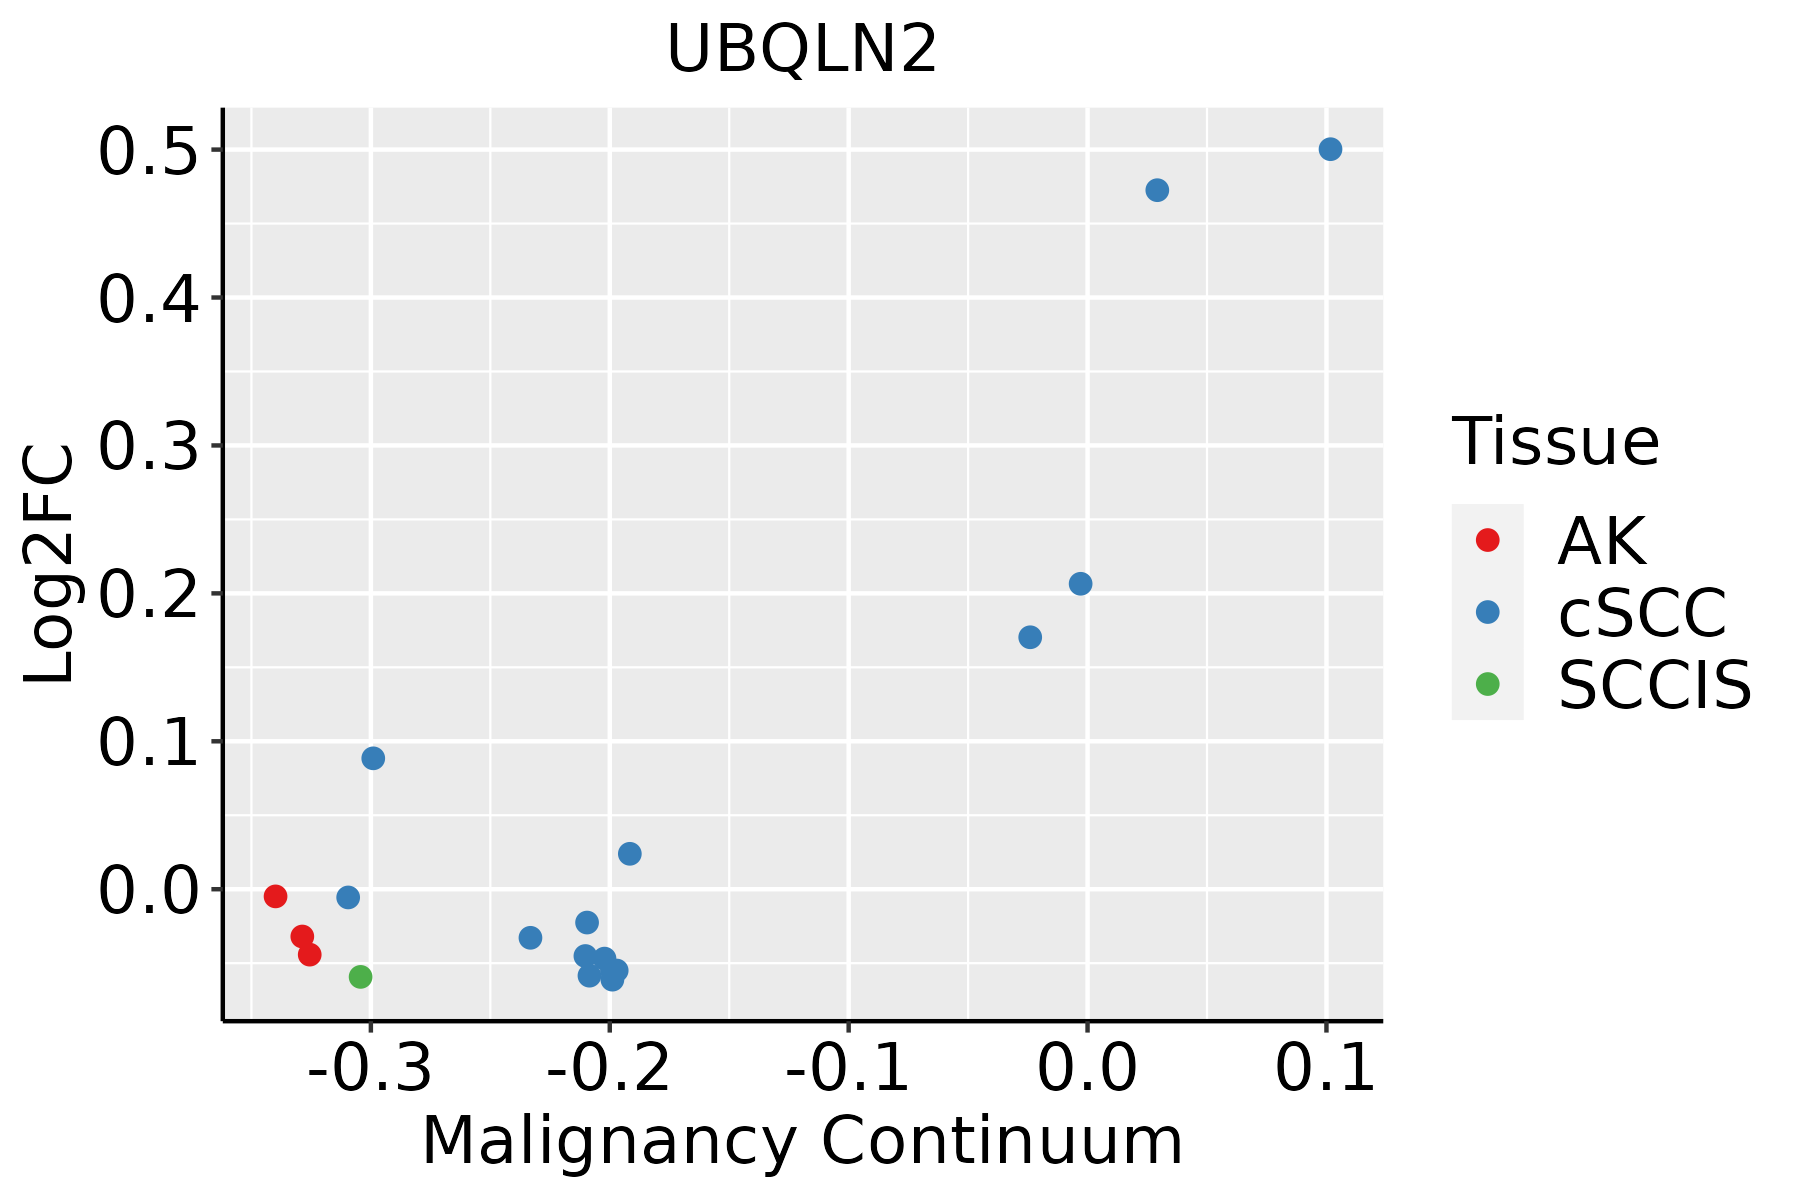 | AK: Actinic keratosis |
| cSCC: Cutaneous squamous cell carcinoma | ||
| SCCIS:squamous cell carcinoma in situ | ||
| Thyroid | 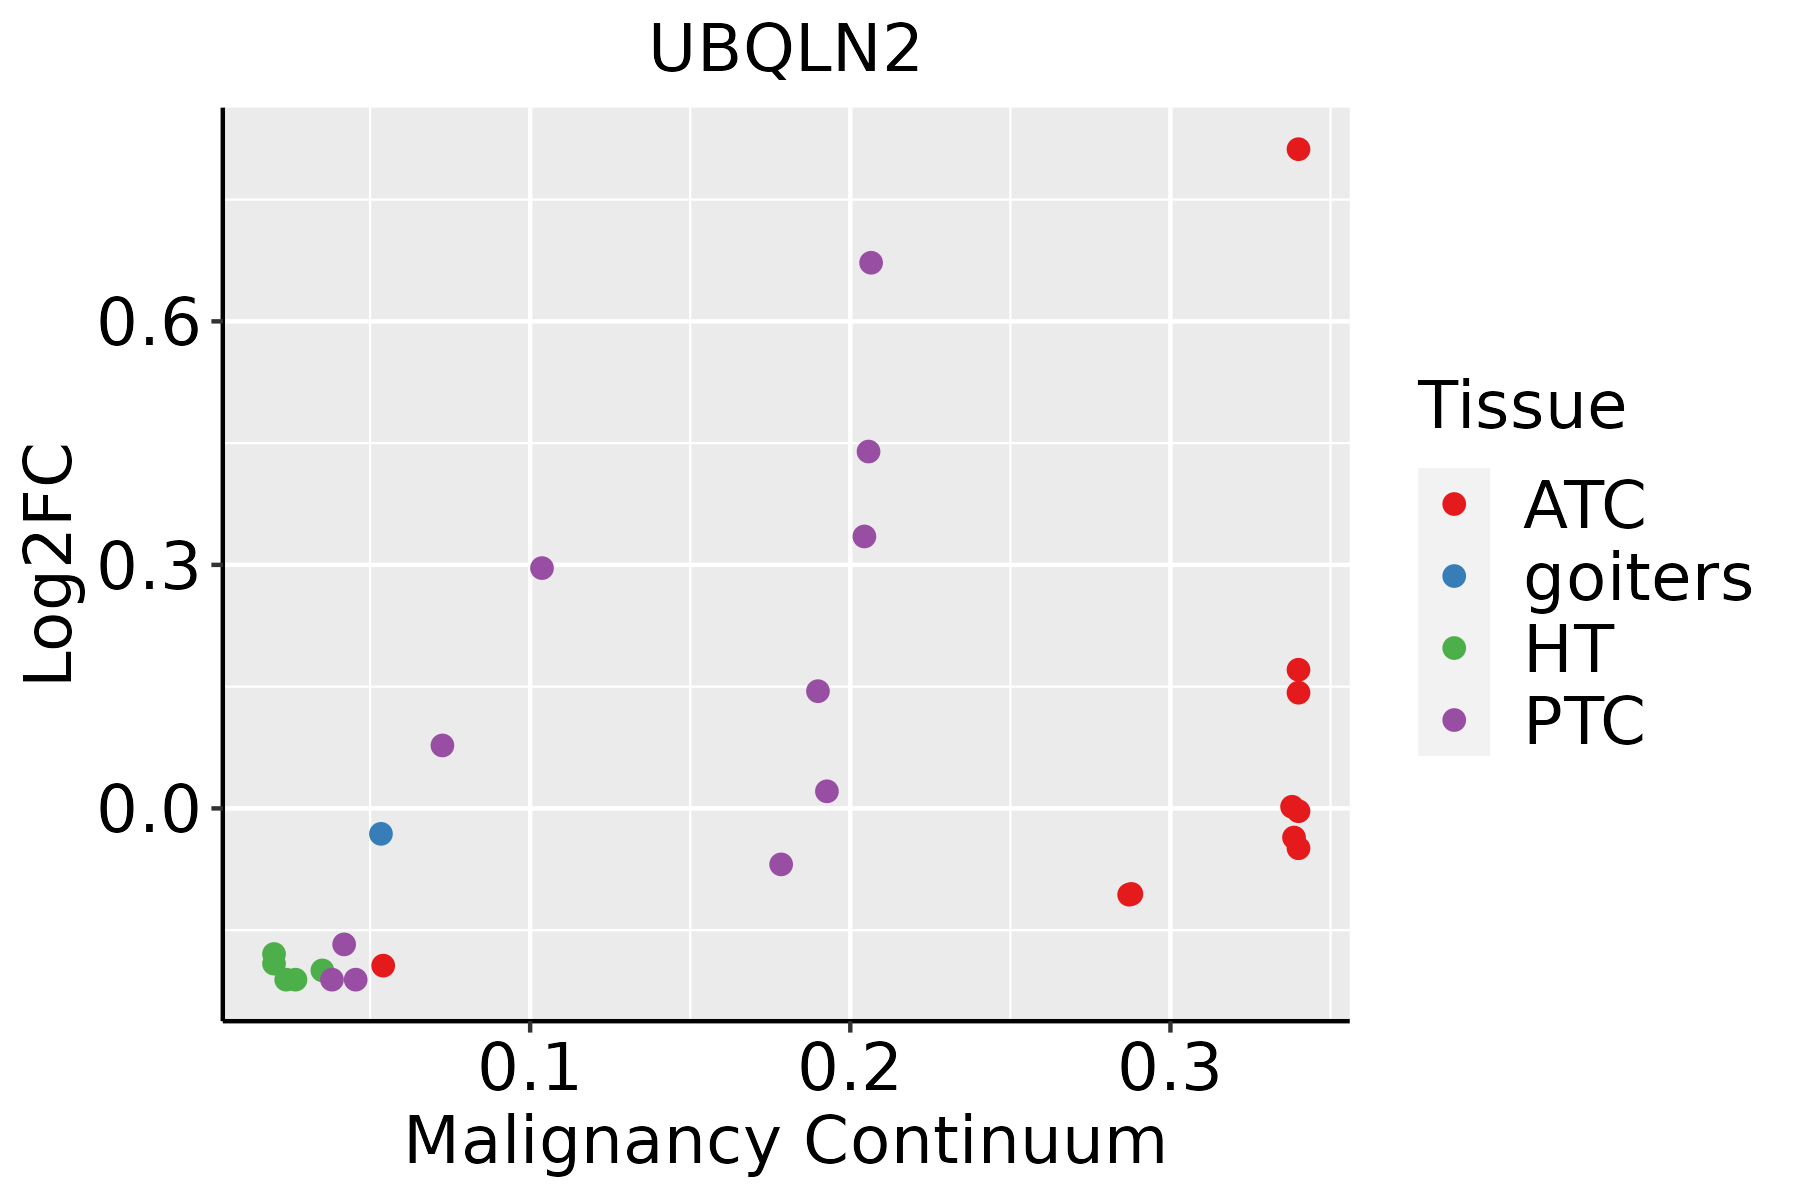 | ATC: Anaplastic thyroid cancer |
| HT: Hashimoto's thyroiditis | ||
| PTC: Papillary thyroid cancer |
| ∗log2FC in expression of this searched gene in stem-like cells from each diseased tissue sample relative to stem-like cells in normal samples in each tissue plotted against the malignancy continuum. Samples are colored based on if they are from different disease stage. |
Top |
Malignant transformation related pathway analysis |
| Find out the enriched GO biological processes and KEGG pathways involved in transition from healthy to precancer to cancer |
| Tissue | Disease Stage | Enriched GO biological Processes |
| Colorectum | AD |  |
| Colorectum | SER |  |
| Colorectum | MSS |  |
| Colorectum | MSI-H |  |
| Colorectum | FAP |  |
| ∗Top 15 enriched GO BP terms are showed in the bar plot of each disease state in each tissue. Each row represents a significant GO biological process which is colored according to the -log10(p.adjust). |
| Page: 1 2 3 4 5 6 7 8 9 |
| GO ID | Tissue | Disease Stage | Description | Gene Ratio | Bg Ratio | pvalue | p.adjust | Count |
| GO:004217627 | Esophagus | HGIN | regulation of protein catabolic process | 119/2587 | 391/18723 | 8.09e-18 | 2.43e-15 | 119 |
| GO:001049826 | Esophagus | HGIN | proteasomal protein catabolic process | 139/2587 | 490/18723 | 1.20e-17 | 3.41e-15 | 139 |
| GO:004586227 | Esophagus | HGIN | positive regulation of proteolysis | 107/2587 | 372/18723 | 2.61e-14 | 4.60e-12 | 107 |
| GO:004316126 | Esophagus | HGIN | proteasome-mediated ubiquitin-dependent protein catabolic process | 114/2587 | 412/18723 | 7.00e-14 | 1.20e-11 | 114 |
| GO:190336227 | Esophagus | HGIN | regulation of cellular protein catabolic process | 81/2587 | 255/18723 | 1.16e-13 | 1.93e-11 | 81 |
| GO:003497625 | Esophagus | HGIN | response to endoplasmic reticulum stress | 81/2587 | 256/18723 | 1.47e-13 | 2.32e-11 | 81 |
| GO:000989626 | Esophagus | HGIN | positive regulation of catabolic process | 126/2587 | 492/18723 | 1.46e-12 | 2.09e-10 | 126 |
| GO:003133126 | Esophagus | HGIN | positive regulation of cellular catabolic process | 112/2587 | 427/18723 | 5.15e-12 | 6.72e-10 | 112 |
| GO:190305027 | Esophagus | HGIN | regulation of proteolysis involved in cellular protein catabolic process | 70/2587 | 221/18723 | 6.21e-12 | 7.76e-10 | 70 |
| GO:006113627 | Esophagus | HGIN | regulation of proteasomal protein catabolic process | 60/2587 | 187/18723 | 1.10e-10 | 1.12e-08 | 60 |
| GO:004573227 | Esophagus | HGIN | positive regulation of protein catabolic process | 69/2587 | 231/18723 | 1.66e-10 | 1.64e-08 | 69 |
| GO:200005827 | Esophagus | HGIN | regulation of ubiquitin-dependent protein catabolic process | 53/2587 | 164/18723 | 9.89e-10 | 8.13e-08 | 53 |
| GO:190336427 | Esophagus | HGIN | positive regulation of cellular protein catabolic process | 51/2587 | 155/18723 | 1.01e-09 | 8.15e-08 | 51 |
| GO:001050616 | Esophagus | HGIN | regulation of autophagy | 84/2587 | 317/18723 | 1.39e-09 | 1.08e-07 | 84 |
| GO:190180020 | Esophagus | HGIN | positive regulation of proteasomal protein catabolic process | 41/2587 | 114/18723 | 2.25e-09 | 1.67e-07 | 41 |
| GO:190305219 | Esophagus | HGIN | positive regulation of proteolysis involved in cellular protein catabolic process | 45/2587 | 133/18723 | 3.55e-09 | 2.53e-07 | 45 |
| GO:003243427 | Esophagus | HGIN | regulation of proteasomal ubiquitin-dependent protein catabolic process | 45/2587 | 134/18723 | 4.64e-09 | 3.12e-07 | 45 |
| GO:001623616 | Esophagus | HGIN | macroautophagy | 77/2587 | 291/18723 | 7.15e-09 | 4.61e-07 | 77 |
| GO:190589725 | Esophagus | HGIN | regulation of response to endoplasmic reticulum stress | 31/2587 | 82/18723 | 5.25e-08 | 2.91e-06 | 31 |
| GO:003243620 | Esophagus | HGIN | positive regulation of proteasomal ubiquitin-dependent protein catabolic process | 32/2587 | 90/18723 | 1.71e-07 | 8.47e-06 | 32 |
| Page: 1 2 3 4 5 6 7 8 9 10 11 12 13 14 15 |
| Pathway ID | Tissue | Disease Stage | Description | Gene Ratio | Bg Ratio | pvalue | p.adjust | qvalue | Count |
| hsa0501430 | Esophagus | HGIN | Amyotrophic lateral sclerosis | 140/1383 | 364/8465 | 2.13e-25 | 1.16e-23 | 9.19e-24 | 140 |
| hsa0414139 | Esophagus | HGIN | Protein processing in endoplasmic reticulum | 67/1383 | 174/8465 | 1.06e-12 | 2.16e-11 | 1.72e-11 | 67 |
| hsa05014113 | Esophagus | HGIN | Amyotrophic lateral sclerosis | 140/1383 | 364/8465 | 2.13e-25 | 1.16e-23 | 9.19e-24 | 140 |
| hsa04141114 | Esophagus | HGIN | Protein processing in endoplasmic reticulum | 67/1383 | 174/8465 | 1.06e-12 | 2.16e-11 | 1.72e-11 | 67 |
| hsa04141211 | Esophagus | ESCC | Protein processing in endoplasmic reticulum | 147/4205 | 174/8465 | 3.29e-22 | 1.10e-19 | 5.64e-20 | 147 |
| hsa05014210 | Esophagus | ESCC | Amyotrophic lateral sclerosis | 266/4205 | 364/8465 | 1.31e-20 | 2.20e-18 | 1.13e-18 | 266 |
| hsa04141310 | Esophagus | ESCC | Protein processing in endoplasmic reticulum | 147/4205 | 174/8465 | 3.29e-22 | 1.10e-19 | 5.64e-20 | 147 |
| hsa0501438 | Esophagus | ESCC | Amyotrophic lateral sclerosis | 266/4205 | 364/8465 | 1.31e-20 | 2.20e-18 | 1.13e-18 | 266 |
| hsa0414122 | Liver | HCC | Protein processing in endoplasmic reticulum | 146/4020 | 174/8465 | 7.34e-24 | 2.46e-21 | 1.37e-21 | 146 |
| hsa0501422 | Liver | HCC | Amyotrophic lateral sclerosis | 252/4020 | 364/8465 | 8.85e-18 | 7.41e-16 | 4.12e-16 | 252 |
| hsa0414132 | Liver | HCC | Protein processing in endoplasmic reticulum | 146/4020 | 174/8465 | 7.34e-24 | 2.46e-21 | 1.37e-21 | 146 |
| hsa0501432 | Liver | HCC | Amyotrophic lateral sclerosis | 252/4020 | 364/8465 | 8.85e-18 | 7.41e-16 | 4.12e-16 | 252 |
| hsa0414130 | Oral cavity | OSCC | Protein processing in endoplasmic reticulum | 143/3704 | 174/8465 | 6.82e-26 | 2.28e-23 | 1.16e-23 | 143 |
| hsa0501428 | Oral cavity | OSCC | Amyotrophic lateral sclerosis | 246/3704 | 364/8465 | 6.65e-21 | 1.11e-18 | 5.67e-19 | 246 |
| hsa04141113 | Oral cavity | OSCC | Protein processing in endoplasmic reticulum | 143/3704 | 174/8465 | 6.82e-26 | 2.28e-23 | 1.16e-23 | 143 |
| hsa05014112 | Oral cavity | OSCC | Amyotrophic lateral sclerosis | 246/3704 | 364/8465 | 6.65e-21 | 1.11e-18 | 5.67e-19 | 246 |
| hsa0501429 | Oral cavity | LP | Amyotrophic lateral sclerosis | 197/2418 | 364/8465 | 1.25e-25 | 1.39e-23 | 8.93e-24 | 197 |
| hsa04141210 | Oral cavity | LP | Protein processing in endoplasmic reticulum | 113/2418 | 174/8465 | 8.74e-24 | 5.82e-22 | 3.76e-22 | 113 |
| hsa0501437 | Oral cavity | LP | Amyotrophic lateral sclerosis | 197/2418 | 364/8465 | 1.25e-25 | 1.39e-23 | 8.93e-24 | 197 |
| hsa0414138 | Oral cavity | LP | Protein processing in endoplasmic reticulum | 113/2418 | 174/8465 | 8.74e-24 | 5.82e-22 | 3.76e-22 | 113 |
| Page: 1 |
Top |
Cell-cell communication analysis |
| Identification of potential cell-cell interactions between two cell types and their ligand-receptor pairs for different disease states |
| Ligand | Receptor | LRpair | Pathway | Tissue | Disease Stage |
| Page: 1 |
Top |
Single-cell gene regulatory network inference analysis |
| Find out the significant the regulons (TFs) and the target genes of each regulon across cell types for different disease states |
| TF | Cell Type | Tissue | Disease Stage | Target Gene | RSS | Regulon Activity |
| ∗The dot plots of a searched regulon are shown for all cell subpopulations in each disease state of each tissue based on the regulon specific score inferred using pySCENIC and by calculating the average expression. |
| Page: 1 |
Top |
Somatic mutation of malignant transformation related genes |
| Annotation of somatic variants for genes involved in malignant transformation |
| Hugo Symbol | Variant Class | Variant Classification | dbSNP RS | HGVSc | HGVSp | HGVSp Short | SWISSPROT | BIOTYPE | SIFT | PolyPhen | Tumor Sample Barcode | Tissue | Histology | Sex | Age | Stage | Therapy Types | Drugs | Outcome |
| UBQLN2 | SNV | Missense_Mutation | novel | c.1064C>A | p.Ala355Asp | p.A355D | Q9UHD9 | protein_coding | tolerated(0.56) | possibly_damaging(0.652) | TCGA-AN-A046-01 | Breast | breast invasive carcinoma | Female | >=65 | I/II | Unknown | Unknown | SD |
| UBQLN2 | SNV | Missense_Mutation | novel | c.572T>G | p.Val191Gly | p.V191G | Q9UHD9 | protein_coding | deleterious(0) | probably_damaging(0.922) | TCGA-AQ-A54N-01 | Breast | breast invasive carcinoma | Female | <65 | I/II | Unknown | Unknown | SD |
| UBQLN2 | SNV | Missense_Mutation | c.295N>T | p.His99Tyr | p.H99Y | Q9UHD9 | protein_coding | deleterious(0.04) | probably_damaging(0.999) | TCGA-JX-A5QV-01 | Cervix | cervical & endocervical cancer | Female | <65 | I/II | Unknown | Unknown | SD | |
| UBQLN2 | SNV | Missense_Mutation | c.926N>A | p.Arg309His | p.R309H | Q9UHD9 | protein_coding | deleterious(0.01) | probably_damaging(0.962) | TCGA-AA-3672-01 | Colorectum | colon adenocarcinoma | Female | >=65 | III/IV | Unknown | Unknown | SD | |
| UBQLN2 | SNV | Missense_Mutation | novel | c.1166N>T | p.Ala389Val | p.A389V | Q9UHD9 | protein_coding | deleterious(0) | probably_damaging(0.93) | TCGA-AA-3947-01 | Colorectum | colon adenocarcinoma | Female | <65 | I/II | Unknown | Unknown | SD |
| UBQLN2 | SNV | Missense_Mutation | novel | c.193N>G | p.Phe65Val | p.F65V | Q9UHD9 | protein_coding | deleterious(0) | probably_damaging(1) | TCGA-AA-3984-01 | Colorectum | colon adenocarcinoma | Female | <65 | I/II | Unknown | Unknown | SD |
| UBQLN2 | SNV | Missense_Mutation | c.1856T>C | p.Leu619Pro | p.L619P | Q9UHD9 | protein_coding | deleterious(0) | probably_damaging(0.993) | TCGA-CK-5916-01 | Colorectum | colon adenocarcinoma | Female | >=65 | I/II | Unknown | Unknown | PD | |
| UBQLN2 | SNV | Missense_Mutation | c.185N>T | p.Ser62Leu | p.S62L | Q9UHD9 | protein_coding | deleterious(0) | probably_damaging(1) | TCGA-DY-A1DD-01 | Colorectum | rectum adenocarcinoma | Female | >=65 | III/IV | Unknown | Unknown | SD | |
| UBQLN2 | SNV | Missense_Mutation | novel | c.114N>T | p.Lys38Asn | p.K38N | Q9UHD9 | protein_coding | deleterious(0) | probably_damaging(0.994) | TCGA-F5-6814-01 | Colorectum | rectum adenocarcinoma | Male | <65 | I/II | Unknown | Unknown | SD |
| UBQLN2 | insertion | Frame_Shift_Ins | novel | c.1417_1418insT | p.Pro474SerfsTer71 | p.P474Sfs*71 | Q9UHD9 | protein_coding | TCGA-F5-6464-01 | Colorectum | rectum adenocarcinoma | Female | >=65 | III/IV | Unknown | Unknown | SD |
| Page: 1 2 3 4 5 6 7 |
Top |
Related drugs of malignant transformation related genes |
| Identification of chemicals and drugs interact with genes involved in malignant transfromation |
| (DGIdb 4.0) |
| Entrez ID | Symbol | Category | Interaction Types | Drug Claim Name | Drug Name | PMIDs |
| Page: 1 |

Copyright 2023-Present -The University of Texas Health Science Center at Houston |