
|
|||||
|
 | |
| |
| |
| |
| |
| |
|
Gene: UBP1 |
Gene summary for UBP1 |
| Gene information | Species | Human | Gene symbol | UBP1 | Gene ID | 7342 |
| Gene name | upstream binding protein 1 | |
| Gene Alias | LBP-1B | |
| Cytomap | 3p22.3 | |
| Gene Type | protein-coding | GO ID | GO:0001525 | UniProtAcc | A0A024R2J0 |
Top |
Malignant transformation analysis |
| Identification of the aberrant gene expression in precancerous and cancerous lesions by comparing the gene expression of stem-like cells in diseased tissues with normal stem cells |
| Entrez ID | Symbol | Replicates | Species | Organ | Tissue | Adj P-value | Log2FC | Malignancy |
| 7342 | UBP1 | LZE4T | Human | Esophagus | ESCC | 5.56e-07 | 3.64e-02 | 0.0811 |
| 7342 | UBP1 | LZE7T | Human | Esophagus | ESCC | 1.01e-02 | 7.74e-02 | 0.0667 |
| 7342 | UBP1 | LZE20T | Human | Esophagus | ESCC | 2.42e-03 | -5.34e-03 | 0.0662 |
| 7342 | UBP1 | LZE24T | Human | Esophagus | ESCC | 3.00e-07 | 8.30e-02 | 0.0596 |
| 7342 | UBP1 | P2T-E | Human | Esophagus | ESCC | 6.28e-12 | -1.00e-02 | 0.1177 |
| 7342 | UBP1 | P4T-E | Human | Esophagus | ESCC | 5.23e-06 | 1.49e-01 | 0.1323 |
| 7342 | UBP1 | P5T-E | Human | Esophagus | ESCC | 2.45e-10 | 1.34e-02 | 0.1327 |
| 7342 | UBP1 | P8T-E | Human | Esophagus | ESCC | 2.85e-10 | 8.14e-02 | 0.0889 |
| 7342 | UBP1 | P9T-E | Human | Esophagus | ESCC | 2.53e-09 | 5.94e-02 | 0.1131 |
| 7342 | UBP1 | P10T-E | Human | Esophagus | ESCC | 1.60e-07 | 9.92e-02 | 0.116 |
| 7342 | UBP1 | P11T-E | Human | Esophagus | ESCC | 2.45e-09 | 1.58e-01 | 0.1426 |
| 7342 | UBP1 | P12T-E | Human | Esophagus | ESCC | 6.09e-14 | 2.86e-02 | 0.1122 |
| 7342 | UBP1 | P15T-E | Human | Esophagus | ESCC | 2.12e-10 | 1.64e-01 | 0.1149 |
| 7342 | UBP1 | P20T-E | Human | Esophagus | ESCC | 2.18e-06 | -2.37e-03 | 0.1124 |
| 7342 | UBP1 | P21T-E | Human | Esophagus | ESCC | 1.60e-11 | 8.28e-02 | 0.1617 |
| 7342 | UBP1 | P22T-E | Human | Esophagus | ESCC | 9.00e-15 | 1.48e-01 | 0.1236 |
| 7342 | UBP1 | P23T-E | Human | Esophagus | ESCC | 1.24e-09 | 1.47e-01 | 0.108 |
| 7342 | UBP1 | P24T-E | Human | Esophagus | ESCC | 9.01e-12 | 3.96e-02 | 0.1287 |
| 7342 | UBP1 | P26T-E | Human | Esophagus | ESCC | 5.43e-09 | 2.49e-02 | 0.1276 |
| 7342 | UBP1 | P27T-E | Human | Esophagus | ESCC | 4.67e-13 | 5.38e-02 | 0.1055 |
| Page: 1 2 3 4 |
| Tissue | Expression Dynamics | Abbreviation |
| Esophagus | 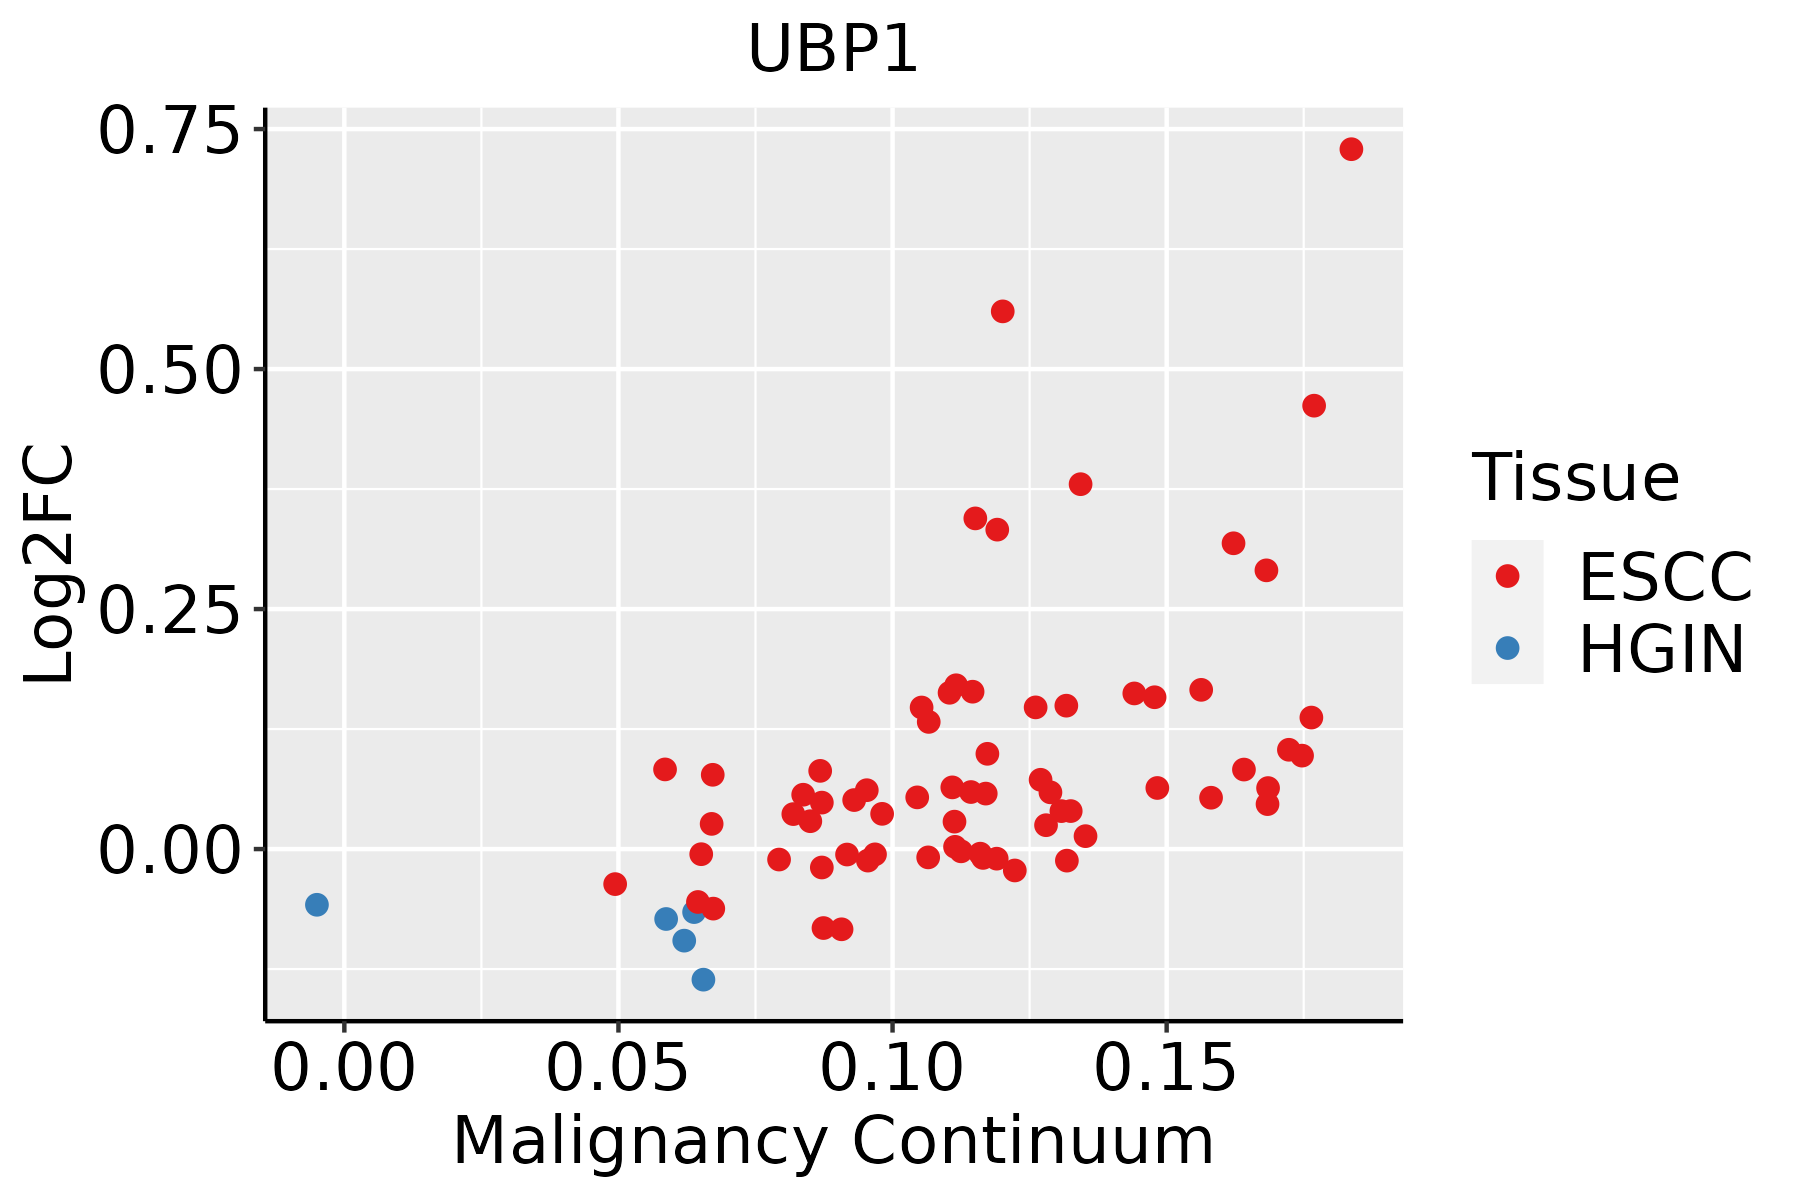 | ESCC: Esophageal squamous cell carcinoma |
| HGIN: High-grade intraepithelial neoplasias | ||
| LGIN: Low-grade intraepithelial neoplasias | ||
| Liver | 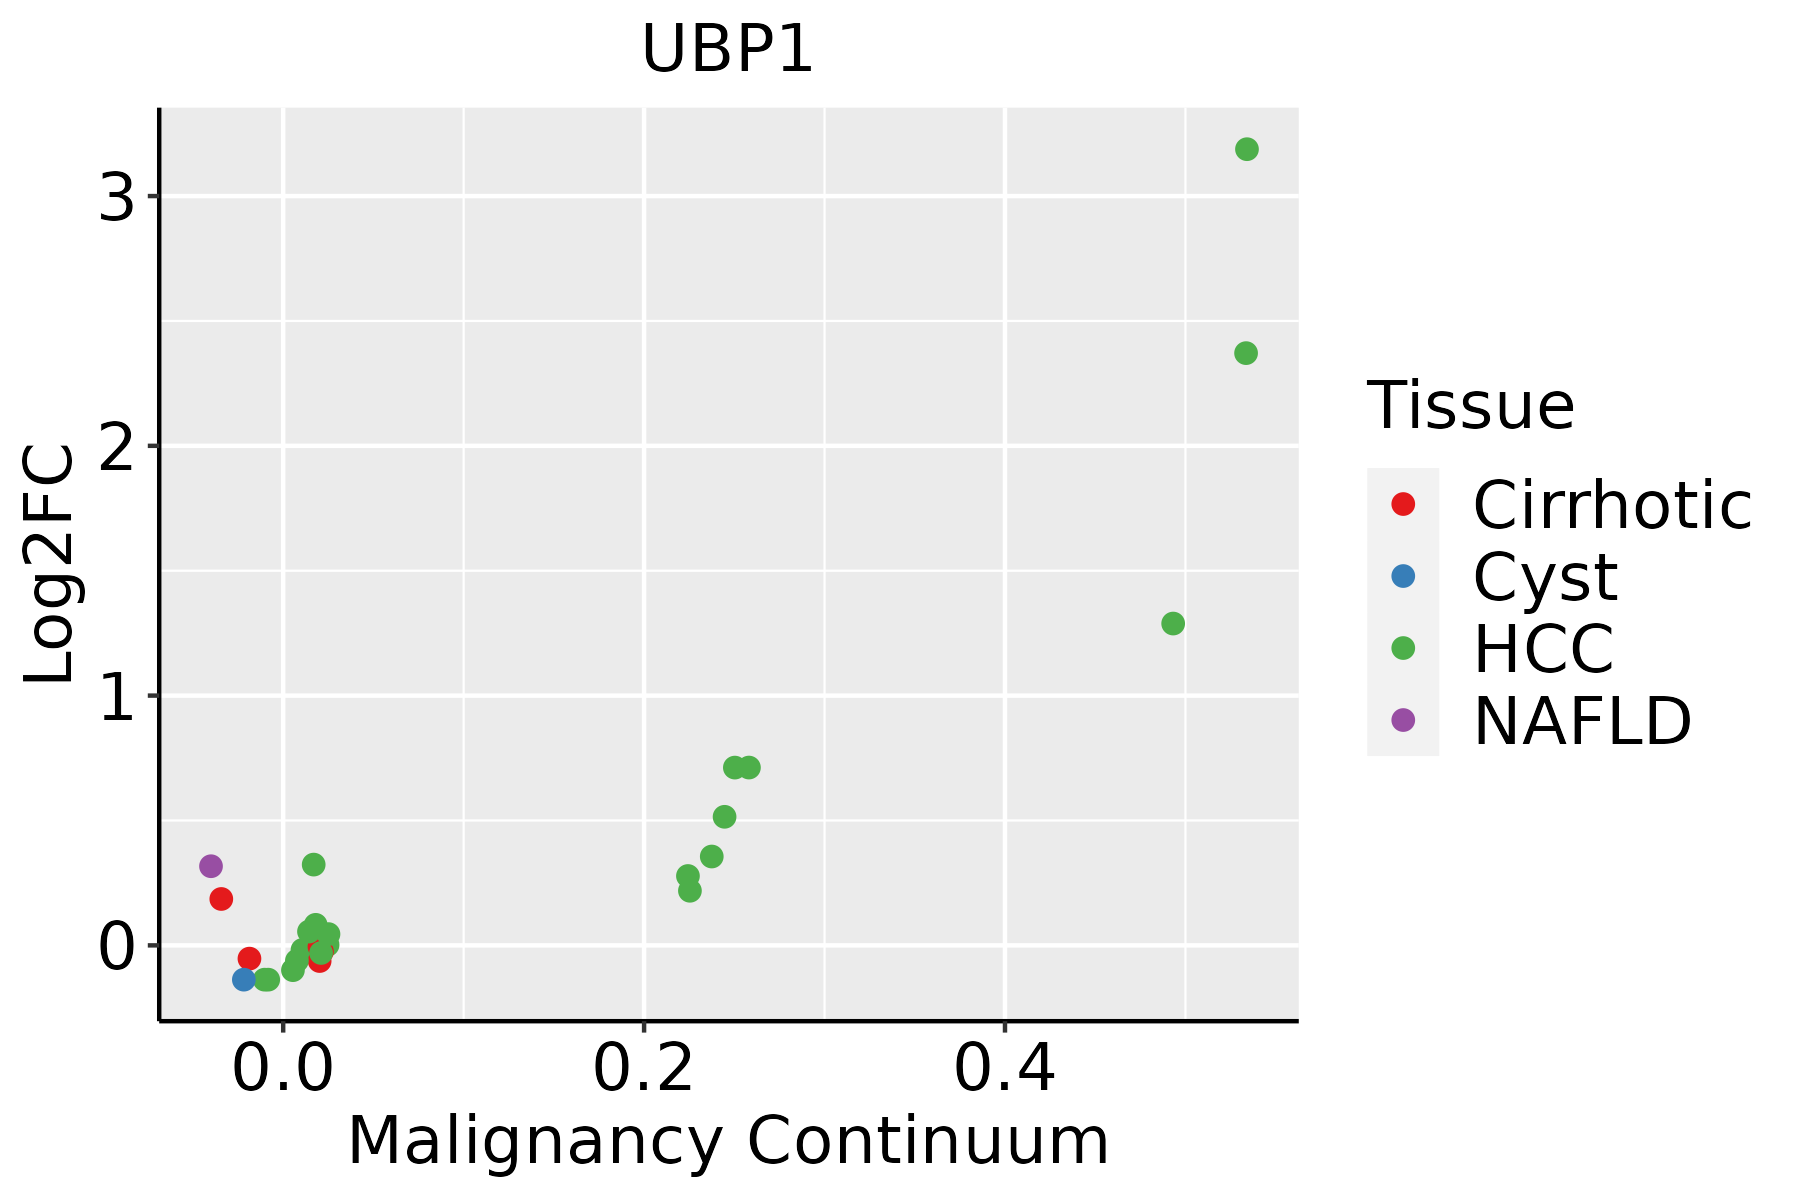 | HCC: Hepatocellular carcinoma |
| NAFLD: Non-alcoholic fatty liver disease |
| ∗log2FC in expression of this searched gene in stem-like cells from each diseased tissue sample relative to stem-like cells in normal samples in each tissue plotted against the malignancy continuum. Samples are colored based on if they are from different disease stage. |
Top |
Malignant transformation related pathway analysis |
| Find out the enriched GO biological processes and KEGG pathways involved in transition from healthy to precancer to cancer |
| Tissue | Disease Stage | Enriched GO biological Processes |
| Colorectum | AD |  |
| Colorectum | SER |  |
| Colorectum | MSS |  |
| Colorectum | MSI-H |  |
| Colorectum | FAP |  |
| ∗Top 15 enriched GO BP terms are showed in the bar plot of each disease state in each tissue. Each row represents a significant GO biological process which is colored according to the -log10(p.adjust). |
| Page: 1 2 3 4 5 6 7 8 9 |
| GO ID | Tissue | Disease Stage | Description | Gene Ratio | Bg Ratio | pvalue | p.adjust | Count |
| GO:0016032111 | Esophagus | ESCC | viral process | 301/8552 | 415/18723 | 3.34e-29 | 1.32e-26 | 301 |
| GO:001908017 | Esophagus | ESCC | viral gene expression | 80/8552 | 94/18723 | 2.04e-15 | 1.28e-13 | 80 |
| GO:199077819 | Esophagus | ESCC | protein localization to cell periphery | 217/8552 | 333/18723 | 4.08e-13 | 1.88e-11 | 217 |
| GO:0050792111 | Esophagus | ESCC | regulation of viral process | 119/8552 | 164/18723 | 2.19e-12 | 9.03e-11 | 119 |
| GO:0016049110 | Esophagus | ESCC | cell growth | 289/8552 | 482/18723 | 1.29e-10 | 3.77e-09 | 289 |
| GO:00457865 | Esophagus | ESCC | negative regulation of cell cycle | 236/8552 | 385/18723 | 3.62e-10 | 9.93e-09 | 236 |
| GO:0010639110 | Esophagus | ESCC | negative regulation of organelle organization | 215/8552 | 348/18723 | 8.20e-10 | 2.01e-08 | 215 |
| GO:000155819 | Esophagus | ESCC | regulation of cell growth | 248/8552 | 414/18723 | 2.97e-09 | 6.45e-08 | 248 |
| GO:001908312 | Esophagus | ESCC | viral transcription | 41/8552 | 50/18723 | 1.35e-07 | 2.17e-06 | 41 |
| GO:00067906 | Esophagus | ESCC | sulfur compound metabolic process | 201/8552 | 339/18723 | 2.64e-07 | 3.94e-06 | 201 |
| GO:00109484 | Esophagus | ESCC | negative regulation of cell cycle process | 177/8552 | 294/18723 | 3.26e-07 | 4.59e-06 | 177 |
| GO:004852516 | Esophagus | ESCC | negative regulation of viral process | 66/8552 | 92/18723 | 3.49e-07 | 4.88e-06 | 66 |
| GO:00618428 | Esophagus | ESCC | microtubule organizing center localization | 28/8552 | 33/18723 | 3.80e-06 | 4.12e-05 | 28 |
| GO:00070982 | Esophagus | ESCC | centrosome cycle | 85/8552 | 130/18723 | 4.41e-06 | 4.69e-05 | 85 |
| GO:00310233 | Esophagus | ESCC | microtubule organizing center organization | 92/8552 | 143/18723 | 5.04e-06 | 5.31e-05 | 92 |
| GO:00516428 | Esophagus | ESCC | centrosome localization | 27/8552 | 32/18723 | 7.10e-06 | 7.12e-05 | 27 |
| GO:005507617 | Esophagus | ESCC | transition metal ion homeostasis | 87/8552 | 138/18723 | 2.85e-05 | 2.37e-04 | 87 |
| GO:001622611 | Esophagus | ESCC | iron-sulfur cluster assembly | 21/8552 | 26/18723 | 2.69e-04 | 1.63e-03 | 21 |
| GO:003116311 | Esophagus | ESCC | metallo-sulfur cluster assembly | 21/8552 | 26/18723 | 2.69e-04 | 1.63e-03 | 21 |
| GO:00469169 | Esophagus | ESCC | cellular transition metal ion homeostasis | 70/8552 | 115/18723 | 7.28e-04 | 3.79e-03 | 70 |
| Page: 1 2 3 4 5 6 |
| Pathway ID | Tissue | Disease Stage | Description | Gene Ratio | Bg Ratio | pvalue | p.adjust | qvalue | Count |
| Page: 1 |
Top |
Cell-cell communication analysis |
| Identification of potential cell-cell interactions between two cell types and their ligand-receptor pairs for different disease states |
| Ligand | Receptor | LRpair | Pathway | Tissue | Disease Stage |
| Page: 1 |
Top |
Single-cell gene regulatory network inference analysis |
| Find out the significant the regulons (TFs) and the target genes of each regulon across cell types for different disease states |
| TF | Cell Type | Tissue | Disease Stage | Target Gene | RSS | Regulon Activity |
| UBP1 | KER | Esophagus | Healthy | KCTD20,EHD1,DSG3, etc. | 2.24e-01 |  |
| UBP1 | CD8TEXP | Lung | AIS | POLDIP3,NCR1,ZNF766, etc. | 7.18e-03 |  |
| UBP1 | CD4TN | Oral cavity | ADJ | HEMK1,ERCC1,VPS33B, etc. | 4.93e-03 |  |
| UBP1 | NK | Oral cavity | OSCC | HEMK1,ERCC1,VPS33B, etc. | 8.88e-03 |  |
| UBP1 | CD8TEXP | Oral cavity | OSCC | HEMK1,ERCC1,VPS33B, etc. | 1.26e-02 | |
| UBP1 | MYOFIB | Oral cavity | LP | CROCC,CEP76,SEMA6B, etc. | 3.87e-02 |  |
| UBP1 | PVA | Oral cavity | NEOLP | CROCC,CEP76,SEMA6B, etc. | 2.06e-02 |  |
| UBP1 | MVA | Oral cavity | OSCC | CROCC,CEP76,SEMA6B, etc. | 3.99e-01 | |
| UBP1 | ICAF | Stomach | ADJ | COMMD2,METTL18,CDC34, etc. | 1.61e-02 |  |
| UBP1 | PERI | Stomach | CSG | COMMD2,METTL18,CDC34, etc. | 6.36e-02 |  |
| ∗The dot plots of a searched regulon are shown for all cell subpopulations in each disease state of each tissue based on the regulon specific score inferred using pySCENIC and by calculating the average expression. |
| Page: 1 2 |
Top |
Somatic mutation of malignant transformation related genes |
| Annotation of somatic variants for genes involved in malignant transformation |
| Hugo Symbol | Variant Class | Variant Classification | dbSNP RS | HGVSc | HGVSp | HGVSp Short | SWISSPROT | BIOTYPE | SIFT | PolyPhen | Tumor Sample Barcode | Tissue | Histology | Sex | Age | Stage | Therapy Types | Drugs | Outcome |
| UBP1 | SNV | Missense_Mutation | c.1427N>T | p.Ser476Leu | p.S476L | Q9NZI7 | protein_coding | tolerated(0.75) | benign(0) | TCGA-BH-A0HK-01 | Breast | breast invasive carcinoma | Female | >=65 | I/II | Hormone Therapy | arimidex | SD | |
| UBP1 | SNV | Missense_Mutation | c.645N>C | p.Gln215His | p.Q215H | Q9NZI7 | protein_coding | tolerated(0.45) | benign(0.062) | TCGA-D8-A27G-01 | Breast | breast invasive carcinoma | Female | >=65 | I/II | Unknown | Unknown | SD | |
| UBP1 | insertion | Frame_Shift_Ins | novel | c.736_737insA | p.Thr246AsnfsTer2 | p.T246Nfs*2 | Q9NZI7 | protein_coding | TCGA-A8-A09N-01 | Breast | breast invasive carcinoma | Female | <65 | III/IV | Unknown | Unknown | SD | ||
| UBP1 | SNV | Missense_Mutation | novel | c.422G>A | p.Arg141His | p.R141H | Q9NZI7 | protein_coding | deleterious(0.03) | possibly_damaging(0.749) | TCGA-2W-A8YY-01 | Cervix | cervical & endocervical cancer | Female | <65 | I/II | Chemotherapy | cisplatin | CR |
| UBP1 | SNV | Missense_Mutation | novel | c.310G>A | p.Asp104Asn | p.D104N | Q9NZI7 | protein_coding | deleterious(0.05) | possibly_damaging(0.633) | TCGA-2W-A8YY-01 | Cervix | cervical & endocervical cancer | Female | <65 | I/II | Chemotherapy | cisplatin | CR |
| UBP1 | SNV | Missense_Mutation | c.471N>G | p.Ile157Met | p.I157M | Q9NZI7 | protein_coding | tolerated(0.07) | benign(0.411) | TCGA-A6-3809-01 | Colorectum | colon adenocarcinoma | Female | >=65 | I/II | Unknown | Unknown | SD | |
| UBP1 | SNV | Missense_Mutation | c.869N>G | p.Lys290Arg | p.K290R | Q9NZI7 | protein_coding | tolerated(0.21) | benign(0.007) | TCGA-AA-A022-01 | Colorectum | colon adenocarcinoma | Female | >=65 | I/II | Unknown | Unknown | SD | |
| UBP1 | SNV | Missense_Mutation | c.586N>T | p.Arg196Trp | p.R196W | Q9NZI7 | protein_coding | deleterious(0.03) | possibly_damaging(0.511) | TCGA-AZ-6601-01 | Colorectum | colon adenocarcinoma | Male | >=65 | I/II | Unknown | Unknown | PD | |
| UBP1 | SNV | Missense_Mutation | c.1146N>A | p.Phe382Leu | p.F382L | Q9NZI7 | protein_coding | tolerated(0.08) | benign(0.253) | TCGA-CA-6718-01 | Colorectum | colon adenocarcinoma | Male | <65 | I/II | Unknown | Unknown | PD | |
| UBP1 | SNV | Missense_Mutation | rs774635168 | c.535N>T | p.Arg179Cys | p.R179C | Q9NZI7 | protein_coding | deleterious(0.04) | benign(0.082) | TCGA-CM-4743-01 | Colorectum | colon adenocarcinoma | Male | >=65 | I/II | Chemotherapy | capecitabine | SD |
| Page: 1 2 3 4 5 6 |
Top |
Related drugs of malignant transformation related genes |
| Identification of chemicals and drugs interact with genes involved in malignant transfromation |
| (DGIdb 4.0) |
| Entrez ID | Symbol | Category | Interaction Types | Drug Claim Name | Drug Name | PMIDs |
| Page: 1 |

Copyright 2023-Present -The University of Texas Health Science Center at Houston |