
|
|||||
|
 | |
| |
| |
| |
| |
| |
|
Gene: UBN2 |
Gene summary for UBN2 |
| Gene information | Species | Human | Gene symbol | UBN2 | Gene ID | 254048 |
| Gene name | ubinuclein 2 | |
| Gene Alias | UBN2 | |
| Cytomap | 7q34 | |
| Gene Type | protein-coding | GO ID | GO:0006323 | UniProtAcc | Q6ZU65 |
Top |
Malignant transformation analysis |
| Identification of the aberrant gene expression in precancerous and cancerous lesions by comparing the gene expression of stem-like cells in diseased tissues with normal stem cells |
| Entrez ID | Symbol | Replicates | Species | Organ | Tissue | Adj P-value | Log2FC | Malignancy |
| 254048 | UBN2 | NAFLD1 | Human | Liver | NAFLD | 4.90e-02 | 4.14e-01 | -0.04 |
| 254048 | UBN2 | HCC1_Meng | Human | Liver | HCC | 2.70e-31 | -2.98e-02 | 0.0246 |
| 254048 | UBN2 | HCC2_Meng | Human | Liver | HCC | 3.64e-20 | 9.40e-02 | 0.0107 |
| 254048 | UBN2 | HCC1 | Human | Liver | HCC | 6.67e-09 | 3.20e+00 | 0.5336 |
| 254048 | UBN2 | HCC2 | Human | Liver | HCC | 1.18e-25 | 3.74e+00 | 0.5341 |
| 254048 | UBN2 | HCC5 | Human | Liver | HCC | 5.02e-17 | 2.63e+00 | 0.4932 |
| 254048 | UBN2 | S015 | Human | Liver | HCC | 1.36e-04 | 4.23e-01 | 0.2375 |
| 254048 | UBN2 | S028 | Human | Liver | HCC | 3.78e-03 | 3.38e-01 | 0.2503 |
| 254048 | UBN2 | RNA-P10T2-P10T2-1 | Human | Lung | AAH | 7.31e-03 | 5.43e-01 | -0.1271 |
| 254048 | UBN2 | RNA-P17T-P17T-2 | Human | Lung | IAC | 2.13e-03 | 4.52e-01 | 0.3371 |
| 254048 | UBN2 | RNA-P17T-P17T-4 | Human | Lung | IAC | 1.48e-03 | 4.42e-01 | 0.343 |
| 254048 | UBN2 | RNA-P25T1-P25T1-1 | Human | Lung | AIS | 1.70e-10 | 4.53e-01 | -0.2116 |
| 254048 | UBN2 | RNA-P25T1-P25T1-2 | Human | Lung | AIS | 7.48e-05 | 5.12e-01 | -0.1941 |
| 254048 | UBN2 | RNA-P25T1-P25T1-3 | Human | Lung | AIS | 7.22e-04 | 3.91e-01 | -0.2107 |
| 254048 | UBN2 | RNA-P25T1-P25T1-4 | Human | Lung | AIS | 2.81e-06 | 3.83e-01 | -0.2119 |
| 254048 | UBN2 | RNA-P3T-P3T-4 | Human | Lung | IAC | 2.14e-03 | 3.00e-01 | 0.1859 |
| 254048 | UBN2 | RNA-P6T2-P6T2-1 | Human | Lung | IAC | 8.58e-08 | 2.87e-01 | -0.0166 |
| 254048 | UBN2 | RNA-P6T2-P6T2-2 | Human | Lung | IAC | 7.32e-11 | 3.46e-01 | -0.0132 |
| 254048 | UBN2 | RNA-P6T2-P6T2-3 | Human | Lung | IAC | 3.79e-16 | 4.49e-01 | -0.013 |
| 254048 | UBN2 | RNA-P6T2-P6T2-4 | Human | Lung | IAC | 1.16e-09 | 3.43e-01 | -0.0121 |
| Page: 1 2 |
| Tissue | Expression Dynamics | Abbreviation |
| Liver |  | HCC: Hepatocellular carcinoma |
| NAFLD: Non-alcoholic fatty liver disease | ||
| Lung | 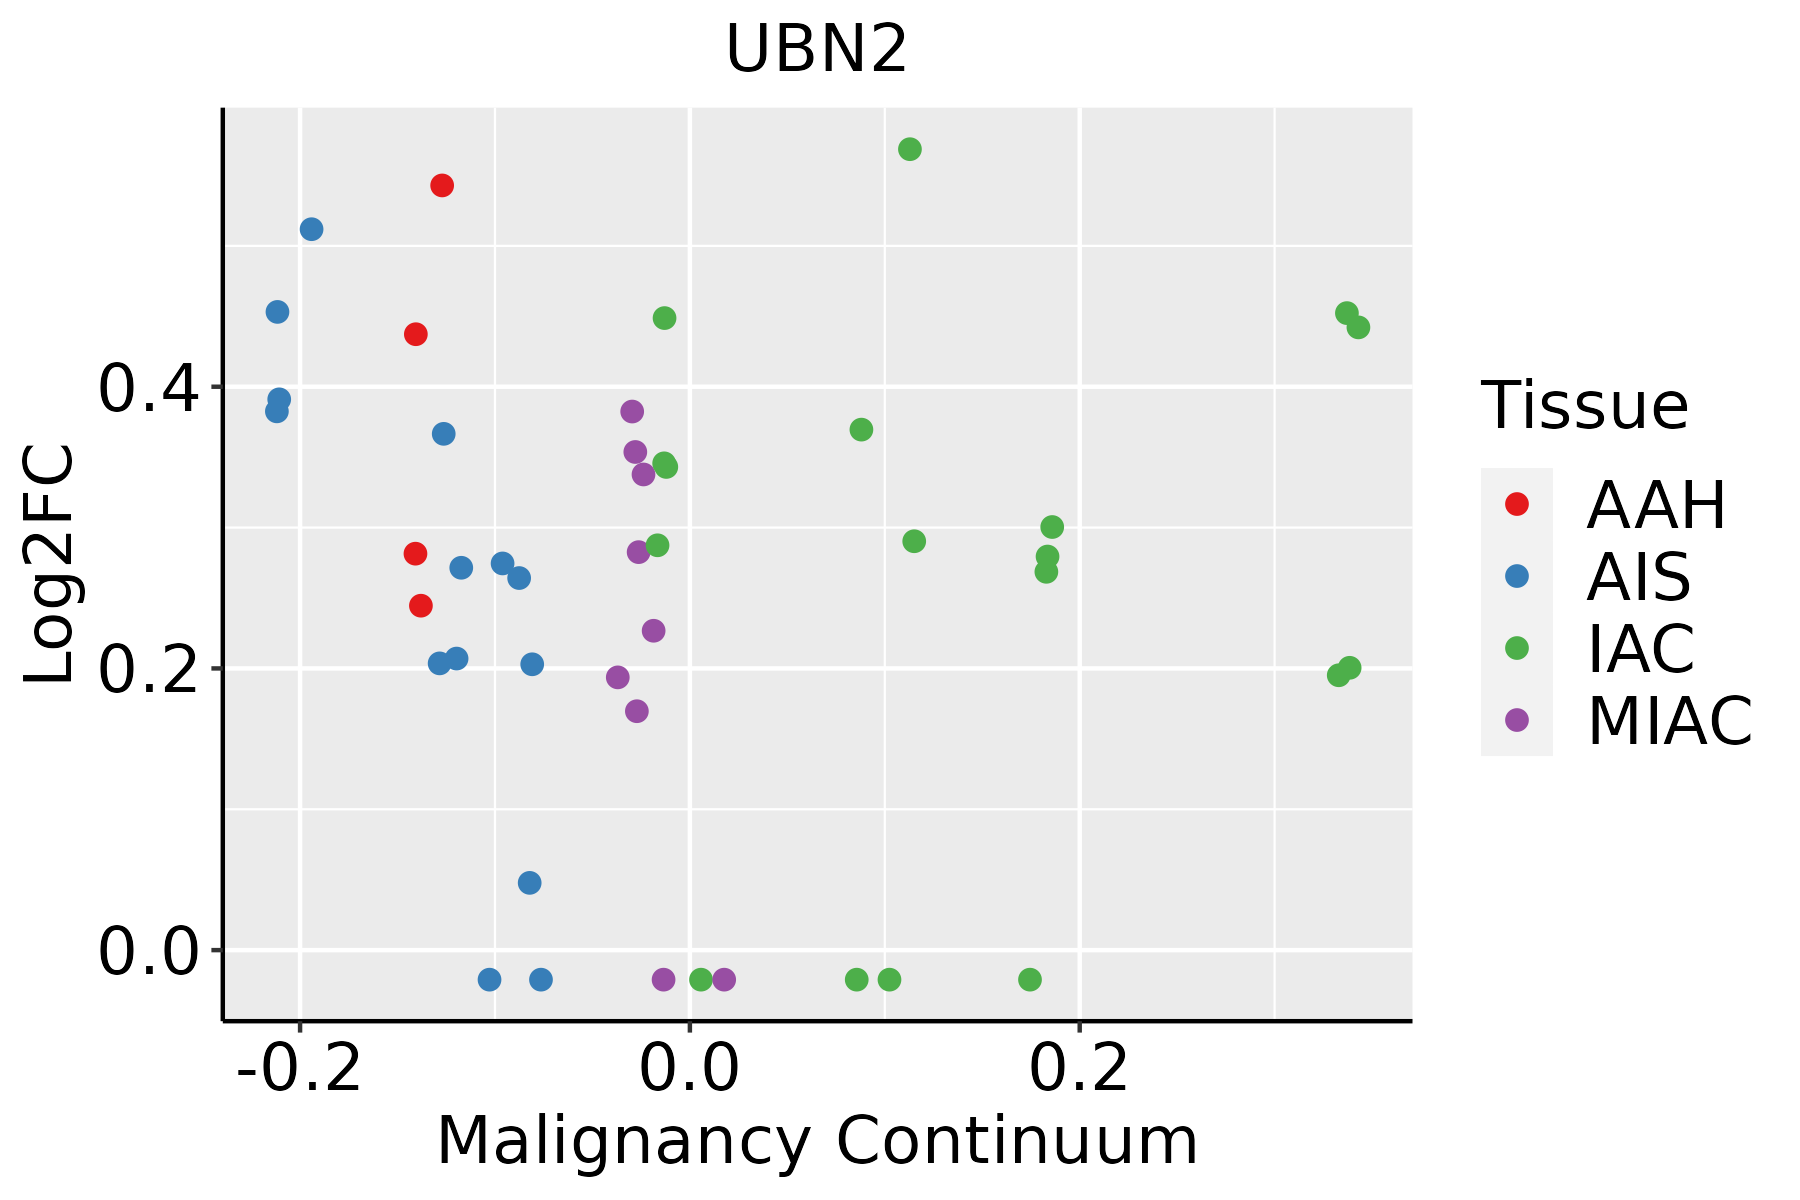 | AAH: Atypical adenomatous hyperplasia |
| AIS: Adenocarcinoma in situ | ||
| IAC: Invasive lung adenocarcinoma | ||
| MIA: Minimally invasive adenocarcinoma | ||
| Thyroid | 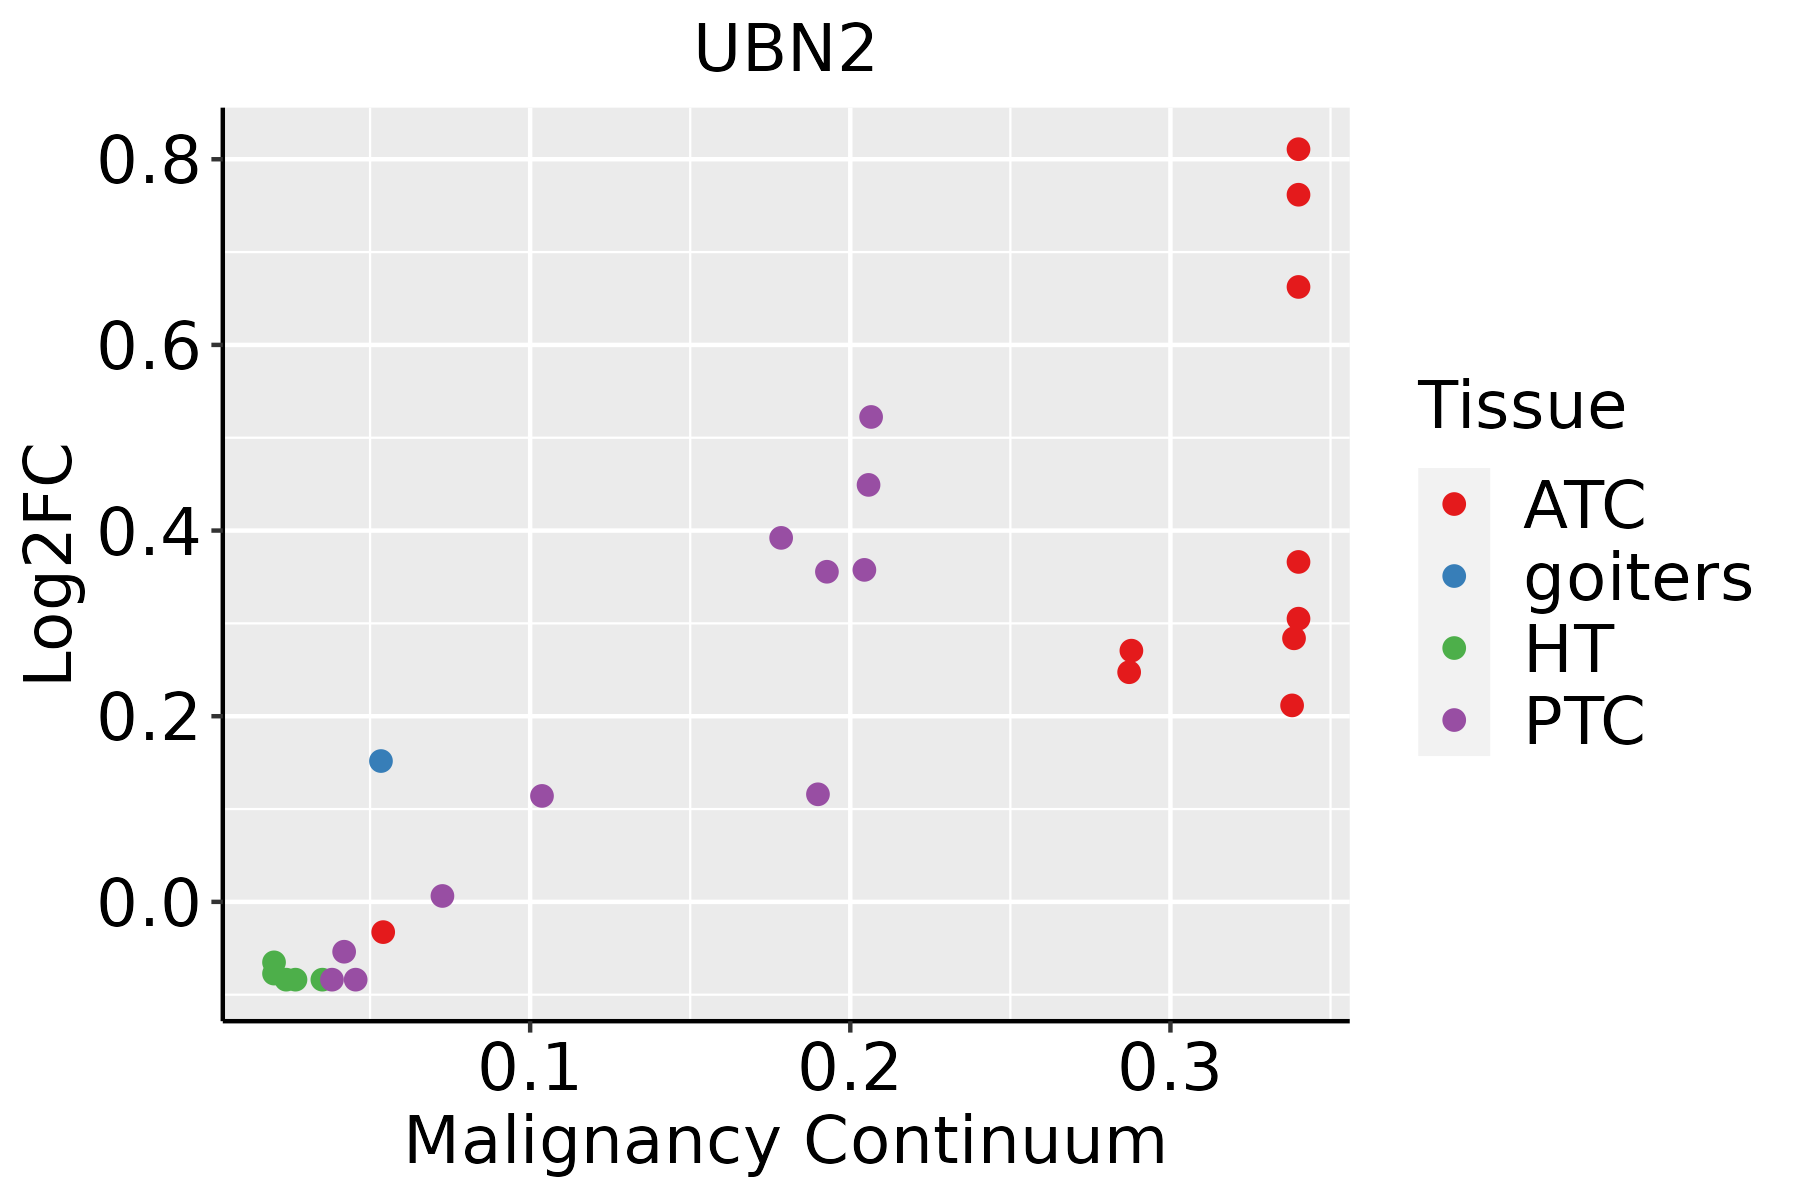 | ATC: Anaplastic thyroid cancer |
| HT: Hashimoto's thyroiditis | ||
| PTC: Papillary thyroid cancer |
| ∗log2FC in expression of this searched gene in stem-like cells from each diseased tissue sample relative to stem-like cells in normal samples in each tissue plotted against the malignancy continuum. Samples are colored based on if they are from different disease stage. |
Top |
Malignant transformation related pathway analysis |
| Find out the enriched GO biological processes and KEGG pathways involved in transition from healthy to precancer to cancer |
| Tissue | Disease Stage | Enriched GO biological Processes |
| Colorectum | AD |  |
| Colorectum | SER |  |
| Colorectum | MSS |  |
| Colorectum | MSI-H |  |
| Colorectum | FAP |  |
| ∗Top 15 enriched GO BP terms are showed in the bar plot of each disease state in each tissue. Each row represents a significant GO biological process which is colored according to the -log10(p.adjust). |
| Page: 1 2 3 4 5 6 7 8 9 |
| GO ID | Tissue | Disease Stage | Description | Gene Ratio | Bg Ratio | pvalue | p.adjust | Count |
| GO:00063255 | Liver | NAFLD | chromatin organization | 64/1882 | 409/18723 | 2.31e-04 | 3.89e-03 | 64 |
| GO:000632511 | Liver | HCC | chromatin organization | 206/7958 | 409/18723 | 7.23e-04 | 4.41e-03 | 206 |
| GO:00063256 | Lung | IAC | chromatin organization | 69/2061 | 409/18723 | 2.01e-04 | 3.53e-03 | 69 |
| GO:000632512 | Lung | AIS | chromatin organization | 62/1849 | 409/18723 | 4.24e-04 | 7.29e-03 | 62 |
| GO:000632520 | Thyroid | PTC | chromatin organization | 183/5968 | 409/18723 | 2.55e-08 | 5.70e-07 | 183 |
| GO:00063385 | Thyroid | PTC | chromatin remodeling | 106/5968 | 255/18723 | 6.56e-04 | 4.13e-03 | 106 |
| GO:0006325110 | Thyroid | ATC | chromatin organization | 189/6293 | 409/18723 | 6.40e-08 | 1.13e-06 | 189 |
| GO:000633813 | Thyroid | ATC | chromatin remodeling | 109/6293 | 255/18723 | 1.38e-03 | 7.15e-03 | 109 |
| GO:00718242 | Thyroid | ATC | protein-DNA complex subunit organization | 103/6293 | 241/18723 | 1.84e-03 | 9.03e-03 | 103 |
| Page: 1 |
| Pathway ID | Tissue | Disease Stage | Description | Gene Ratio | Bg Ratio | pvalue | p.adjust | qvalue | Count |
| Page: 1 |
Top |
Cell-cell communication analysis |
| Identification of potential cell-cell interactions between two cell types and their ligand-receptor pairs for different disease states |
| Ligand | Receptor | LRpair | Pathway | Tissue | Disease Stage |
| Page: 1 |
Top |
Single-cell gene regulatory network inference analysis |
| Find out the significant the regulons (TFs) and the target genes of each regulon across cell types for different disease states |
| TF | Cell Type | Tissue | Disease Stage | Target Gene | RSS | Regulon Activity |
| ∗The dot plots of a searched regulon are shown for all cell subpopulations in each disease state of each tissue based on the regulon specific score inferred using pySCENIC and by calculating the average expression. |
| Page: 1 |
Top |
Somatic mutation of malignant transformation related genes |
| Annotation of somatic variants for genes involved in malignant transformation |
| Hugo Symbol | Variant Class | Variant Classification | dbSNP RS | HGVSc | HGVSp | HGVSp Short | SWISSPROT | BIOTYPE | SIFT | PolyPhen | Tumor Sample Barcode | Tissue | Histology | Sex | Age | Stage | Therapy Types | Drugs | Outcome |
| UBN2 | SNV | Missense_Mutation | novel | c.3545N>A | p.Gly1182Glu | p.G1182E | Q6ZU65 | protein_coding | deleterious_low_confidence(0) | benign(0.395) | TCGA-5L-AAT0-01 | Breast | breast invasive carcinoma | Female | <65 | I/II | Hormone Therapy | tamoxiphen | SD |
| UBN2 | SNV | Missense_Mutation | c.1483C>A | p.Gln495Lys | p.Q495K | Q6ZU65 | protein_coding | tolerated(0.1) | possibly_damaging(0.596) | TCGA-A2-A04T-01 | Breast | breast invasive carcinoma | Female | <65 | I/II | Chemotherapy | cyclophosphamide | SD | |
| UBN2 | SNV | Missense_Mutation | rs200761673 | c.907N>T | p.Val303Phe | p.V303F | Q6ZU65 | protein_coding | tolerated(0.39) | possibly_damaging(0.895) | TCGA-AC-A3W6-01 | Breast | breast invasive carcinoma | Female | >=65 | III/IV | Unknown | Unknown | SD |
| UBN2 | SNV | Missense_Mutation | rs764314249 | c.1381G>A | p.Glu461Lys | p.E461K | Q6ZU65 | protein_coding | tolerated(0.65) | benign(0.058) | TCGA-AN-A046-01 | Breast | breast invasive carcinoma | Female | >=65 | I/II | Unknown | Unknown | SD |
| UBN2 | SNV | Missense_Mutation | c.1000N>A | p.Glu334Lys | p.E334K | Q6ZU65 | protein_coding | deleterious(0) | benign(0.219) | TCGA-AR-A1AY-01 | Breast | breast invasive carcinoma | Female | >=65 | I/II | Unspecific | Doxorubicin | SD | |
| UBN2 | SNV | Missense_Mutation | novel | c.2798C>T | p.Ser933Leu | p.S933L | Q6ZU65 | protein_coding | deleterious_low_confidence(0) | benign(0.343) | TCGA-BH-A18U-01 | Breast | breast invasive carcinoma | Female | >=65 | III/IV | Unknown | Unknown | SD |
| UBN2 | SNV | Missense_Mutation | c.2582C>A | p.Ser861Tyr | p.S861Y | Q6ZU65 | protein_coding | deleterious_low_confidence(0) | probably_damaging(0.991) | TCGA-C8-A273-01 | Breast | breast invasive carcinoma | Female | <65 | I/II | Hormone Therapy | tamoxiphen | SD | |
| UBN2 | SNV | Missense_Mutation | c.2254N>A | p.Leu752Ile | p.L752I | Q6ZU65 | protein_coding | deleterious(0.01) | probably_damaging(0.978) | TCGA-D8-A1XQ-01 | Breast | breast invasive carcinoma | Female | >=65 | I/II | Unknown | Unknown | SD | |
| UBN2 | insertion | Frame_Shift_Ins | novel | c.622_623insCACCT | p.Gly208AlafsTer20 | p.G208Afs*20 | Q6ZU65 | protein_coding | TCGA-A2-A0CU-01 | Breast | breast invasive carcinoma | Female | >=65 | I/II | Hormone Therapy | tamoxiphen | SD | ||
| UBN2 | insertion | Frame_Shift_Ins | novel | c.623_624insTAGTCCCACTTACGAGGCTGAGGCAGGAGGTTCA | p.Tyr209SerfsTer13 | p.Y209Sfs*13 | Q6ZU65 | protein_coding | TCGA-A2-A0CU-01 | Breast | breast invasive carcinoma | Female | >=65 | I/II | Hormone Therapy | tamoxiphen | SD |
| Page: 1 2 3 4 5 6 7 8 9 10 11 12 |
Top |
Related drugs of malignant transformation related genes |
| Identification of chemicals and drugs interact with genes involved in malignant transfromation |
| (DGIdb 4.0) |
| Entrez ID | Symbol | Category | Interaction Types | Drug Claim Name | Drug Name | PMIDs |
| Page: 1 |

Copyright 2023-Present -The University of Texas Health Science Center at Houston |