
|
|||||
|
 | |
| |
| |
| |
| |
| |
|
Gene: UBN1 |
Gene summary for UBN1 |
| Gene information | Species | Human | Gene symbol | UBN1 | Gene ID | 29855 |
| Gene name | ubinuclein 1 | |
| Gene Alias | VT | |
| Cytomap | 16p13.3 | |
| Gene Type | protein-coding | GO ID | GO:0006323 | UniProtAcc | Q9NPG3 |
Top |
Malignant transformation analysis |
| Identification of the aberrant gene expression in precancerous and cancerous lesions by comparing the gene expression of stem-like cells in diseased tissues with normal stem cells |
| Entrez ID | Symbol | Replicates | Species | Organ | Tissue | Adj P-value | Log2FC | Malignancy |
| 29855 | UBN1 | HTA11_2487_2000001011 | Human | Colorectum | SER | 3.58e-06 | 3.14e-01 | -0.1808 |
| 29855 | UBN1 | HTA11_1938_2000001011 | Human | Colorectum | AD | 3.48e-12 | 4.42e-01 | -0.0811 |
| 29855 | UBN1 | HTA11_347_2000001011 | Human | Colorectum | AD | 1.21e-17 | 5.41e-01 | -0.1954 |
| 29855 | UBN1 | HTA11_3361_2000001011 | Human | Colorectum | AD | 1.14e-02 | 1.76e-01 | -0.1207 |
| 29855 | UBN1 | HTA11_696_2000001011 | Human | Colorectum | AD | 1.00e-02 | 3.47e-01 | -0.1464 |
| 29855 | UBN1 | HTA11_1391_2000001011 | Human | Colorectum | AD | 1.58e-06 | 4.39e-01 | -0.059 |
| 29855 | UBN1 | HTA11_546_2000001011 | Human | Colorectum | AD | 1.55e-02 | 2.27e-01 | -0.0842 |
| 29855 | UBN1 | HTA11_866_3004761011 | Human | Colorectum | AD | 5.56e-03 | 1.25e-01 | 0.096 |
| 29855 | UBN1 | HTA11_99999965104_69814 | Human | Colorectum | MSS | 4.94e-04 | 2.95e-01 | 0.281 |
| 29855 | UBN1 | A015-C-203 | Human | Colorectum | FAP | 2.92e-08 | 5.97e-03 | -0.1294 |
| 29855 | UBN1 | A001-C-108 | Human | Colorectum | FAP | 8.20e-04 | 2.07e-02 | -0.0272 |
| 29855 | UBN1 | A015-C-106 | Human | Colorectum | FAP | 6.75e-04 | -1.67e-02 | -0.0511 |
| 29855 | UBN1 | A015-C-104 | Human | Colorectum | FAP | 4.63e-09 | -1.09e-01 | -0.1899 |
| 29855 | UBN1 | A001-C-014 | Human | Colorectum | FAP | 2.44e-02 | -2.16e-02 | 0.0135 |
| 29855 | UBN1 | A002-C-016 | Human | Colorectum | FAP | 2.43e-05 | 2.83e-03 | 0.0521 |
| 29855 | UBN1 | A002-C-116 | Human | Colorectum | FAP | 1.76e-11 | -1.40e-01 | -0.0452 |
| 29855 | UBN1 | F034 | Human | Colorectum | FAP | 1.34e-03 | 1.37e-02 | -0.0665 |
| 29855 | UBN1 | CRC-1-8810 | Human | Colorectum | CRC | 2.75e-06 | -2.09e-01 | 0.6257 |
| 29855 | UBN1 | LZE2T | Human | Esophagus | ESCC | 2.43e-05 | 6.24e-01 | 0.082 |
| 29855 | UBN1 | LZE4T | Human | Esophagus | ESCC | 2.60e-02 | 8.06e-02 | 0.0811 |
| Page: 1 2 3 4 5 6 7 |
| Tissue | Expression Dynamics | Abbreviation |
| Colorectum (GSE201348) |  | FAP: Familial adenomatous polyposis |
| CRC: Colorectal cancer | ||
| Colorectum (HTA11) |  | AD: Adenomas |
| SER: Sessile serrated lesions | ||
| MSI-H: Microsatellite-high colorectal cancer | ||
| MSS: Microsatellite stable colorectal cancer | ||
| Esophagus | 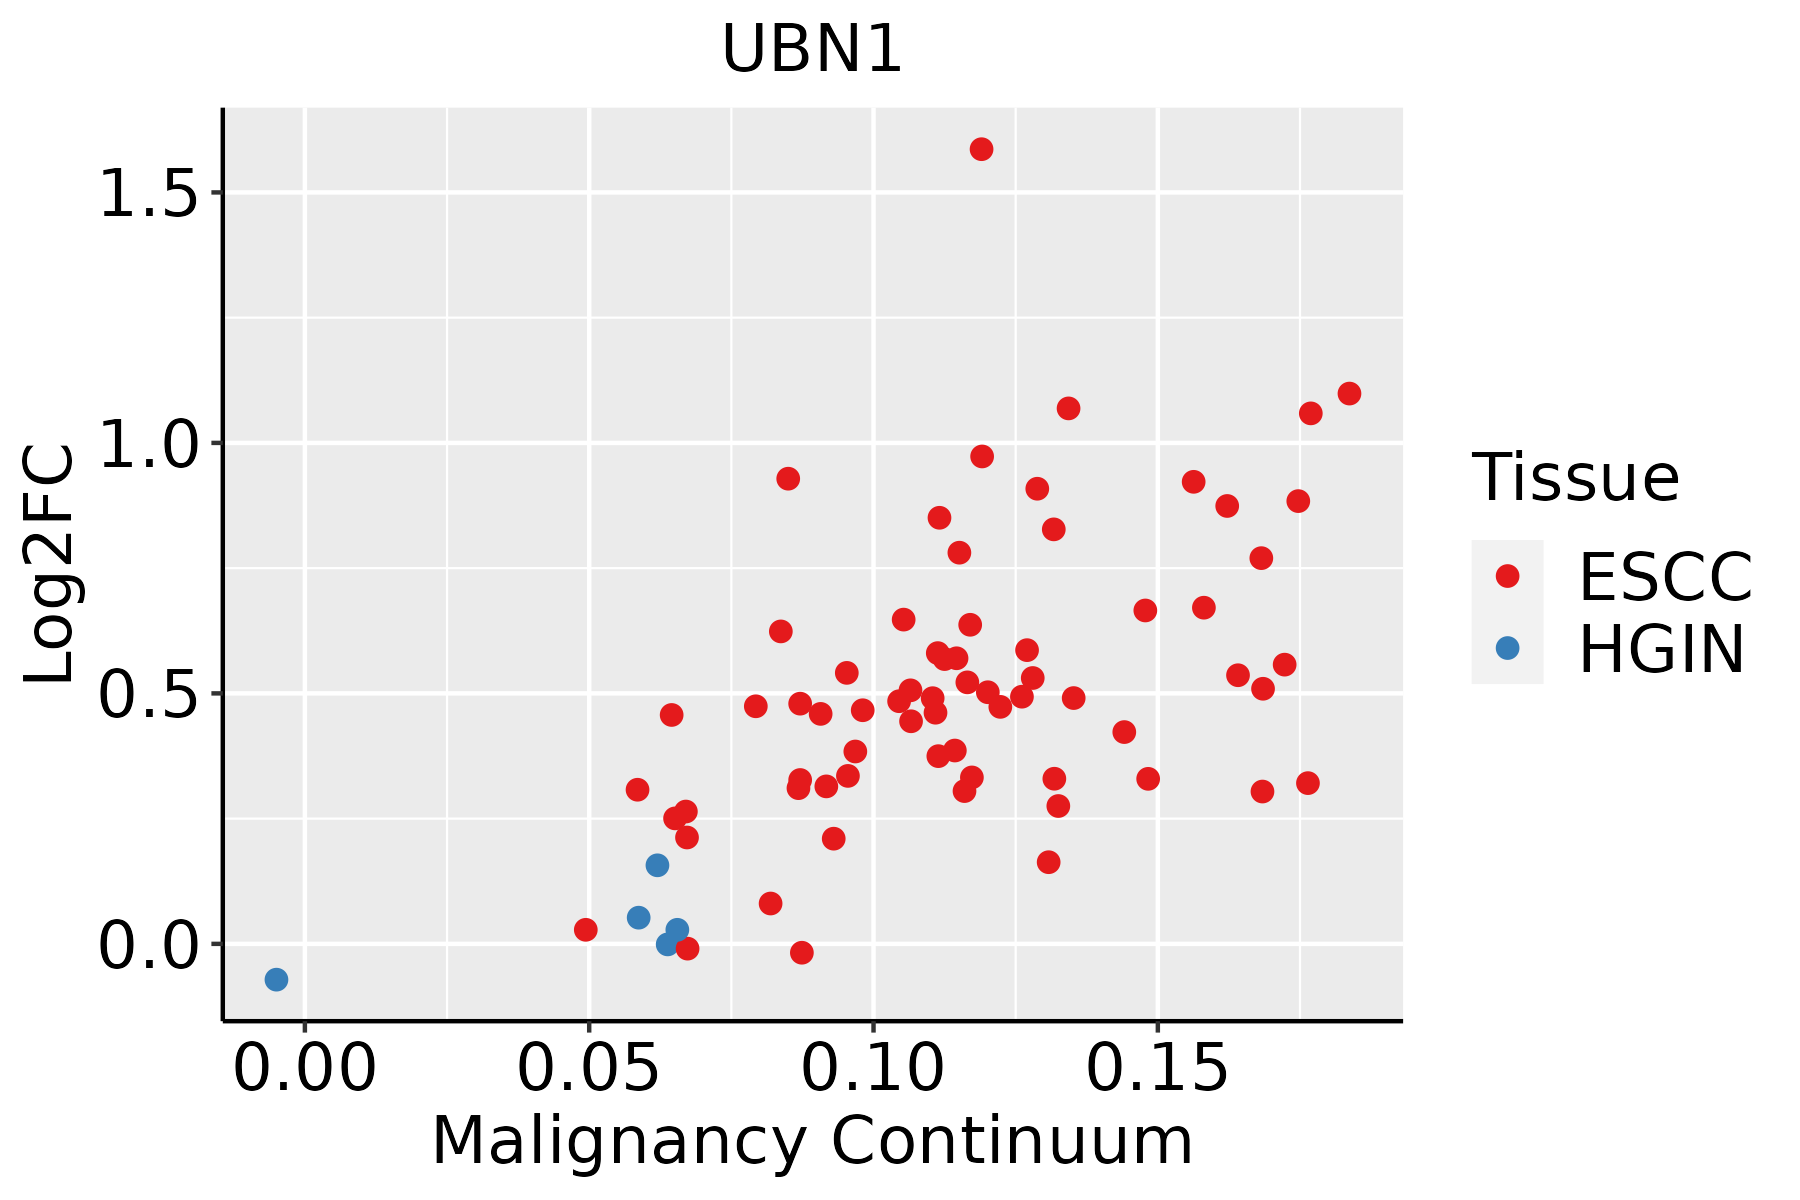 | ESCC: Esophageal squamous cell carcinoma |
| HGIN: High-grade intraepithelial neoplasias | ||
| LGIN: Low-grade intraepithelial neoplasias | ||
| Liver | 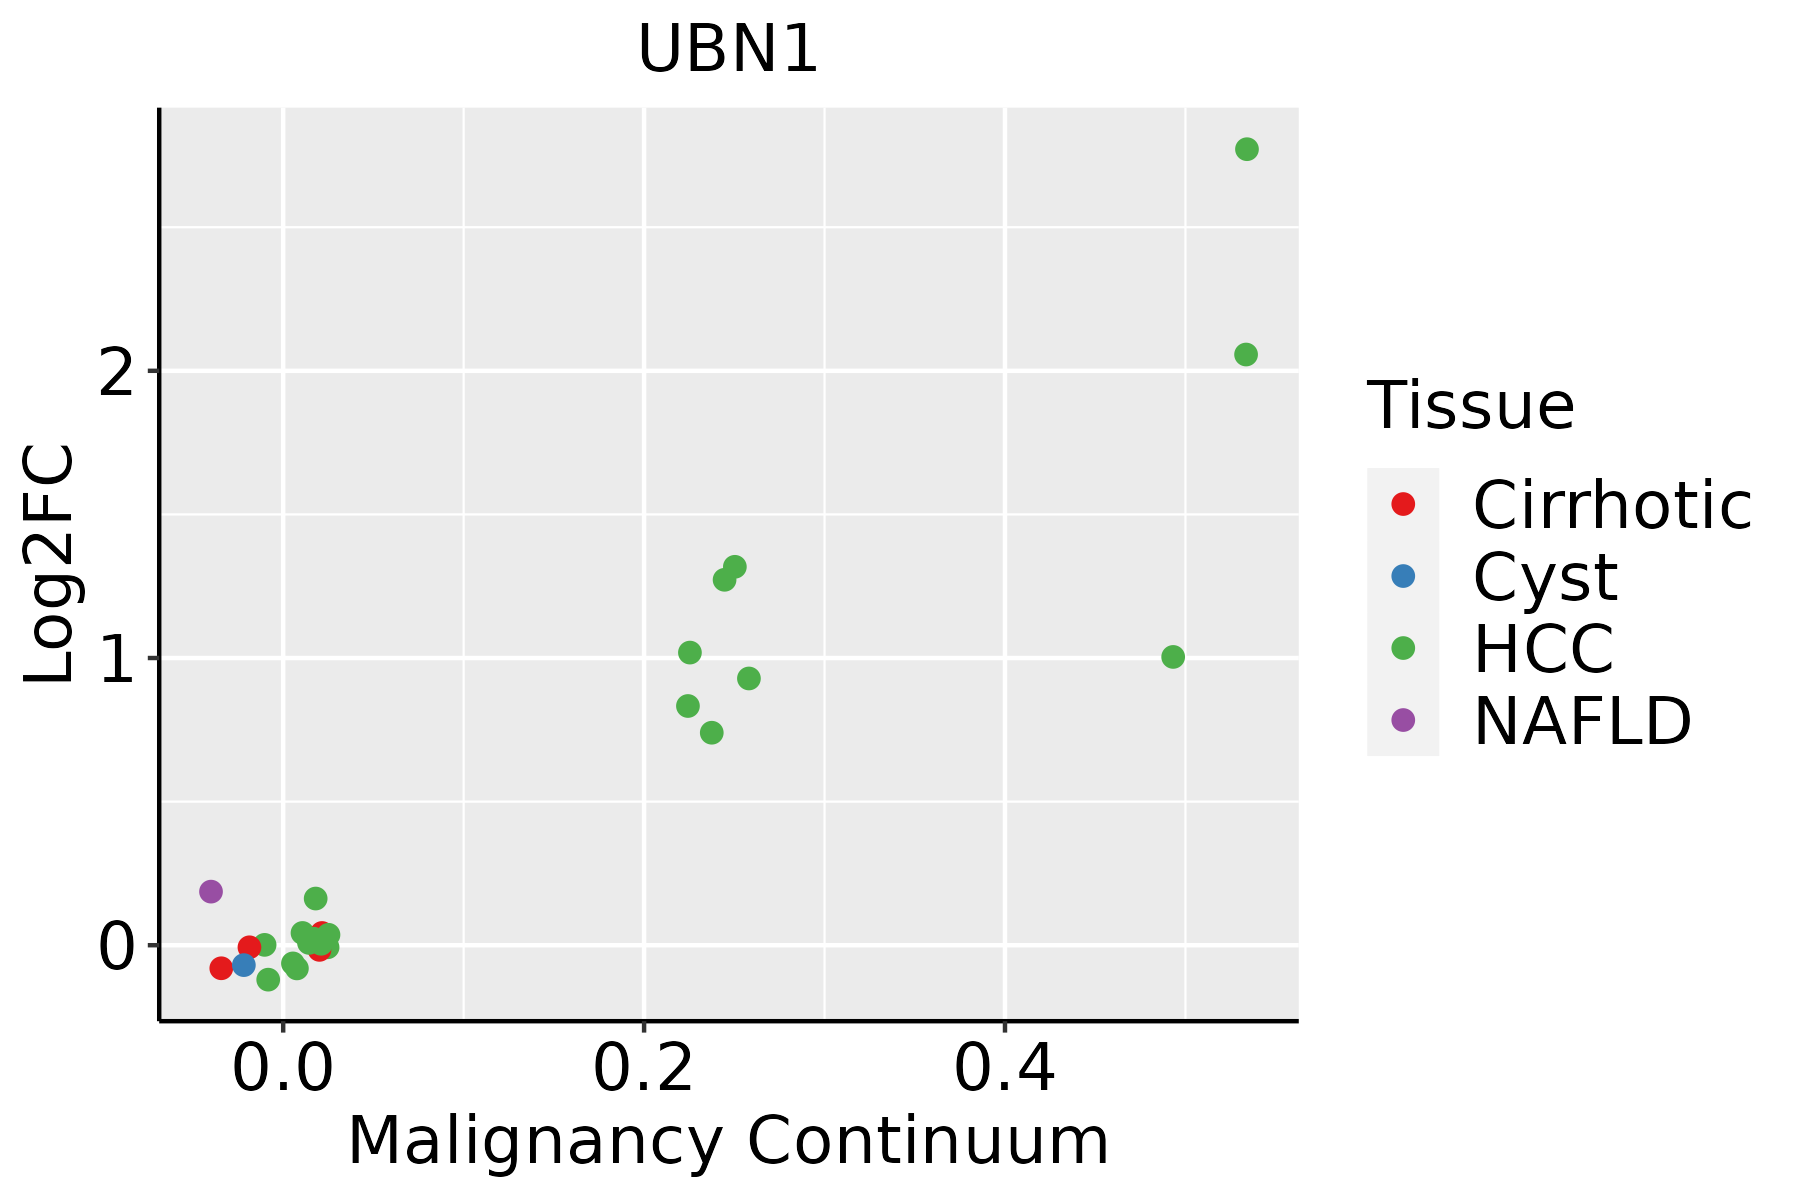 | HCC: Hepatocellular carcinoma |
| NAFLD: Non-alcoholic fatty liver disease | ||
| Oral Cavity | 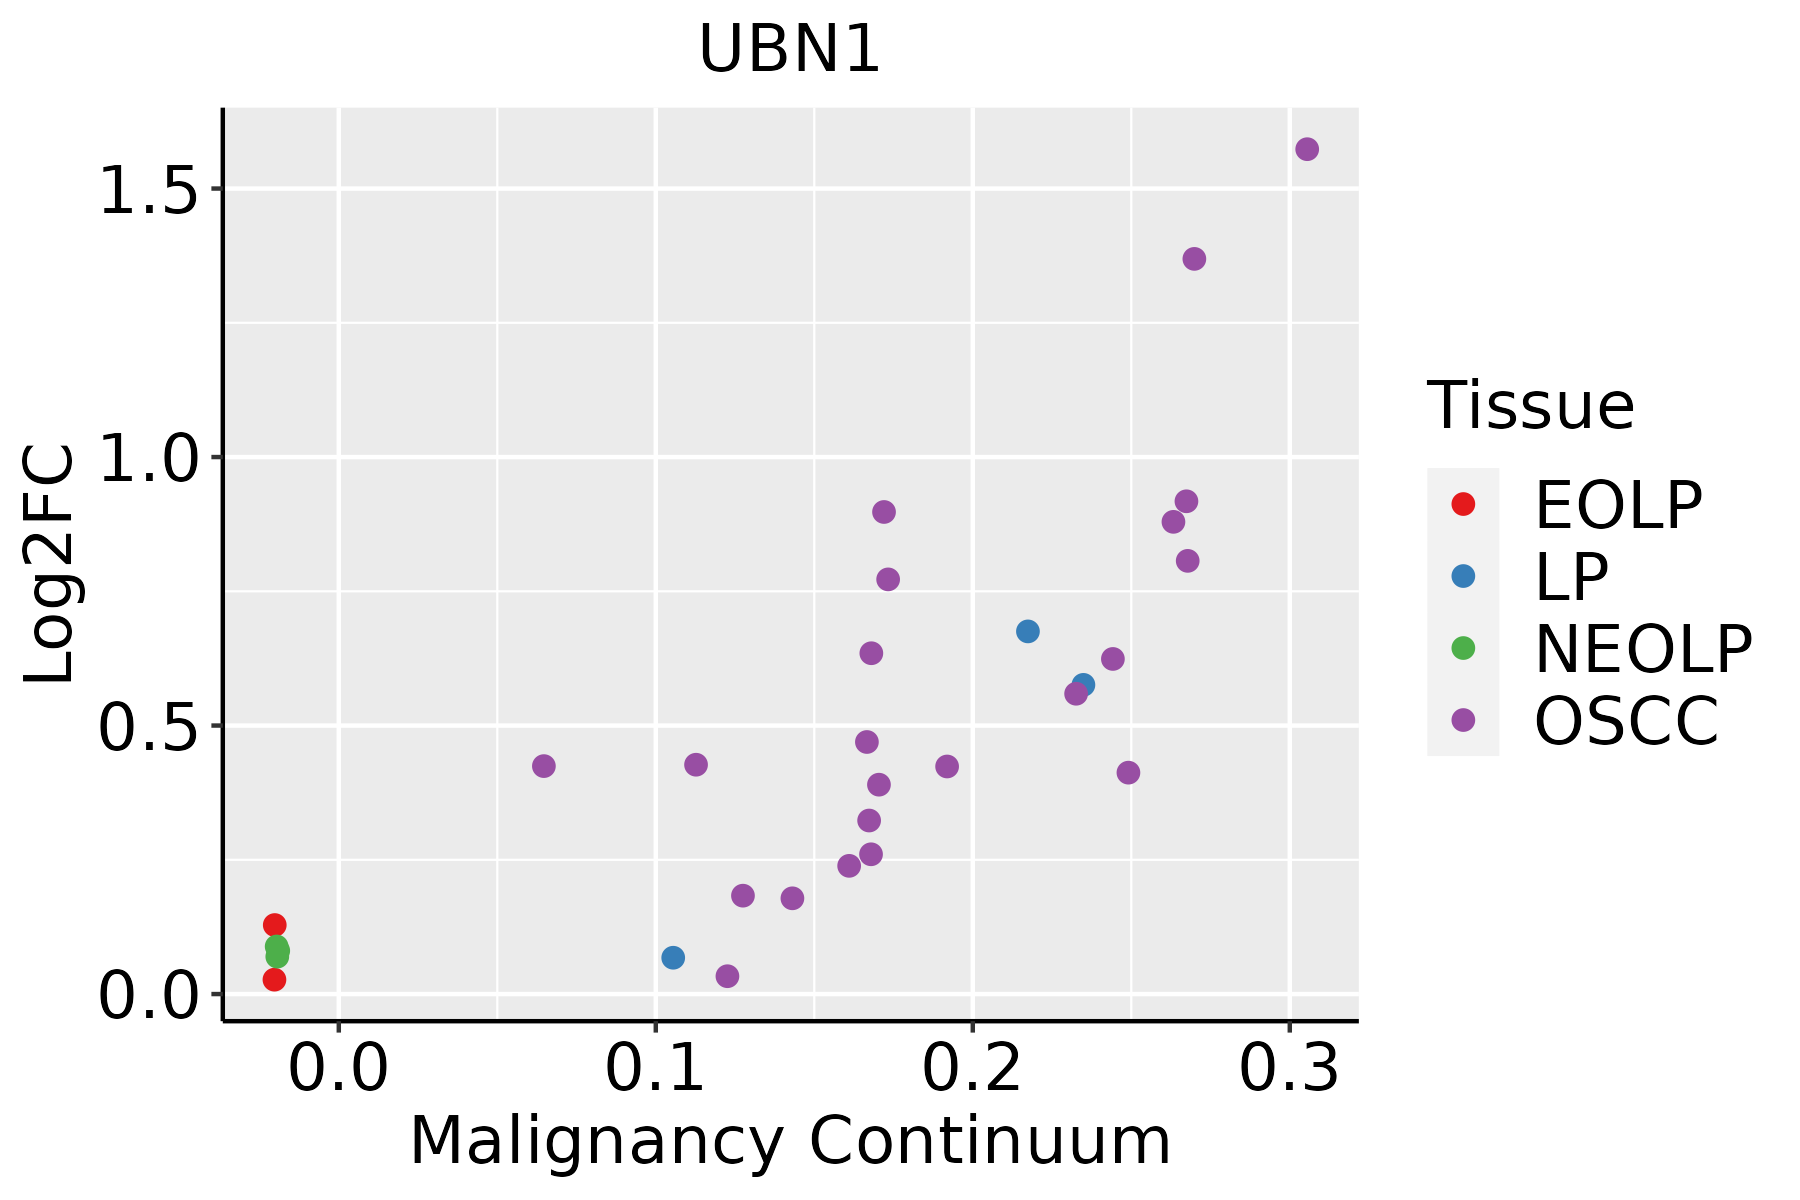 | EOLP: Erosive Oral lichen planus |
| LP: leukoplakia | ||
| NEOLP: Non-erosive oral lichen planus | ||
| OSCC: Oral squamous cell carcinoma | ||
| Skin | 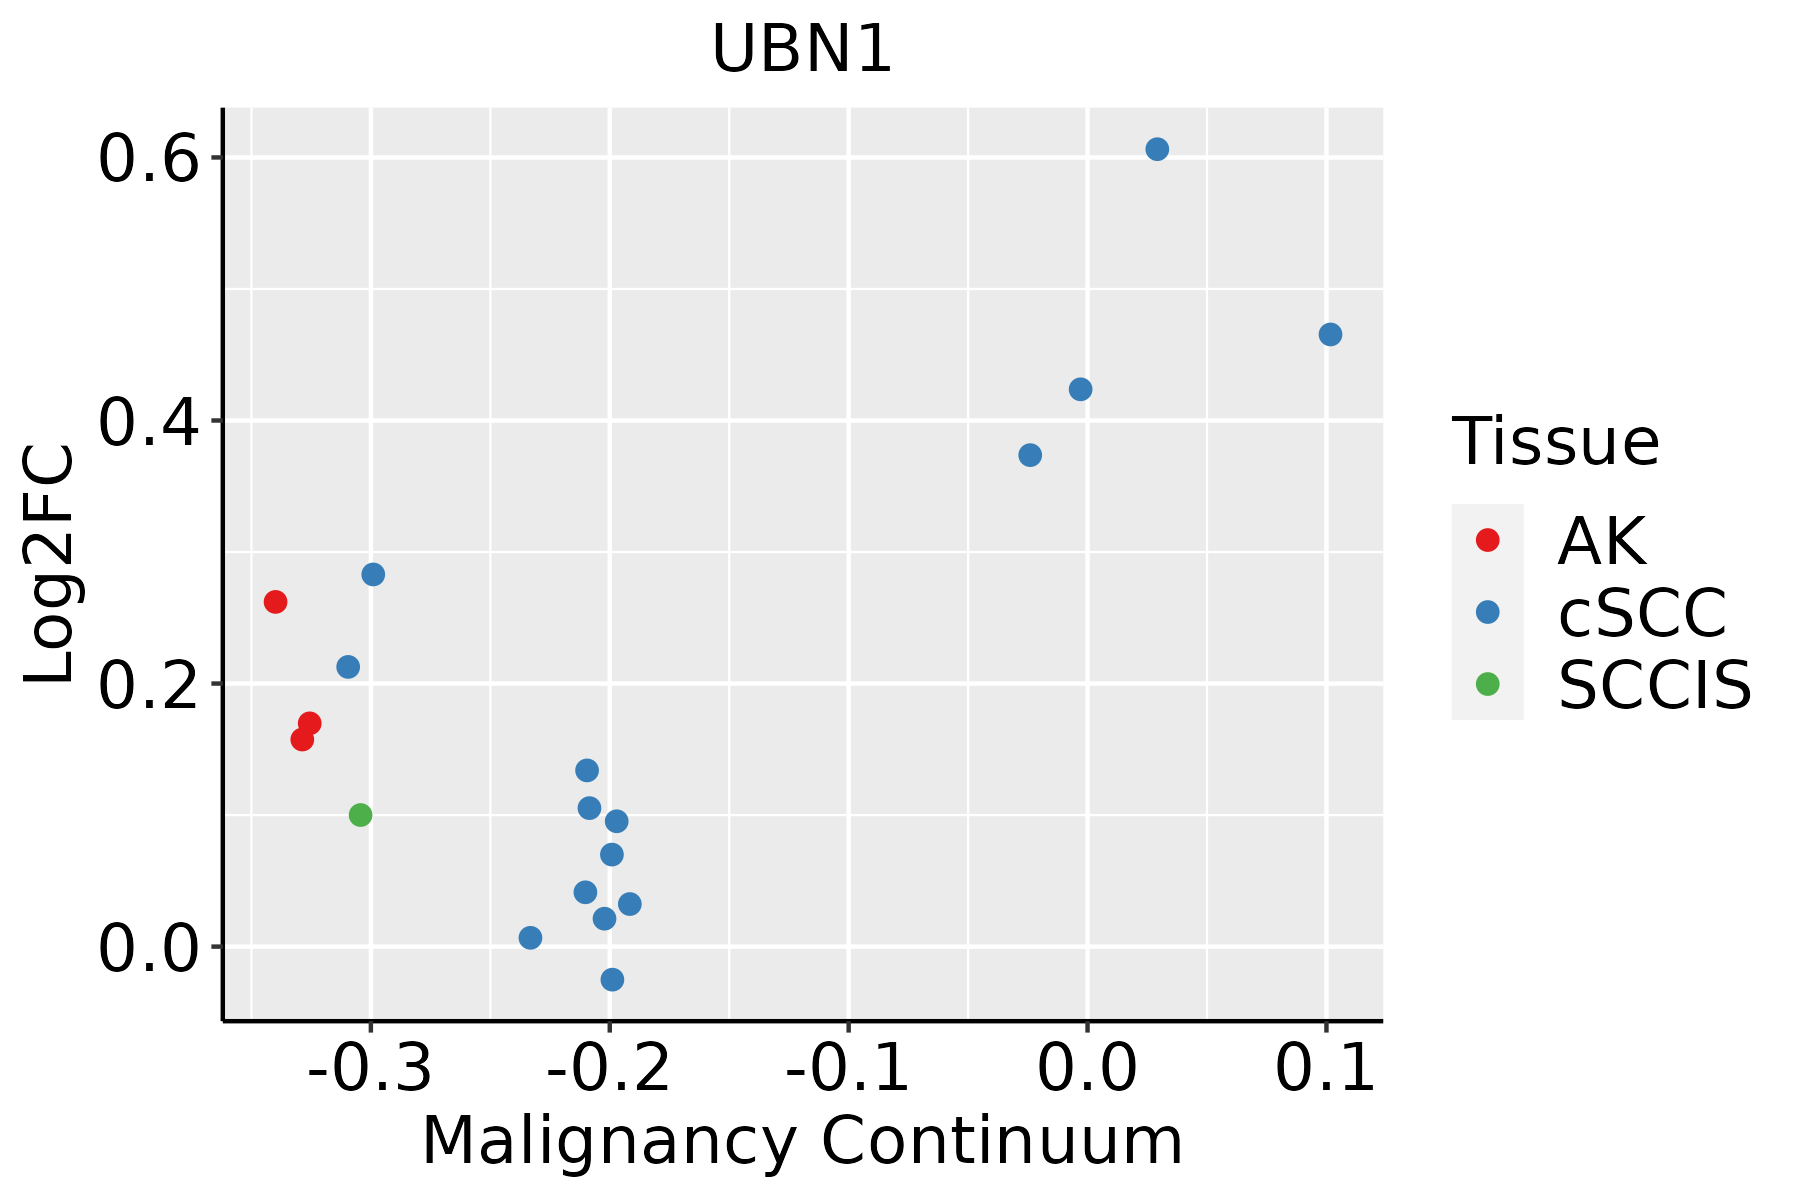 | AK: Actinic keratosis |
| cSCC: Cutaneous squamous cell carcinoma | ||
| SCCIS:squamous cell carcinoma in situ | ||
| Thyroid | 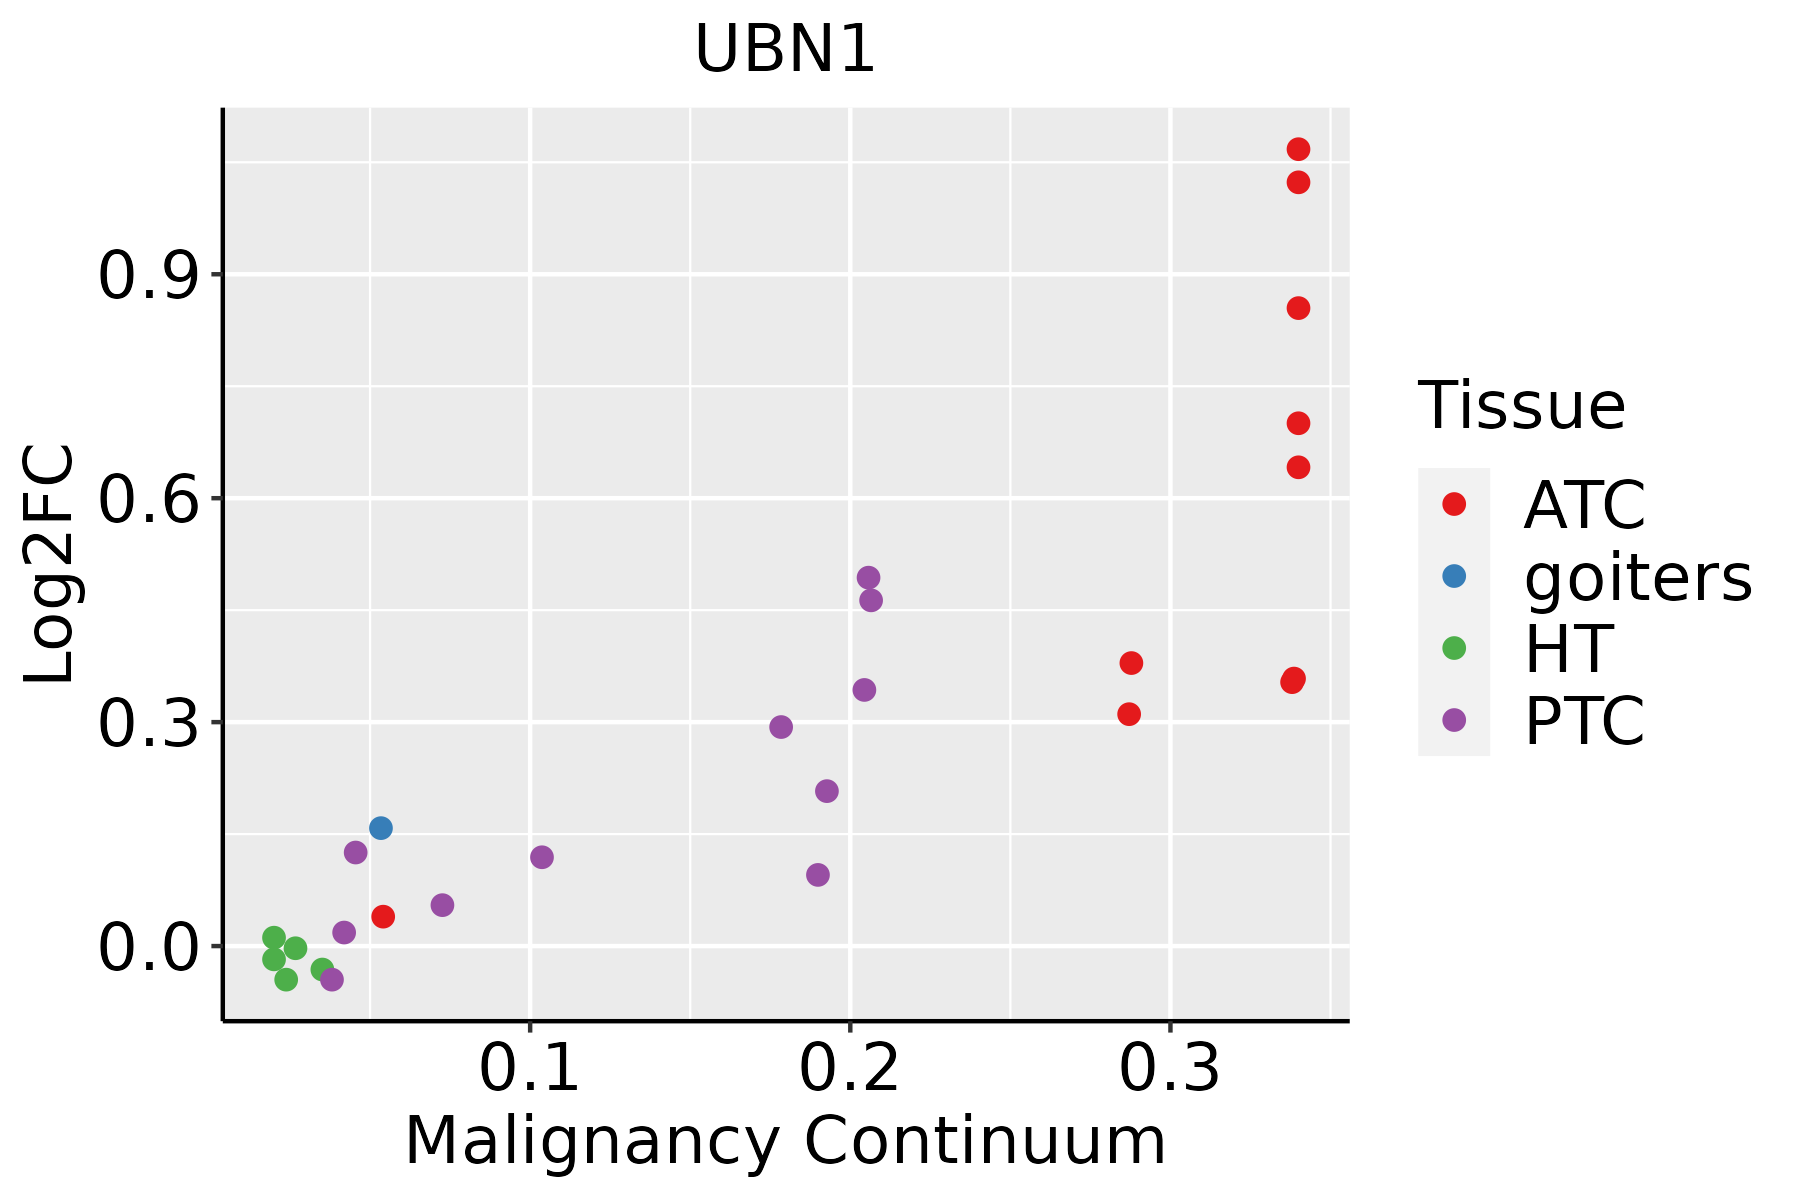 | ATC: Anaplastic thyroid cancer |
| HT: Hashimoto's thyroiditis | ||
| PTC: Papillary thyroid cancer |
| ∗log2FC in expression of this searched gene in stem-like cells from each diseased tissue sample relative to stem-like cells in normal samples in each tissue plotted against the malignancy continuum. Samples are colored based on if they are from different disease stage. |
Top |
Malignant transformation related pathway analysis |
| Find out the enriched GO biological processes and KEGG pathways involved in transition from healthy to precancer to cancer |
| Tissue | Disease Stage | Enriched GO biological Processes |
| Colorectum | AD |  |
| Colorectum | SER |  |
| Colorectum | MSS |  |
| Colorectum | MSI-H |  |
| Colorectum | FAP |  |
| ∗Top 15 enriched GO BP terms are showed in the bar plot of each disease state in each tissue. Each row represents a significant GO biological process which is colored according to the -log10(p.adjust). |
| Page: 1 2 3 4 5 6 7 8 9 |
| GO ID | Tissue | Disease Stage | Description | Gene Ratio | Bg Ratio | pvalue | p.adjust | Count |
| GO:0006325 | Colorectum | AD | chromatin organization | 119/3918 | 409/18723 | 4.85e-05 | 8.33e-04 | 119 |
| GO:0006338 | Colorectum | AD | chromatin remodeling | 70/3918 | 255/18723 | 7.44e-03 | 4.53e-02 | 70 |
| GO:00063251 | Colorectum | SER | chromatin organization | 89/2897 | 409/18723 | 4.15e-04 | 6.17e-03 | 89 |
| GO:00063252 | Colorectum | MSS | chromatin organization | 107/3467 | 409/18723 | 7.22e-05 | 1.21e-03 | 107 |
| GO:00063253 | Colorectum | FAP | chromatin organization | 84/2622 | 409/18723 | 1.62e-04 | 2.47e-03 | 84 |
| GO:00063254 | Colorectum | CRC | chromatin organization | 74/2078 | 409/18723 | 1.48e-05 | 4.61e-04 | 74 |
| GO:000632517 | Esophagus | ESCC | chromatin organization | 240/8552 | 409/18723 | 6.52e-08 | 1.14e-06 | 240 |
| GO:000632511 | Liver | HCC | chromatin organization | 206/7958 | 409/18723 | 7.23e-04 | 4.41e-03 | 206 |
| GO:000632510 | Oral cavity | OSCC | chromatin organization | 190/7305 | 409/18723 | 1.17e-03 | 5.97e-03 | 190 |
| GO:000632515 | Oral cavity | EOLP | chromatin organization | 84/2218 | 409/18723 | 2.68e-07 | 8.16e-06 | 84 |
| GO:00063383 | Oral cavity | EOLP | chromatin remodeling | 46/2218 | 255/18723 | 2.34e-03 | 1.44e-02 | 46 |
| GO:000632518 | Skin | AK | chromatin organization | 73/1910 | 409/18723 | 1.40e-06 | 4.26e-05 | 73 |
| GO:00063384 | Skin | AK | chromatin remodeling | 51/1910 | 255/18723 | 1.95e-06 | 5.73e-05 | 51 |
| GO:0071103 | Skin | AK | DNA conformation change | 47/1910 | 290/18723 | 9.43e-04 | 7.61e-03 | 47 |
| GO:0071824 | Skin | AK | protein-DNA complex subunit organization | 38/1910 | 241/18723 | 4.43e-03 | 2.57e-02 | 38 |
| GO:000632519 | Skin | cSCC | chromatin organization | 147/4864 | 409/18723 | 4.41e-06 | 6.52e-05 | 147 |
| GO:000633812 | Skin | cSCC | chromatin remodeling | 94/4864 | 255/18723 | 7.58e-05 | 7.26e-04 | 94 |
| GO:00718241 | Skin | cSCC | protein-DNA complex subunit organization | 87/4864 | 241/18723 | 3.09e-04 | 2.47e-03 | 87 |
| GO:00711031 | Skin | cSCC | DNA conformation change | 96/4864 | 290/18723 | 3.87e-03 | 2.07e-02 | 96 |
| GO:000632520 | Thyroid | PTC | chromatin organization | 183/5968 | 409/18723 | 2.55e-08 | 5.70e-07 | 183 |
| Page: 1 2 |
| Pathway ID | Tissue | Disease Stage | Description | Gene Ratio | Bg Ratio | pvalue | p.adjust | qvalue | Count |
| Page: 1 |
Top |
Cell-cell communication analysis |
| Identification of potential cell-cell interactions between two cell types and their ligand-receptor pairs for different disease states |
| Ligand | Receptor | LRpair | Pathway | Tissue | Disease Stage |
| Page: 1 |
Top |
Single-cell gene regulatory network inference analysis |
| Find out the significant the regulons (TFs) and the target genes of each regulon across cell types for different disease states |
| TF | Cell Type | Tissue | Disease Stage | Target Gene | RSS | Regulon Activity |
| ∗The dot plots of a searched regulon are shown for all cell subpopulations in each disease state of each tissue based on the regulon specific score inferred using pySCENIC and by calculating the average expression. |
| Page: 1 |
Top |
Somatic mutation of malignant transformation related genes |
| Annotation of somatic variants for genes involved in malignant transformation |
| Hugo Symbol | Variant Class | Variant Classification | dbSNP RS | HGVSc | HGVSp | HGVSp Short | SWISSPROT | BIOTYPE | SIFT | PolyPhen | Tumor Sample Barcode | Tissue | Histology | Sex | Age | Stage | Therapy Types | Drugs | Outcome |
| UBN1 | SNV | Missense_Mutation | c.1832N>A | p.Ser611Tyr | p.S611Y | Q9NPG3 | protein_coding | tolerated(0.08) | possibly_damaging(0.641) | TCGA-A8-A09Z-01 | Breast | breast invasive carcinoma | Female | >=65 | I/II | Unknown | Unknown | SD | |
| UBN1 | SNV | Missense_Mutation | rs760297239 | c.1211N>A | p.Ser404Asn | p.S404N | Q9NPG3 | protein_coding | tolerated(0.14) | possibly_damaging(0.867) | TCGA-AO-A03L-01 | Breast | breast invasive carcinoma | Female | <65 | III/IV | Chemotherapy | cyclophosphamide | SD |
| UBN1 | SNV | Missense_Mutation | c.1960N>T | p.Pro654Ser | p.P654S | Q9NPG3 | protein_coding | tolerated(0.42) | benign(0.001) | TCGA-AR-A24N-01 | Breast | breast invasive carcinoma | Female | <65 | I/II | Unknown | Unknown | SD | |
| UBN1 | insertion | Nonsense_Mutation | novel | c.313_314insGGCGCAGTGACTCATGCCTGTAAT | p.Ala105delinsGlyArgSerAspSerCysLeuTerSer | p.A105delinsGRSDSCL*S | Q9NPG3 | protein_coding | TCGA-A8-A0A7-01 | Breast | breast invasive carcinoma | Female | <65 | I/II | Unknown | Unknown | SD | ||
| UBN1 | SNV | Missense_Mutation | rs765679742 | c.1190C>T | p.Ala397Val | p.A397V | Q9NPG3 | protein_coding | tolerated(0.32) | benign(0) | TCGA-2W-A8YY-01 | Cervix | cervical & endocervical cancer | Female | <65 | I/II | Chemotherapy | cisplatin | CR |
| UBN1 | SNV | Missense_Mutation | novel | c.2428N>C | p.Gly810Arg | p.G810R | Q9NPG3 | protein_coding | deleterious_low_confidence(0.01) | probably_damaging(0.938) | TCGA-C5-A905-01 | Cervix | cervical & endocervical cancer | Female | <65 | I/II | Unknown | Unknown | SD |
| UBN1 | SNV | Missense_Mutation | c.2642N>T | p.Ser881Phe | p.S881F | Q9NPG3 | protein_coding | deleterious_low_confidence(0.02) | benign(0) | TCGA-EK-A3GJ-01 | Cervix | cervical & endocervical cancer | Female | <65 | I/II | Unknown | Unknown | SD | |
| UBN1 | SNV | Missense_Mutation | novel | c.1486G>A | p.Glu496Lys | p.E496K | Q9NPG3 | protein_coding | deleterious(0) | benign(0.282) | TCGA-MY-A5BF-01 | Cervix | cervical & endocervical cancer | Female | >=65 | I/II | Chemotherapy | cisplatin | CR |
| UBN1 | SNV | Missense_Mutation | novel | c.3364C>A | p.Gln1122Lys | p.Q1122K | Q9NPG3 | protein_coding | deleterious(0.01) | benign(0.351) | TCGA-ZJ-AAXU-01 | Cervix | cervical & endocervical cancer | Female | <65 | I/II | Unknown | Unknown | SD |
| UBN1 | SNV | Missense_Mutation | novel | c.2609N>T | p.Ser870Ile | p.S870I | Q9NPG3 | protein_coding | deleterious_low_confidence(0.04) | possibly_damaging(0.48) | TCGA-A6-5665-01 | Colorectum | colon adenocarcinoma | Female | >=65 | I/II | Unknown | Unknown | PD |
| Page: 1 2 3 4 5 6 7 8 9 10 |
Top |
Related drugs of malignant transformation related genes |
| Identification of chemicals and drugs interact with genes involved in malignant transfromation |
| (DGIdb 4.0) |
| Entrez ID | Symbol | Category | Interaction Types | Drug Claim Name | Drug Name | PMIDs |
| Page: 1 |

Copyright 2023-Present -The University of Texas Health Science Center at Houston |