
|
|||||
|
 | |
| |
| |
| |
| |
| |
|
Gene: UBLCP1 |
Gene summary for UBLCP1 |
| Gene information | Species | Human | Gene symbol | UBLCP1 | Gene ID | 134510 |
| Gene name | ubiquitin like domain containing CTD phosphatase 1 | |
| Gene Alias | CPUB1 | |
| Cytomap | 5q33.3 | |
| Gene Type | protein-coding | GO ID | GO:0006464 | UniProtAcc | Q8WVY7 |
Top |
Malignant transformation analysis |
| Identification of the aberrant gene expression in precancerous and cancerous lesions by comparing the gene expression of stem-like cells in diseased tissues with normal stem cells |
| Entrez ID | Symbol | Replicates | Species | Organ | Tissue | Adj P-value | Log2FC | Malignancy |
| 134510 | UBLCP1 | LZE4T | Human | Esophagus | ESCC | 5.67e-11 | 4.58e-01 | 0.0811 |
| 134510 | UBLCP1 | LZE8T | Human | Esophagus | ESCC | 1.40e-04 | 3.12e-01 | 0.067 |
| 134510 | UBLCP1 | LZE20T | Human | Esophagus | ESCC | 1.05e-05 | 1.58e-01 | 0.0662 |
| 134510 | UBLCP1 | LZE24T | Human | Esophagus | ESCC | 4.87e-19 | 5.71e-01 | 0.0596 |
| 134510 | UBLCP1 | LZE6T | Human | Esophagus | ESCC | 8.99e-07 | 5.24e-01 | 0.0845 |
| 134510 | UBLCP1 | P1T-E | Human | Esophagus | ESCC | 2.87e-02 | 2.78e-01 | 0.0875 |
| 134510 | UBLCP1 | P2T-E | Human | Esophagus | ESCC | 3.11e-28 | 5.46e-01 | 0.1177 |
| 134510 | UBLCP1 | P4T-E | Human | Esophagus | ESCC | 1.13e-28 | 6.34e-01 | 0.1323 |
| 134510 | UBLCP1 | P5T-E | Human | Esophagus | ESCC | 2.79e-18 | 3.16e-01 | 0.1327 |
| 134510 | UBLCP1 | P8T-E | Human | Esophagus | ESCC | 1.30e-13 | 2.31e-01 | 0.0889 |
| 134510 | UBLCP1 | P9T-E | Human | Esophagus | ESCC | 1.73e-16 | 3.54e-01 | 0.1131 |
| 134510 | UBLCP1 | P10T-E | Human | Esophagus | ESCC | 3.67e-22 | 2.96e-01 | 0.116 |
| 134510 | UBLCP1 | P11T-E | Human | Esophagus | ESCC | 3.21e-24 | 8.35e-01 | 0.1426 |
| 134510 | UBLCP1 | P12T-E | Human | Esophagus | ESCC | 8.05e-34 | 6.93e-01 | 0.1122 |
| 134510 | UBLCP1 | P15T-E | Human | Esophagus | ESCC | 9.78e-27 | 5.91e-01 | 0.1149 |
| 134510 | UBLCP1 | P16T-E | Human | Esophagus | ESCC | 1.02e-20 | 3.32e-01 | 0.1153 |
| 134510 | UBLCP1 | P17T-E | Human | Esophagus | ESCC | 1.82e-08 | 3.79e-01 | 0.1278 |
| 134510 | UBLCP1 | P19T-E | Human | Esophagus | ESCC | 1.20e-02 | 5.20e-01 | 0.1662 |
| 134510 | UBLCP1 | P20T-E | Human | Esophagus | ESCC | 1.12e-17 | 4.48e-01 | 0.1124 |
| 134510 | UBLCP1 | P21T-E | Human | Esophagus | ESCC | 3.28e-20 | 4.17e-01 | 0.1617 |
| Page: 1 2 3 4 5 6 |
| Tissue | Expression Dynamics | Abbreviation |
| Esophagus | 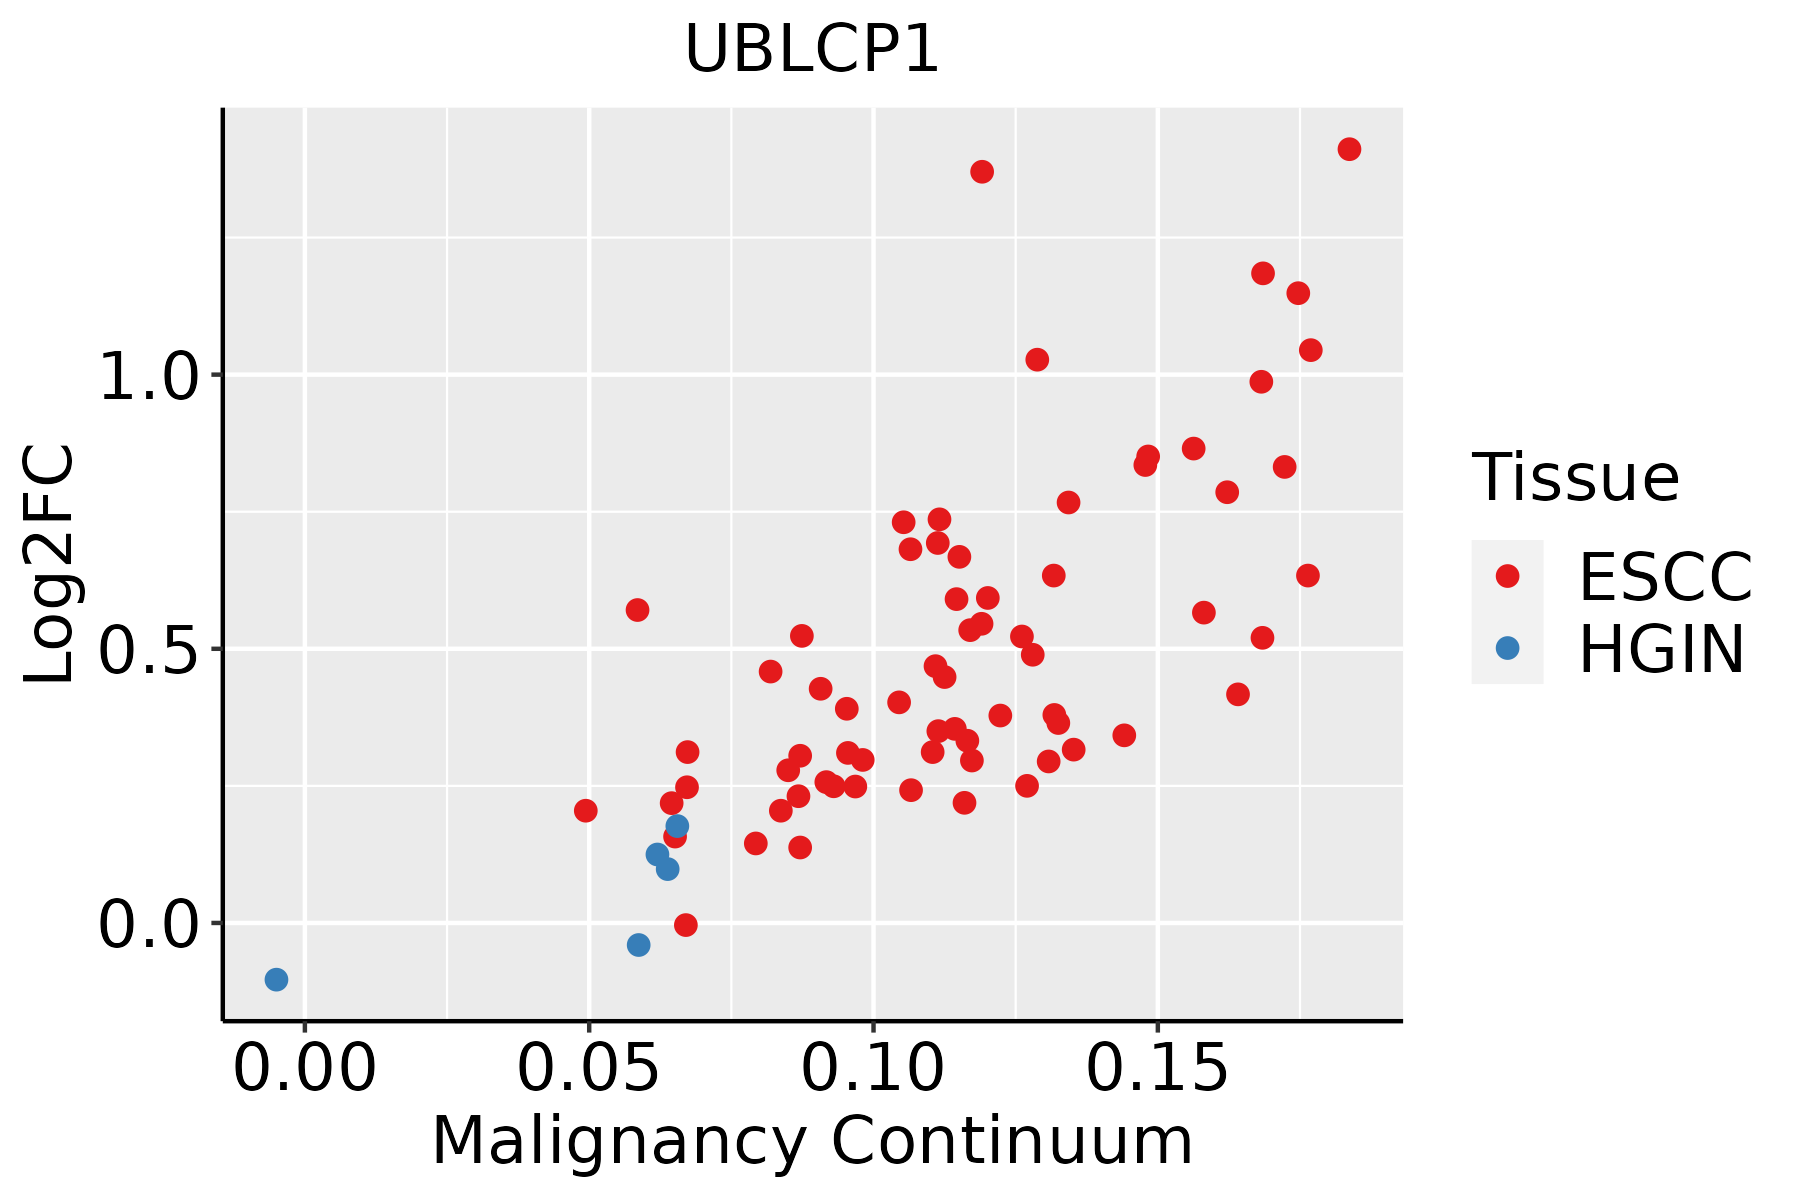 | ESCC: Esophageal squamous cell carcinoma |
| HGIN: High-grade intraepithelial neoplasias | ||
| LGIN: Low-grade intraepithelial neoplasias | ||
| Liver | 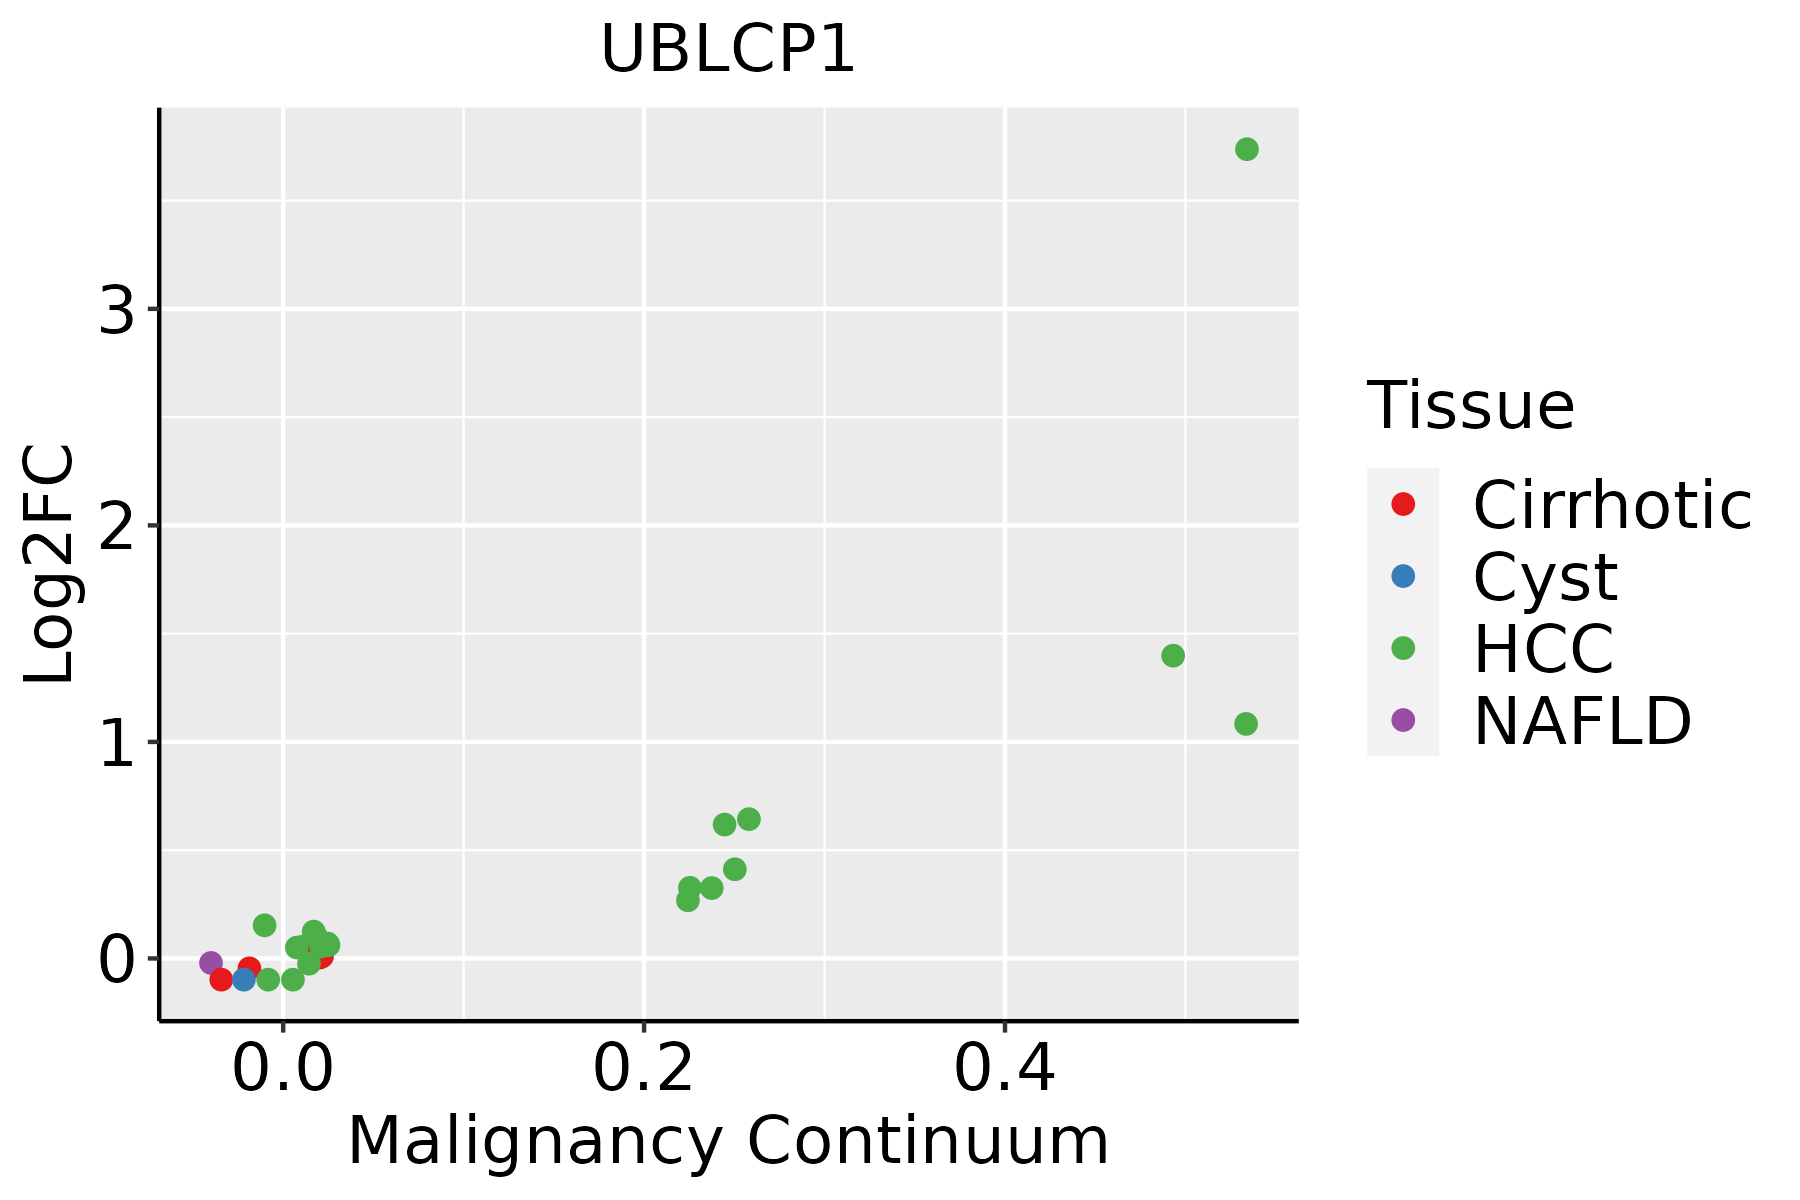 | HCC: Hepatocellular carcinoma |
| NAFLD: Non-alcoholic fatty liver disease | ||
| Oral Cavity | 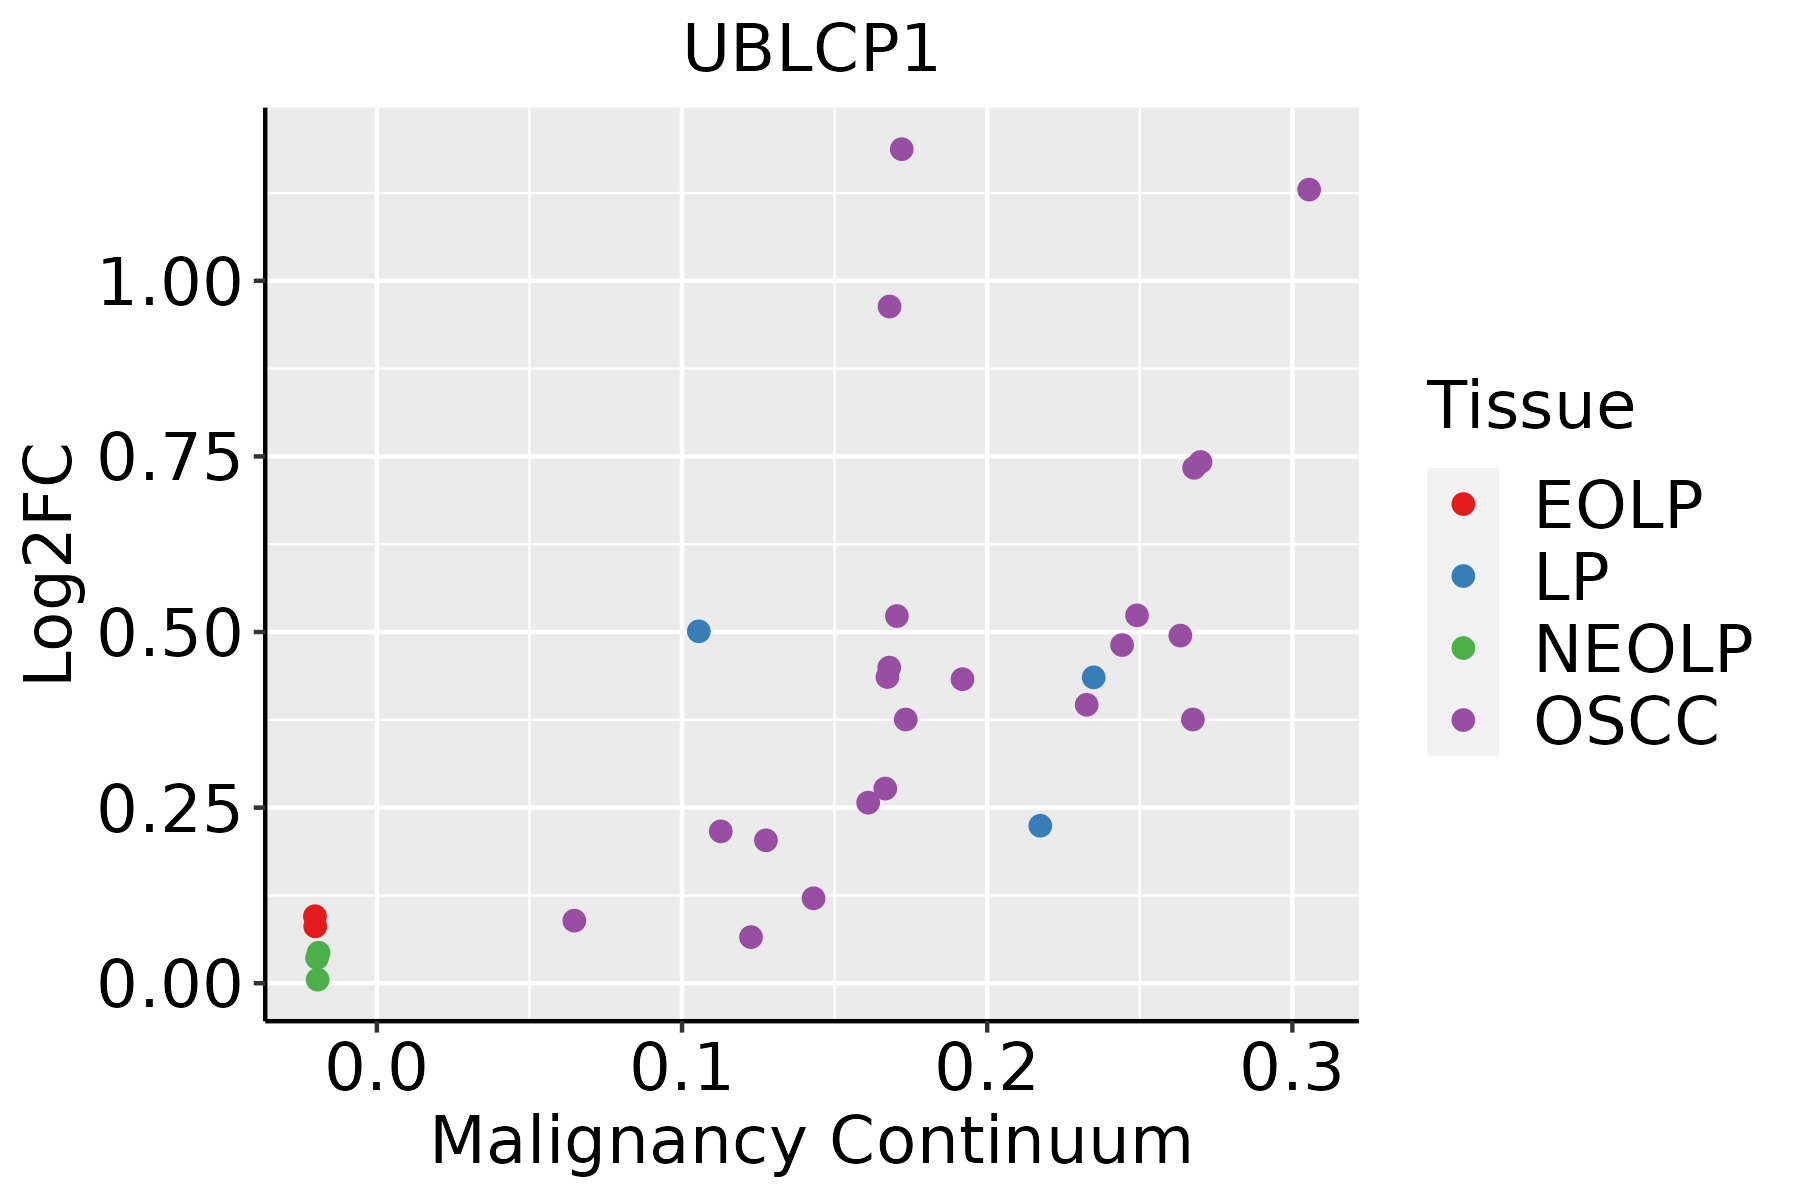 | EOLP: Erosive Oral lichen planus |
| LP: leukoplakia | ||
| NEOLP: Non-erosive oral lichen planus | ||
| OSCC: Oral squamous cell carcinoma | ||
| Skin | 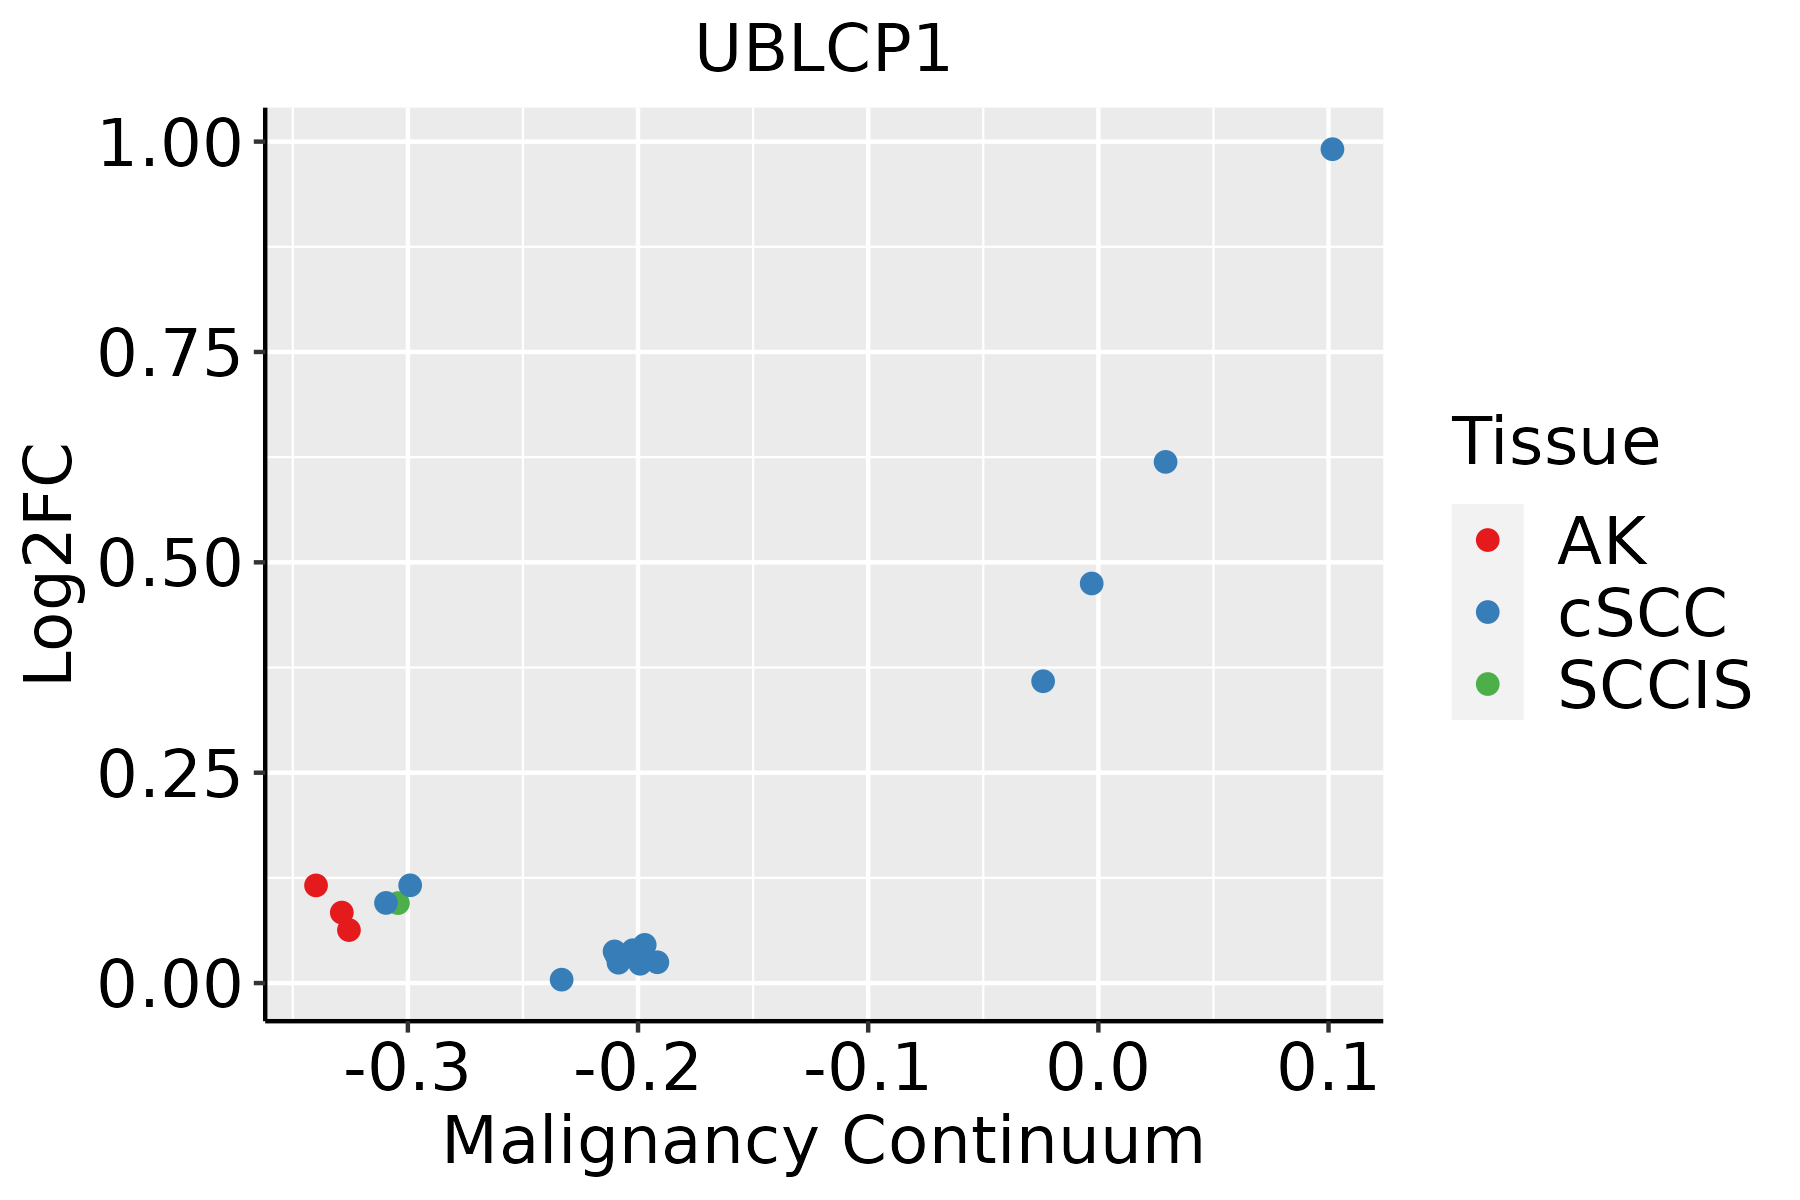 | AK: Actinic keratosis |
| cSCC: Cutaneous squamous cell carcinoma | ||
| SCCIS:squamous cell carcinoma in situ | ||
| Thyroid | 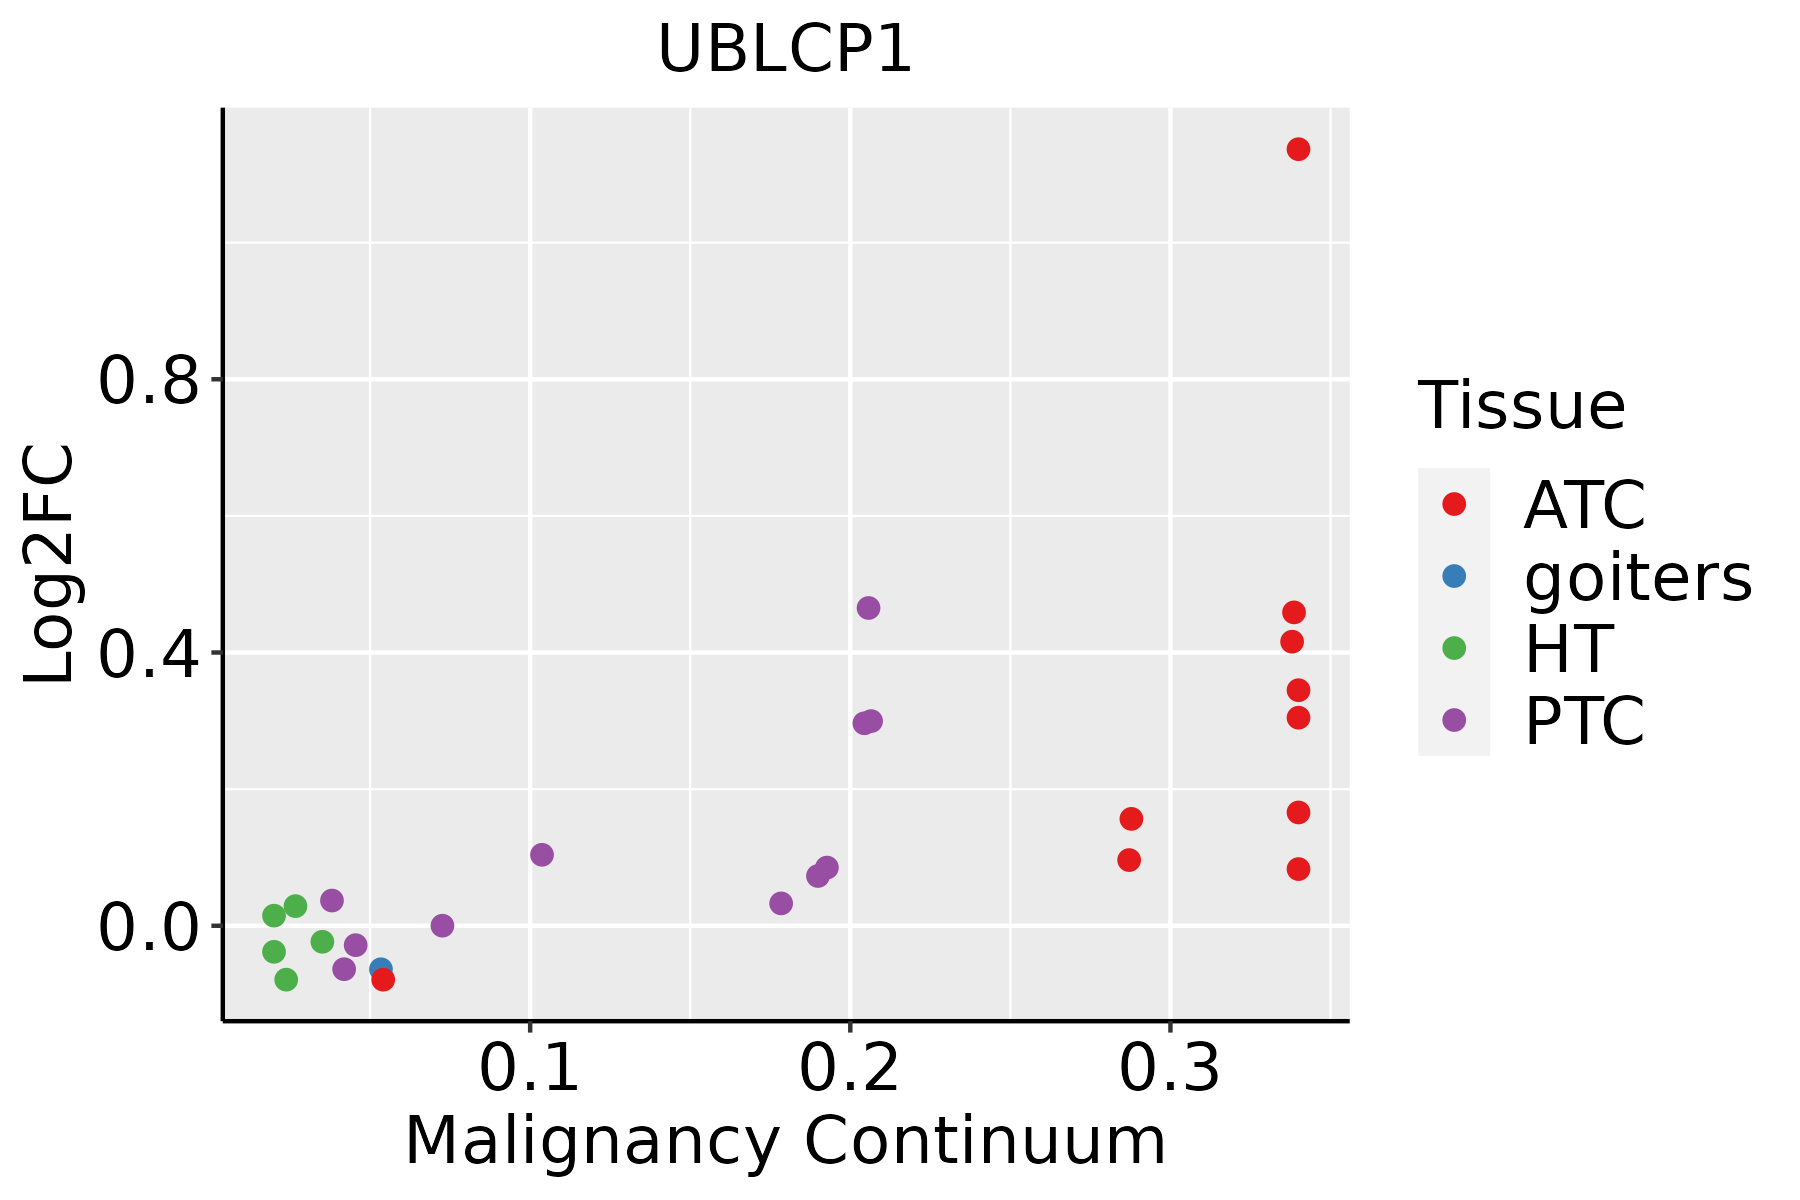 | ATC: Anaplastic thyroid cancer |
| HT: Hashimoto's thyroiditis | ||
| PTC: Papillary thyroid cancer |
| ∗log2FC in expression of this searched gene in stem-like cells from each diseased tissue sample relative to stem-like cells in normal samples in each tissue plotted against the malignancy continuum. Samples are colored based on if they are from different disease stage. |
Top |
Malignant transformation related pathway analysis |
| Find out the enriched GO biological processes and KEGG pathways involved in transition from healthy to precancer to cancer |
| Tissue | Disease Stage | Enriched GO biological Processes |
| Colorectum | AD |  |
| Colorectum | SER |  |
| Colorectum | MSS |  |
| Colorectum | MSI-H |  |
| Colorectum | FAP |  |
| ∗Top 15 enriched GO BP terms are showed in the bar plot of each disease state in each tissue. Each row represents a significant GO biological process which is colored according to the -log10(p.adjust). |
| Page: 1 2 3 4 5 6 7 8 9 |
| GO ID | Tissue | Disease Stage | Description | Gene Ratio | Bg Ratio | pvalue | p.adjust | Count |
| GO:001631110 | Esophagus | ESCC | dephosphorylation | 251/8552 | 417/18723 | 1.26e-09 | 2.99e-08 | 251 |
| GO:000647018 | Esophagus | ESCC | protein dephosphorylation | 177/8552 | 281/18723 | 3.13e-09 | 6.72e-08 | 177 |
| GO:001631121 | Liver | HCC | dephosphorylation | 230/7958 | 417/18723 | 1.00e-07 | 1.96e-06 | 230 |
| GO:000647021 | Liver | HCC | protein dephosphorylation | 162/7958 | 281/18723 | 1.91e-07 | 3.46e-06 | 162 |
| GO:000647015 | Oral cavity | OSCC | protein dephosphorylation | 162/7305 | 281/18723 | 1.56e-10 | 4.56e-09 | 162 |
| GO:00163119 | Oral cavity | OSCC | dephosphorylation | 220/7305 | 417/18723 | 6.33e-09 | 1.34e-07 | 220 |
| GO:000647024 | Skin | cSCC | protein dephosphorylation | 111/4864 | 281/18723 | 4.10e-07 | 7.96e-06 | 111 |
| GO:001631115 | Skin | cSCC | dephosphorylation | 134/4864 | 417/18723 | 2.65e-03 | 1.50e-02 | 134 |
| GO:001631116 | Thyroid | PTC | dephosphorylation | 174/5968 | 417/18723 | 1.20e-05 | 1.31e-04 | 174 |
| GO:000647020 | Thyroid | PTC | protein dephosphorylation | 123/5968 | 281/18723 | 1.69e-05 | 1.77e-04 | 123 |
| GO:0006470111 | Thyroid | ATC | protein dephosphorylation | 129/6293 | 281/18723 | 1.11e-05 | 1.09e-04 | 129 |
| GO:001631117 | Thyroid | ATC | dephosphorylation | 179/6293 | 417/18723 | 3.88e-05 | 3.15e-04 | 179 |
| Page: 1 |
| Pathway ID | Tissue | Disease Stage | Description | Gene Ratio | Bg Ratio | pvalue | p.adjust | qvalue | Count |
| Page: 1 |
Top |
Cell-cell communication analysis |
| Identification of potential cell-cell interactions between two cell types and their ligand-receptor pairs for different disease states |
| Ligand | Receptor | LRpair | Pathway | Tissue | Disease Stage |
| Page: 1 |
Top |
Single-cell gene regulatory network inference analysis |
| Find out the significant the regulons (TFs) and the target genes of each regulon across cell types for different disease states |
| TF | Cell Type | Tissue | Disease Stage | Target Gene | RSS | Regulon Activity |
| ∗The dot plots of a searched regulon are shown for all cell subpopulations in each disease state of each tissue based on the regulon specific score inferred using pySCENIC and by calculating the average expression. |
| Page: 1 |
Top |
Somatic mutation of malignant transformation related genes |
| Annotation of somatic variants for genes involved in malignant transformation |
| Hugo Symbol | Variant Class | Variant Classification | dbSNP RS | HGVSc | HGVSp | HGVSp Short | SWISSPROT | BIOTYPE | SIFT | PolyPhen | Tumor Sample Barcode | Tissue | Histology | Sex | Age | Stage | Therapy Types | Drugs | Outcome |
| UBLCP1 | SNV | Missense_Mutation | novel | c.816G>A | p.Met272Ile | p.M272I | Q8WVY7 | protein_coding | deleterious(0) | benign(0.001) | TCGA-AC-A3W6-01 | Breast | breast invasive carcinoma | Female | >=65 | III/IV | Unknown | Unknown | SD |
| UBLCP1 | SNV | Missense_Mutation | c.319N>A | p.Glu107Lys | p.E107K | Q8WVY7 | protein_coding | tolerated(0.55) | benign(0.003) | TCGA-E2-A10C-01 | Breast | breast invasive carcinoma | Female | <65 | I/II | Chemotherapy | cytoxan | SD | |
| UBLCP1 | SNV | Missense_Mutation | novel | c.668G>C | p.Arg223Thr | p.R223T | Q8WVY7 | protein_coding | tolerated(0.09) | benign(0.08) | TCGA-OL-A66L-01 | Breast | breast invasive carcinoma | Female | >=65 | I/II | Unknown | Unknown | SD |
| UBLCP1 | SNV | Missense_Mutation | rs750036093 | c.719N>T | p.Ser240Leu | p.S240L | Q8WVY7 | protein_coding | deleterious(0.01) | benign(0.084) | TCGA-JW-A5VL-01 | Cervix | cervical & endocervical cancer | Female | <65 | I/II | Unknown | Unknown | SD |
| UBLCP1 | SNV | Missense_Mutation | novel | c.410N>C | p.Lys137Thr | p.K137T | Q8WVY7 | protein_coding | deleterious(0) | possibly_damaging(0.88) | TCGA-AA-3984-01 | Colorectum | colon adenocarcinoma | Female | <65 | I/II | Unknown | Unknown | SD |
| UBLCP1 | SNV | Missense_Mutation | c.950N>A | p.Gly317Glu | p.G317E | Q8WVY7 | protein_coding | tolerated_low_confidence(1) | benign(0.018) | TCGA-AA-A010-01 | Colorectum | colon adenocarcinoma | Female | <65 | I/II | Chemotherapy | folinic | CR | |
| UBLCP1 | SNV | Missense_Mutation | c.79N>A | p.Asp27Asn | p.D27N | Q8WVY7 | protein_coding | tolerated(0.21) | benign(0.437) | TCGA-CA-6717-01 | Colorectum | colon adenocarcinoma | Male | <65 | I/II | Chemotherapy | oxaliplatin | CR | |
| UBLCP1 | SNV | Missense_Mutation | c.796N>A | p.Leu266Ile | p.L266I | Q8WVY7 | protein_coding | deleterious(0) | probably_damaging(0.983) | TCGA-DM-A1D4-01 | Colorectum | colon adenocarcinoma | Male | >=65 | I/II | Unknown | Unknown | PD | |
| UBLCP1 | SNV | Missense_Mutation | c.173N>G | p.Asp58Gly | p.D58G | Q8WVY7 | protein_coding | tolerated(0.15) | benign(0.005) | TCGA-DY-A0XA-01 | Colorectum | rectum adenocarcinoma | Female | <65 | I/II | Chemotherapy | mayo | CR | |
| UBLCP1 | SNV | Missense_Mutation | novel | c.320N>C | p.Glu107Ala | p.E107A | Q8WVY7 | protein_coding | tolerated(0.75) | benign(0.001) | TCGA-A5-A0G1-01 | Endometrium | uterine corpus endometrioid carcinoma | Female | >=65 | I/II | Unknown | Unknown | SD |
| Page: 1 2 3 4 |
Top |
Related drugs of malignant transformation related genes |
| Identification of chemicals and drugs interact with genes involved in malignant transfromation |
| (DGIdb 4.0) |
| Entrez ID | Symbol | Category | Interaction Types | Drug Claim Name | Drug Name | PMIDs |
| Page: 1 |

Copyright 2023-Present -The University of Texas Health Science Center at Houston |