Schematic overview of the cellular and molecular mechanisms involved in the cancer progression, including the proposed cellular and molecular mechanisms in cancer cells trajectory. AT1: alveolar type 1 cells; AT2: alveolar type 2 cells; AAH: atypical adenomatous hyperplasia; AIS: adenocarcinoma in situ; MIA: minimally invasive adenocarcinoma; IA: invasive adenocarcinoma; EMT: epithelial-mesenchymal transition

Home

Download

Statistics

Help

Contact

Center for Computational Systems Medicine
leaf

Gene summary

leaf

Malignant transformation analysis

leaf

Malignant transformation related pathway analysis

leaf

Cell-cell communication analysis

leaf

Single-cell gene regulatory network inference analysis

leaf

Somatic mutation of malignant transformation related genes

leaf

Related drugs of malignant transformation related genes

Gene: UBL4A

Gene summary for UBL4A

check button Gene summary.

Gene informationSpeciesHuman
Gene symbol

UBL4A

Gene ID

8266

Gene nameubiquitin like 4A
Gene AliasDX254E
CytomapXq28
Gene Typeprotein-coding
GO ID

GO:0006464

UniProtAcc

P11441


Top

Malignant transformation analysis

check button Identification of the aberrant gene expression in precancerous and cancerous lesions by comparing the gene expression of stem-like cells in diseased tissues with normal stem cells
check button Malignant transformation involving gene list.
Entrez IDSymbolReplicatesSpeciesOrganTissueAdj P-valueLog2FCMalignancy
8266UBL4ALZE4THumanEsophagusESCC1.76e-051.47e-010.0811
8266UBL4ALZE7THumanEsophagusESCC2.21e-074.11e-010.0667
8266UBL4ALZE20THumanEsophagusESCC2.53e-031.21e-010.0662
8266UBL4ALZE22THumanEsophagusESCC1.67e-043.24e-010.068
8266UBL4ALZE24THumanEsophagusESCC4.31e-184.52e-010.0596
8266UBL4ALZE6THumanEsophagusESCC3.91e-063.03e-010.0845
8266UBL4AP1T-EHumanEsophagusESCC1.53e-106.32e-010.0875
8266UBL4AP2T-EHumanEsophagusESCC6.48e-326.33e-010.1177
8266UBL4AP4T-EHumanEsophagusESCC3.44e-194.16e-010.1323
8266UBL4AP5T-EHumanEsophagusESCC2.05e-234.75e-010.1327
8266UBL4AP8T-EHumanEsophagusESCC1.84e-222.36e-010.0889
8266UBL4AP9T-EHumanEsophagusESCC1.66e-173.76e-010.1131
8266UBL4AP10T-EHumanEsophagusESCC3.69e-396.09e-010.116
8266UBL4AP11T-EHumanEsophagusESCC6.89e-125.76e-010.1426
8266UBL4AP12T-EHumanEsophagusESCC1.40e-325.51e-010.1122
8266UBL4AP15T-EHumanEsophagusESCC4.42e-113.35e-010.1149
8266UBL4AP16T-EHumanEsophagusESCC2.43e-222.67e-010.1153
8266UBL4AP17T-EHumanEsophagusESCC1.30e-145.56e-010.1278
8266UBL4AP19T-EHumanEsophagusESCC2.25e-111.15e+000.1662
8266UBL4AP20T-EHumanEsophagusESCC7.26e-223.57e-010.1124
Page: 1 2 3 4 5 6 

check button Transcriptomic changes along malignancy continuum.
TissueExpression DynamicsAbbreviation
EsophagusThe image shows the transcriptomic changes along malignancy continuum.log2FC in expression of this searched gene in stem-like cells from each diseased tissue sample relative to stem-like cells in normal samples in each tissue plotted against the malignancy continuum. Samples are colored based on if they are from different disease stage.
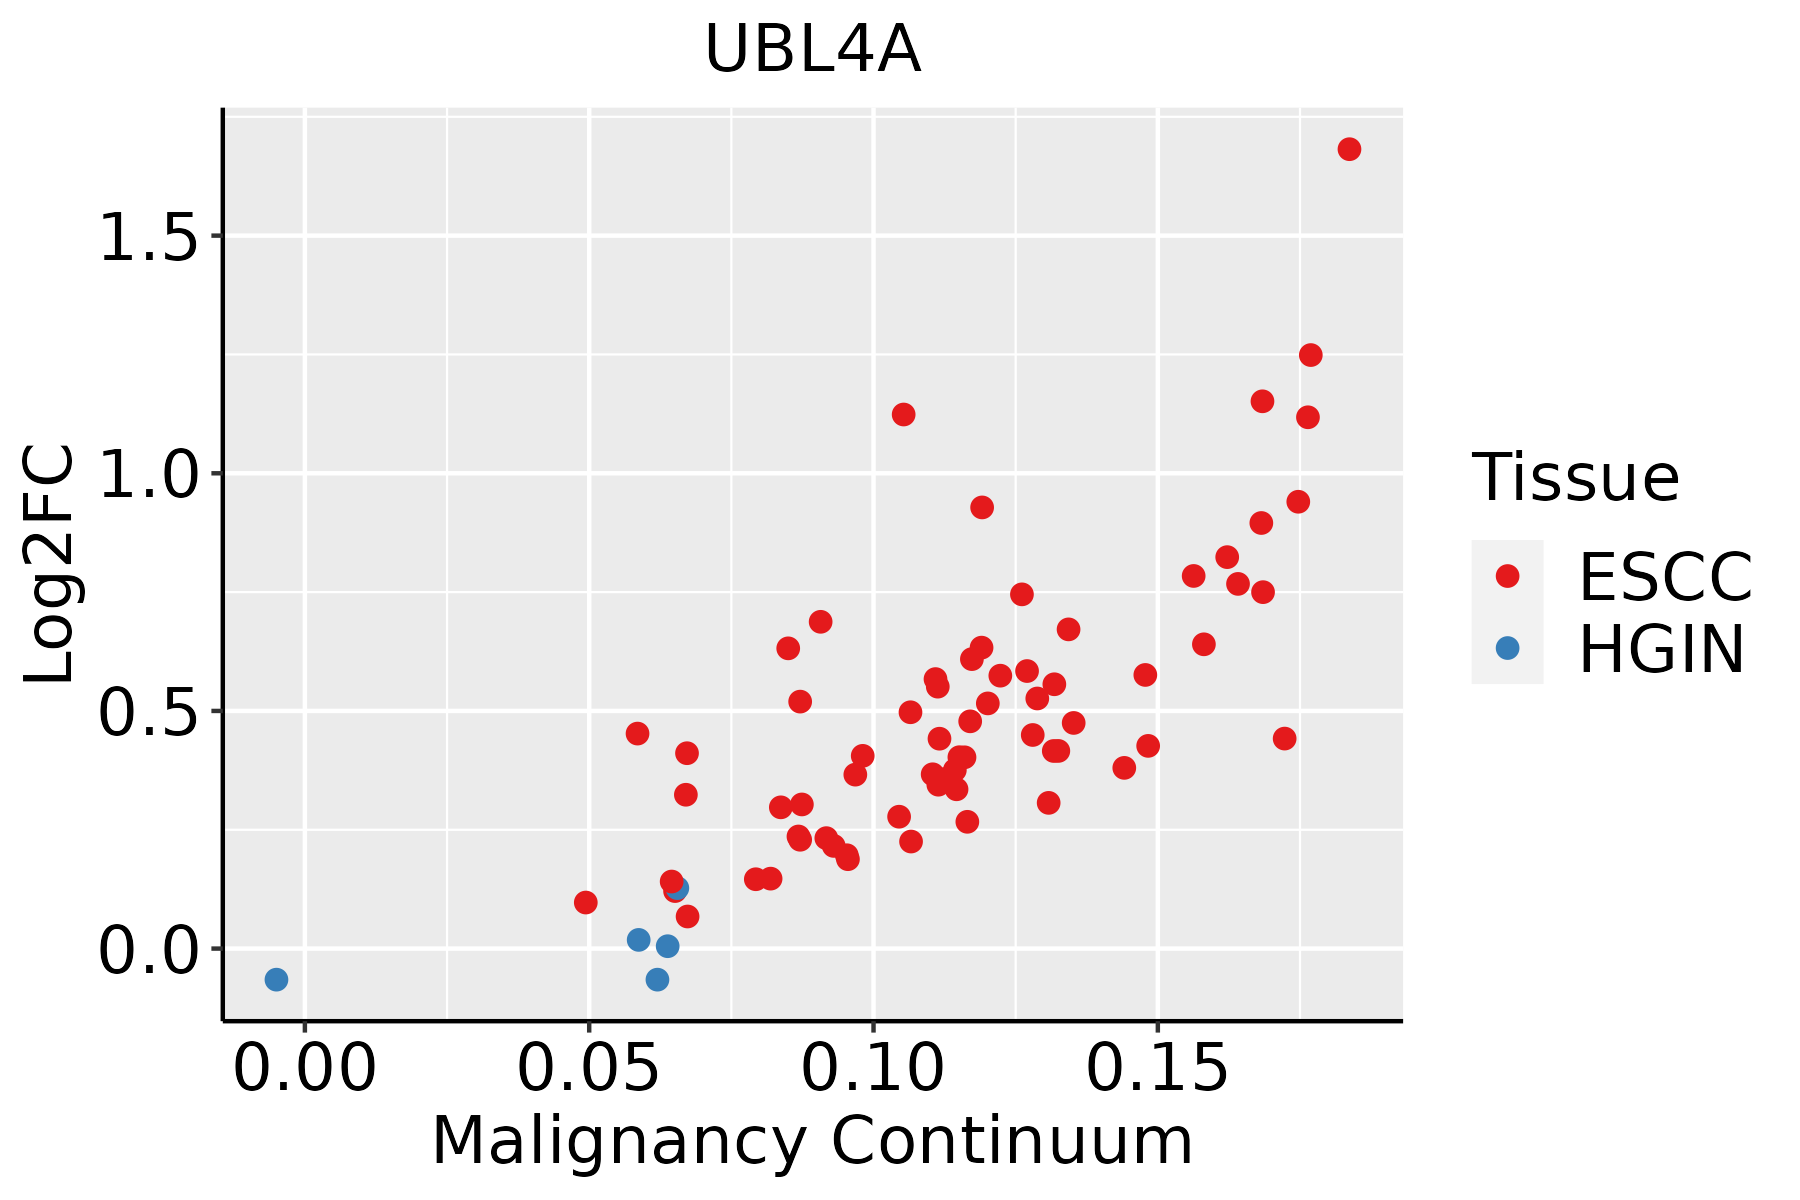
ESCC: Esophageal squamous cell carcinoma
HGIN: High-grade intraepithelial neoplasias
LGIN: Low-grade intraepithelial neoplasias
LiverThe image shows the transcriptomic changes along malignancy continuum.log2FC in expression of this searched gene in stem-like cells from each diseased tissue sample relative to stem-like cells in normal samples in each tissue plotted against the malignancy continuum. Samples are colored based on if they are from different disease stage.
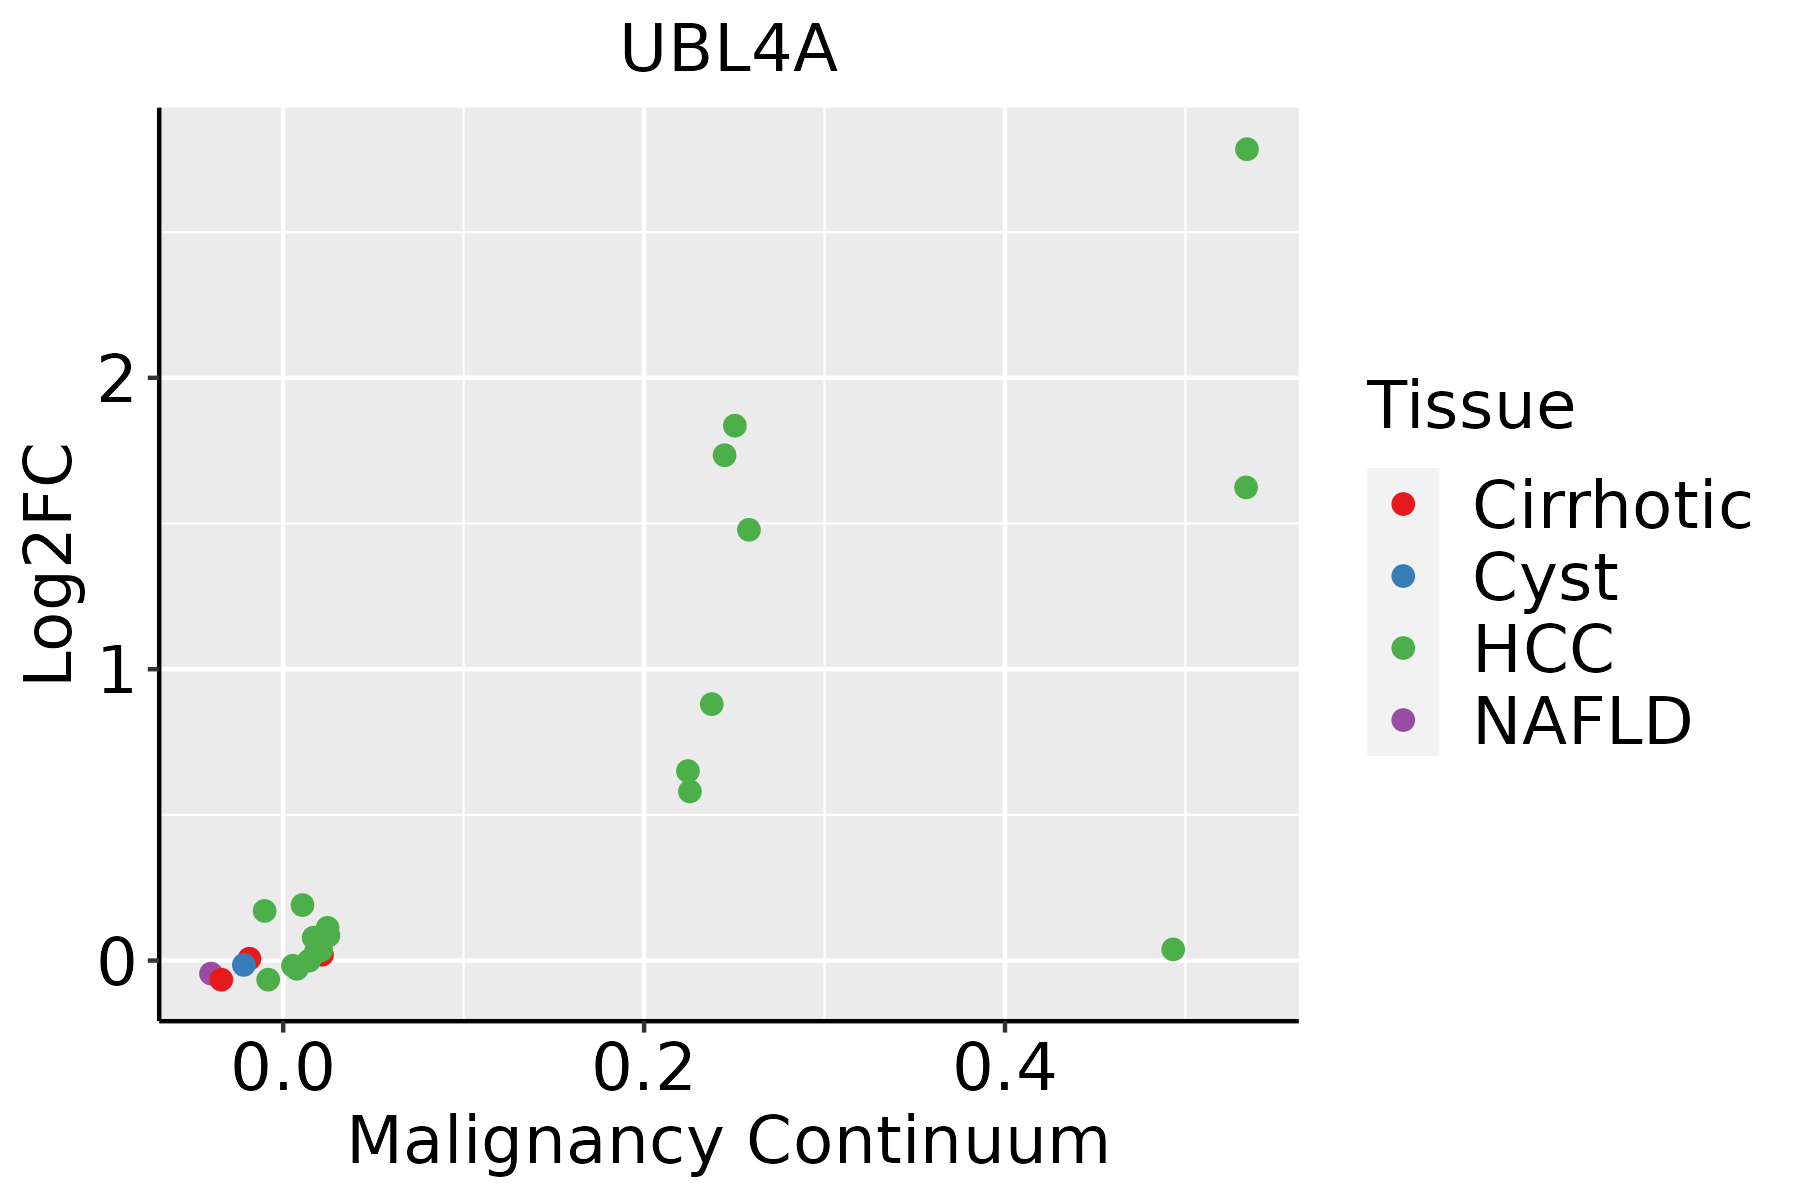
HCC: Hepatocellular carcinoma
NAFLD: Non-alcoholic fatty liver disease
Oral CavityThe image shows the transcriptomic changes along malignancy continuum.log2FC in expression of this searched gene in stem-like cells from each diseased tissue sample relative to stem-like cells in normal samples in each tissue plotted against the malignancy continuum. Samples are colored based on if they are from different disease stage.
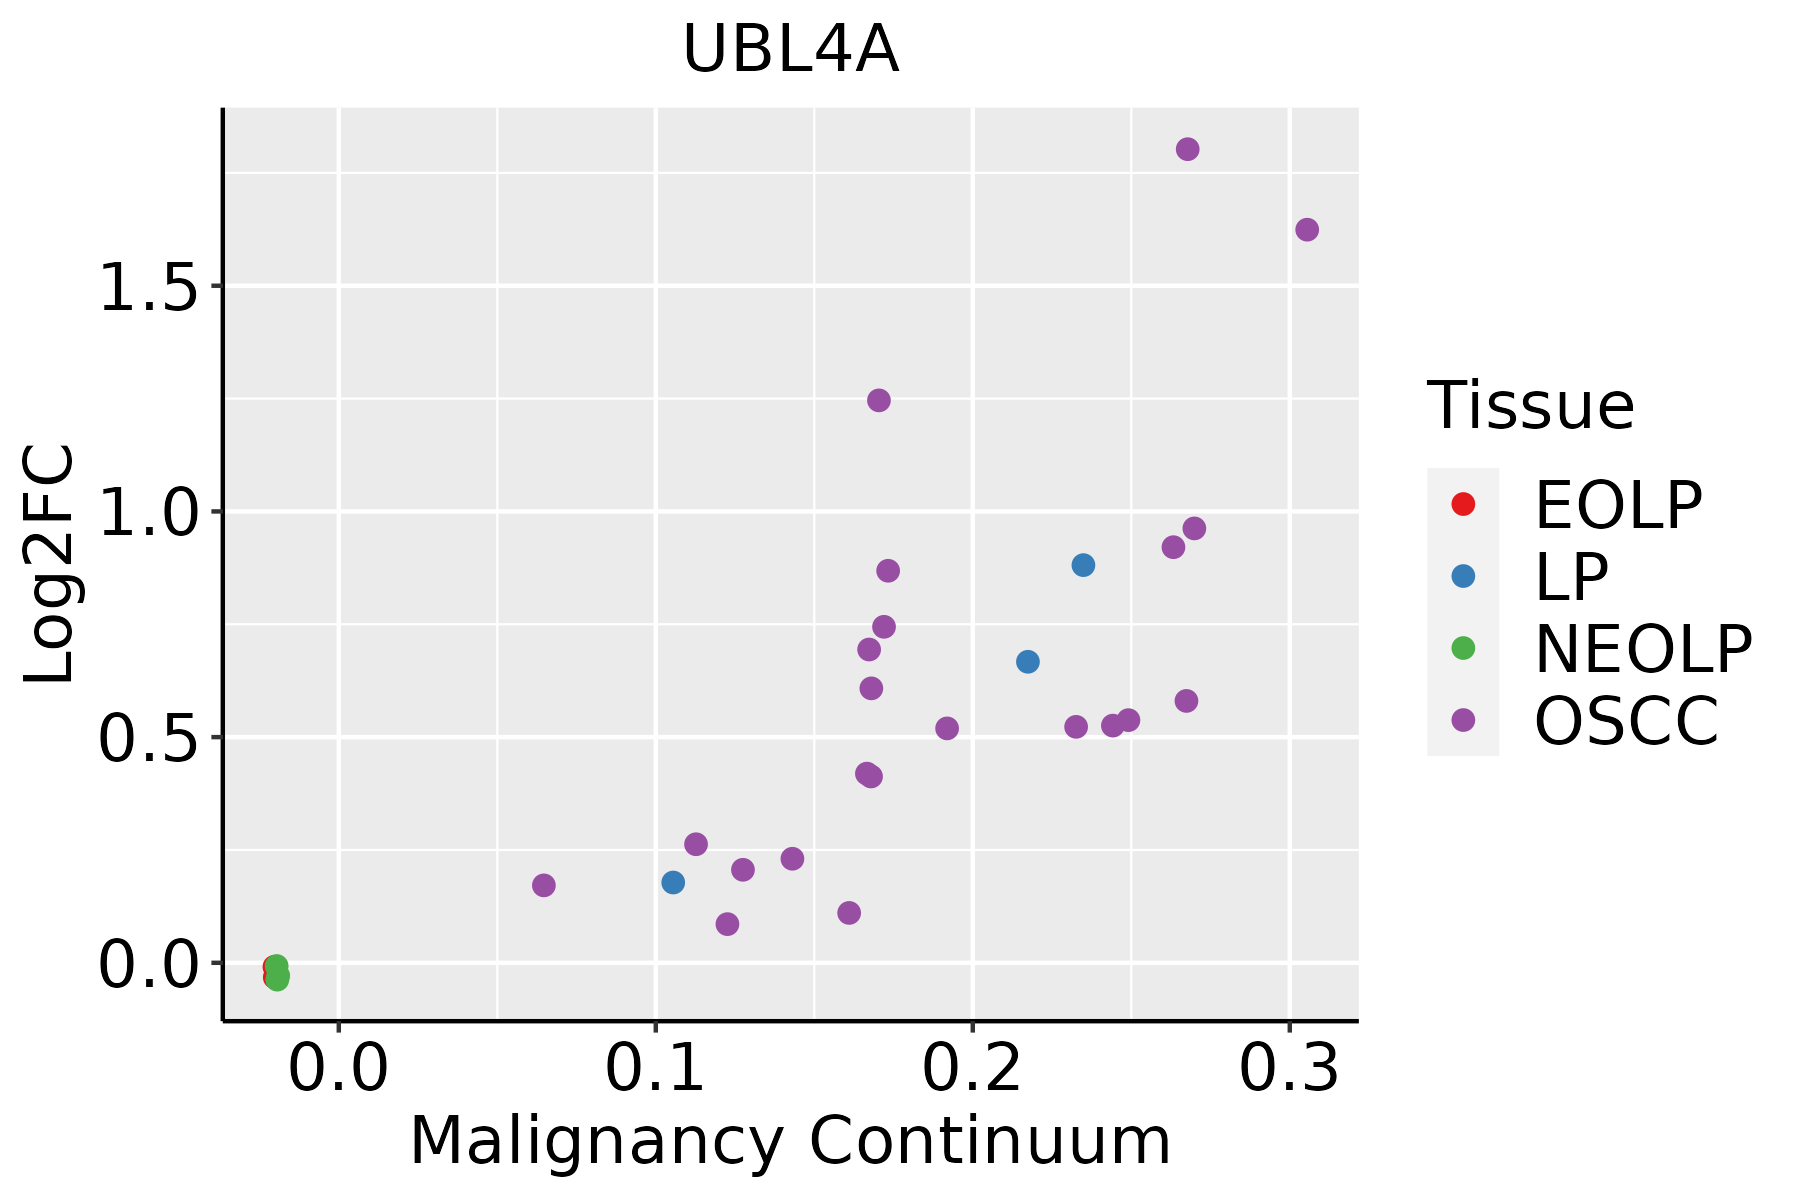
EOLP: Erosive Oral lichen planus
LP: leukoplakia
NEOLP: Non-erosive oral lichen planus
OSCC: Oral squamous cell carcinoma
SkinThe image shows the transcriptomic changes along malignancy continuum.log2FC in expression of this searched gene in stem-like cells from each diseased tissue sample relative to stem-like cells in normal samples in each tissue plotted against the malignancy continuum. Samples are colored based on if they are from different disease stage.
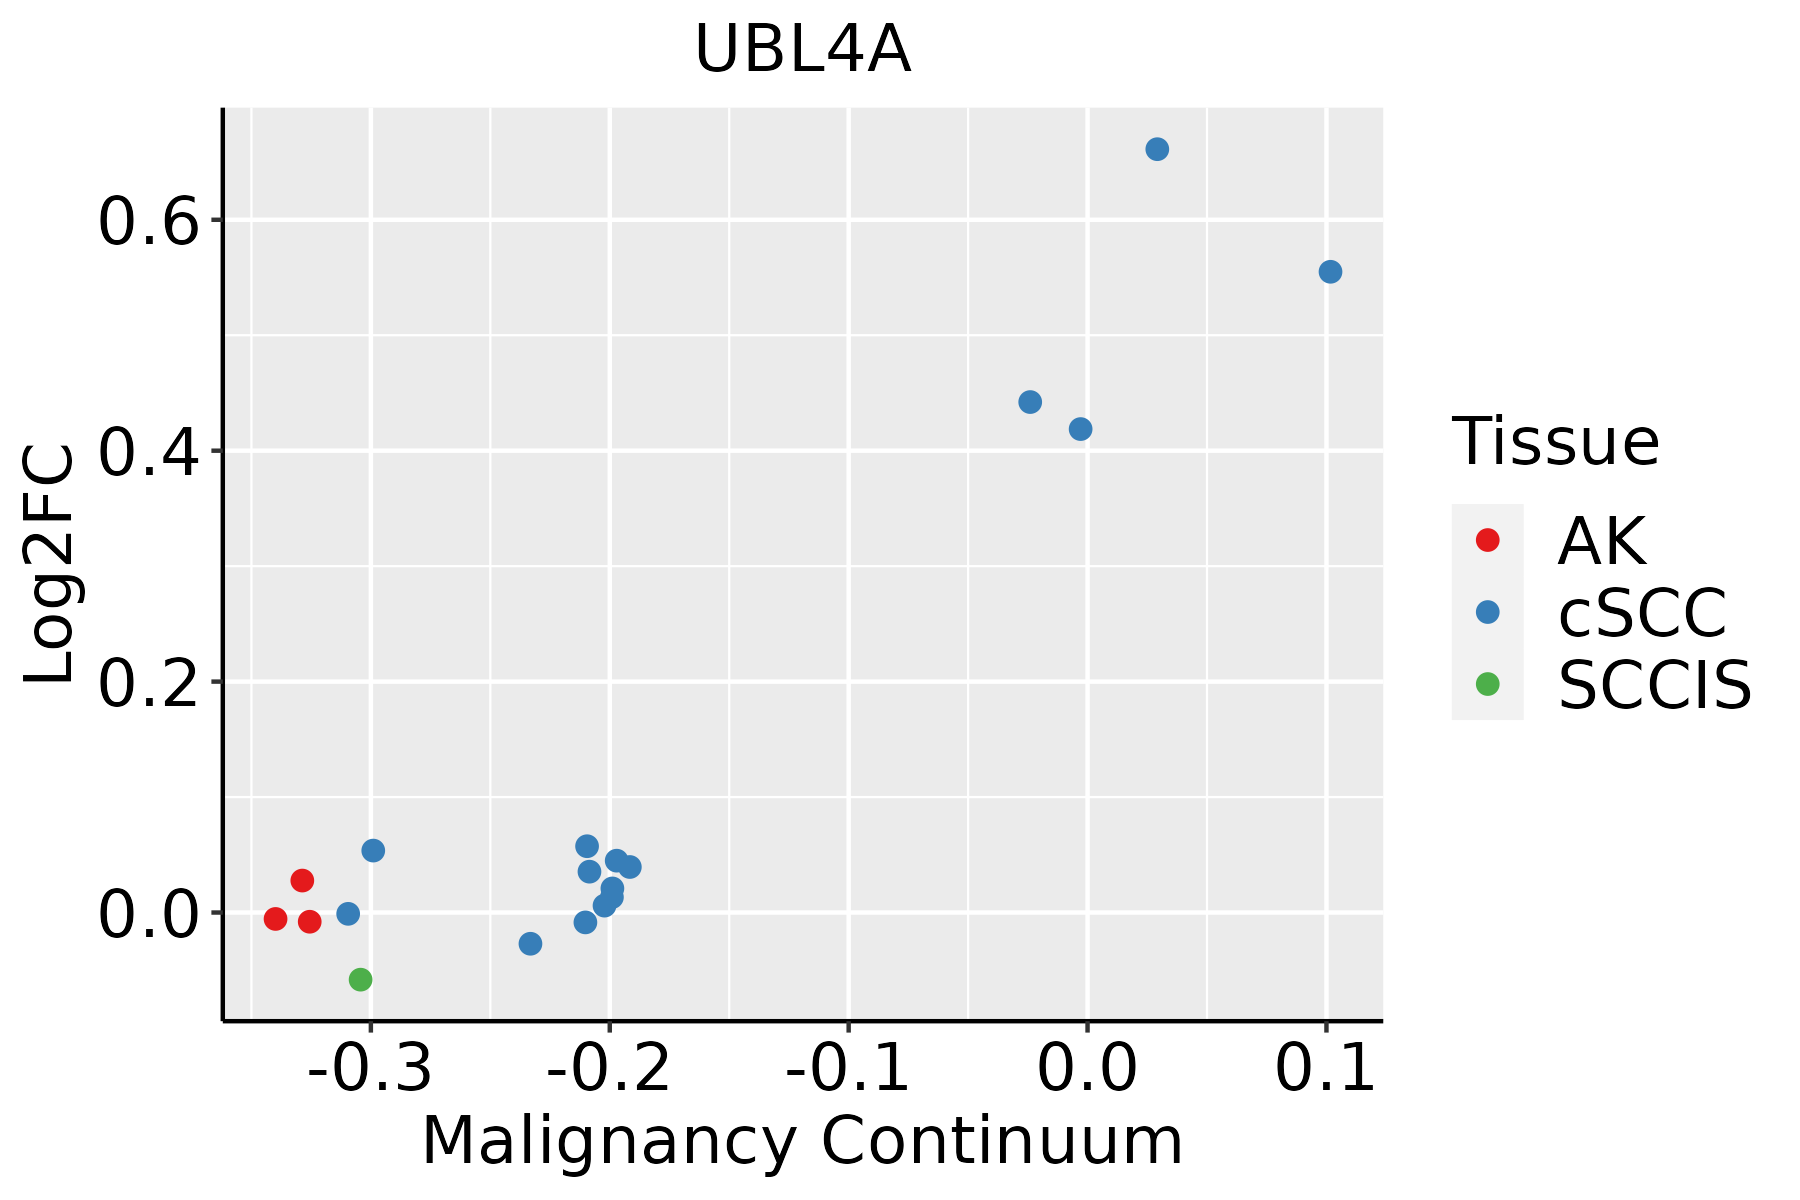
AK: Actinic keratosis
cSCC: Cutaneous squamous cell carcinoma
SCCIS:squamous cell carcinoma in situ
ThyroidThe image shows the transcriptomic changes along malignancy continuum.log2FC in expression of this searched gene in stem-like cells from each diseased tissue sample relative to stem-like cells in normal samples in each tissue plotted against the malignancy continuum. Samples are colored based on if they are from different disease stage.ATC: Anaplastic thyroid cancer
HT: Hashimoto's thyroiditis
PTC: Papillary thyroid cancer
∗log2FC in expression of this searched gene in stem-like cells from each diseased tissue sample relative to stem-like cells in normal samples in each tissue plotted against the malignancy continuum. Samples are colored based on if they are from different disease stage.

Top

Malignant transformation related pathway analysis

check buttonFind out the enriched GO biological processes and KEGG pathways involved in transition from healthy to precancer to cancer
check button Figure of enriched GO biological processes.
TissueDisease StageEnriched GO biological Processes
ColorectumADGO analysis - Figure of enriched GO biological processes: Top 15 enriched GO BP terms are showed in the bar plot of each disease state in each tissue. Each row represents a significant GO biological process which is colored according to the -log10(p.adjust).
ColorectumSERGO analysis - Figure of enriched GO biological processes: Top 15 enriched GO BP terms are showed in the bar plot of each disease state in each tissue. Each row represents a significant GO biological process which is colored according to the -log10(p.adjust).
ColorectumMSSGO analysis - Figure of enriched GO biological processes: Top 15 enriched GO BP terms are showed in the bar plot of each disease state in each tissue. Each row represents a significant GO biological process which is colored according to the -log10(p.adjust).
ColorectumMSI-HGO analysis - Figure of enriched GO biological processes: Top 15 enriched GO BP terms are showed in the bar plot of each disease state in each tissue. Each row represents a significant GO biological process which is colored according to the -log10(p.adjust).
ColorectumFAPGO analysis - Figure of enriched GO biological processes: Top 15 enriched GO BP terms are showed in the bar plot of each disease state in each tissue. Each row represents a significant GO biological process which is colored according to the -log10(p.adjust).
∗Top 15 enriched GO BP terms are showed in the bar plot of each disease state in each tissue. Each row represents a significant GO biological process which is colored according to the -log10(p.adjust).
Page: 1 2 3 4 5 6 7 8 9 

check button Enriched GO biological processes.
GO IDTissueDisease StageDescriptionGene RatioBg Ratiopvaluep.adjustCount
GO:0090150110EsophagusESCCestablishment of protein localization to membrane182/8552260/187231.27e-158.19e-14182
GO:000702914EsophagusESCCendoplasmic reticulum organization65/855287/187233.28e-086.08e-0765
GO:005120515EsophagusESCCprotein insertion into membrane46/855257/187235.90e-081.04e-0646
GO:004504812EsophagusESCCprotein insertion into ER membrane21/855222/187238.75e-071.13e-0521
GO:007181611EsophagusESCCtail-anchored membrane protein insertion into ER membrane17/855217/187231.63e-061.95e-0517
GO:009015012LiverHCCestablishment of protein localization to membrane168/7958260/187234.07e-132.13e-11168
GO:000702911LiverHCCendoplasmic reticulum organization64/795887/187233.92e-091.04e-0764
GO:005120511LiverHCCprotein insertion into membrane41/795857/187236.42e-067.83e-0541
GO:0071816LiverHCCtail-anchored membrane protein insertion into ER membrane15/795817/187231.31e-041.07e-0315
GO:00450481LiverHCCprotein insertion into ER membrane18/795822/187231.91e-041.49e-0318
GO:009015018Oral cavityOSCCestablishment of protein localization to membrane163/7305260/187237.13e-154.47e-13163
GO:00070294Oral cavityOSCCendoplasmic reticulum organization58/730587/187231.59e-072.61e-0658
GO:00512056Oral cavityOSCCprotein insertion into membrane40/730557/187231.81e-062.34e-0540
GO:00450482Oral cavityOSCCprotein insertion into ER membrane17/730522/187232.99e-041.87e-0317
GO:00718162Oral cavityOSCCtail-anchored membrane protein insertion into ER membrane14/730517/187233.31e-042.04e-0314
GO:009015019Oral cavityLPestablishment of protein localization to membrane128/4623260/187237.19e-181.19e-15128
GO:005120514Oral cavityLPprotein insertion into membrane35/462357/187234.38e-091.86e-0735
GO:000702913Oral cavityLPendoplasmic reticulum organization41/462387/187234.49e-069.16e-0541
GO:004504811Oral cavityLPprotein insertion into ER membrane15/462322/187232.08e-053.44e-0415
GO:00718161Oral cavityLPtail-anchored membrane protein insertion into ER membrane12/462317/187238.70e-051.10e-0312
Page: 1 2 

check button Enriched KEGG pathways.
Pathway IDTissueDisease StageDescriptionGene RatioBg Ratiopvaluep.adjustqvalueCount
Page: 1 

Top

Cell-cell communication analysis

check buttonIdentification of potential cell-cell interactions between two cell types and their ligand-receptor pairs for different disease states
LigandReceptorLRpairPathwayTissueDisease Stage
Page: 1 

Top

Single-cell gene regulatory network inference analysis

check buttonFind out the significant the regulons (TFs) and the target genes of each regulon across cell types for different disease states
TFCell TypeTissueDisease StageTarget GeneRSSRegulon Activity
∗The dot plots of a searched regulon are shown for all cell subpopulations in each disease state of each tissue based on the regulon specific score inferred using pySCENIC and by calculating the average expression.
Page: 1 

Top

Somatic mutation of malignant transformation related genes

check buttonAnnotation of somatic variants for genes involved in malignant transformation
Hugo SymbolVariant ClassVariant ClassificationdbSNP RSHGVScHGVSpHGVSp ShortSWISSPROTBIOTYPESIFTPolyPhenTumor Sample BarcodeTissueHistologySexAgeStageTherapy TypesDrugsOutcome
UBL4AinsertionFrame_Shift_Insnovelc.385_386insCAATCATTTTGp.Arg129ProfsTer6p.R129Pfs*6P11441protein_codingTCGA-E9-A1NI-01Breastbreast invasive carcinomaFemale<65I/IIChemotherapydoxorubicinCR
UBL4ASNVMissense_Mutationrs141549549c.422N>Ap.Arg141Hisp.R141HP11441protein_codingtolerated(0.39)probably_damaging(0.991)TCGA-HM-A4S6-01Cervixcervical & endocervical cancerFemale<65III/IVChemotherapycisplatinCR
UBL4ASNVMissense_Mutationc.255N>Tp.Gln85Hisp.Q85HP11441protein_codingtolerated(0.39)benign(0)TCGA-AP-A059-01Endometriumuterine corpus endometrioid carcinomaFemale>=65I/IIUnknownUnknownSD
UBL4ASNVMissense_Mutationc.331N>Tp.Asp111Tyrp.D111YP11441protein_codingdeleterious(0)probably_damaging(0.997)TCGA-AP-A0LM-01Endometriumuterine corpus endometrioid carcinomaFemale<65III/IVChemotherapycisplatinSD
UBL4ASNVMissense_Mutationrs782395991c.326N>Tp.Ala109Valp.A109VP11441protein_codingdeleterious(0.05)benign(0)TCGA-B5-A0K4-01Endometriumuterine corpus endometrioid carcinomaFemale<65I/IIChemotherapycarboplatinSD
UBL4ASNVMissense_Mutationrs782531758c.170N>Tp.Ser57Leup.S57LP11441protein_codingdeleterious(0)probably_damaging(0.994)TCGA-B5-A0K9-01Endometriumuterine corpus endometrioid carcinomaFemale>=65I/IIUnknownUnknownSD
UBL4ASNVMissense_Mutationrs782283486c.265G>Ap.Asp89Asnp.D89NP11441protein_codingtolerated(0.35)benign(0.054)TCGA-BK-A0CC-01Endometriumuterine corpus endometrioid carcinomaFemale>=65III/IVChemotherapytaxolPD
UBL4ASNVMissense_Mutationc.362N>Tp.Arg121Metp.R121MP11441protein_codingdeleterious(0)possibly_damaging(0.781)TCGA-D1-A0ZO-01Endometriumuterine corpus endometrioid carcinomaFemale>=65I/IIUnknownUnknownSD
UBL4ASNVMissense_Mutationc.282N>Tp.Gln94Hisp.Q94HP11441protein_codingtolerated(0.11)benign(0.001)TCGA-D1-A0ZO-01Endometriumuterine corpus endometrioid carcinomaFemale>=65I/IIUnknownUnknownSD
UBL4ASNVMissense_Mutationnovelc.427N>Ap.Leu143Metp.L143MP11441protein_codingdeleterious(0)probably_damaging(0.996)TCGA-EY-A1GI-01Endometriumuterine corpus endometrioid carcinomaFemale<65I/IIUnknownUnknownSD
Page: 1 2 

Top

Related drugs of malignant transformation related genes

check buttonIdentification of chemicals and drugs interact with genes involved in malignant transfromation
(DGIdb 4.0)
Entrez IDSymbolCategoryInteraction TypesDrug Claim NameDrug NamePMIDs
Page: 1