
|
|||||
|
 | |
| |
| |
| |
| |
| |
|
Gene: UBIAD1 |
Gene summary for UBIAD1 |
| Gene information | Species | Human | Gene symbol | UBIAD1 | Gene ID | 29914 |
| Gene name | UbiA prenyltransferase domain containing 1 | |
| Gene Alias | SCCD | |
| Cytomap | 1p36.22 | |
| Gene Type | protein-coding | GO ID | GO:0006743 | UniProtAcc | Q9Y5Z9 |
Top |
Malignant transformation analysis |
| Identification of the aberrant gene expression in precancerous and cancerous lesions by comparing the gene expression of stem-like cells in diseased tissues with normal stem cells |
| Entrez ID | Symbol | Replicates | Species | Organ | Tissue | Adj P-value | Log2FC | Malignancy |
| 29914 | UBIAD1 | LZE4T | Human | Esophagus | ESCC | 2.62e-07 | 1.46e-01 | 0.0811 |
| 29914 | UBIAD1 | LZE7T | Human | Esophagus | ESCC | 9.60e-05 | 1.35e-01 | 0.0667 |
| 29914 | UBIAD1 | LZE8T | Human | Esophagus | ESCC | 1.05e-03 | 1.26e-01 | 0.067 |
| 29914 | UBIAD1 | LZE20T | Human | Esophagus | ESCC | 6.99e-03 | 9.05e-02 | 0.0662 |
| 29914 | UBIAD1 | LZE22T | Human | Esophagus | ESCC | 4.45e-04 | 2.40e-01 | 0.068 |
| 29914 | UBIAD1 | LZE24T | Human | Esophagus | ESCC | 2.87e-11 | 3.25e-01 | 0.0596 |
| 29914 | UBIAD1 | LZE6T | Human | Esophagus | ESCC | 2.10e-03 | 1.24e-01 | 0.0845 |
| 29914 | UBIAD1 | P2T-E | Human | Esophagus | ESCC | 2.05e-17 | 2.76e-01 | 0.1177 |
| 29914 | UBIAD1 | P4T-E | Human | Esophagus | ESCC | 1.09e-09 | 2.02e-01 | 0.1323 |
| 29914 | UBIAD1 | P5T-E | Human | Esophagus | ESCC | 3.19e-12 | 2.47e-01 | 0.1327 |
| 29914 | UBIAD1 | P8T-E | Human | Esophagus | ESCC | 8.57e-15 | 1.75e-01 | 0.0889 |
| 29914 | UBIAD1 | P9T-E | Human | Esophagus | ESCC | 1.18e-06 | 1.57e-01 | 0.1131 |
| 29914 | UBIAD1 | P10T-E | Human | Esophagus | ESCC | 4.13e-19 | 3.16e-01 | 0.116 |
| 29914 | UBIAD1 | P11T-E | Human | Esophagus | ESCC | 1.31e-06 | 3.82e-01 | 0.1426 |
| 29914 | UBIAD1 | P12T-E | Human | Esophagus | ESCC | 1.29e-20 | 2.90e-01 | 0.1122 |
| 29914 | UBIAD1 | P15T-E | Human | Esophagus | ESCC | 3.39e-23 | 3.94e-01 | 0.1149 |
| 29914 | UBIAD1 | P16T-E | Human | Esophagus | ESCC | 3.16e-17 | 1.33e-01 | 0.1153 |
| 29914 | UBIAD1 | P17T-E | Human | Esophagus | ESCC | 1.05e-10 | 2.77e-01 | 0.1278 |
| 29914 | UBIAD1 | P20T-E | Human | Esophagus | ESCC | 5.80e-18 | 3.05e-01 | 0.1124 |
| 29914 | UBIAD1 | P21T-E | Human | Esophagus | ESCC | 6.14e-30 | 6.29e-01 | 0.1617 |
| Page: 1 2 3 4 5 |
| Tissue | Expression Dynamics | Abbreviation |
| Esophagus | 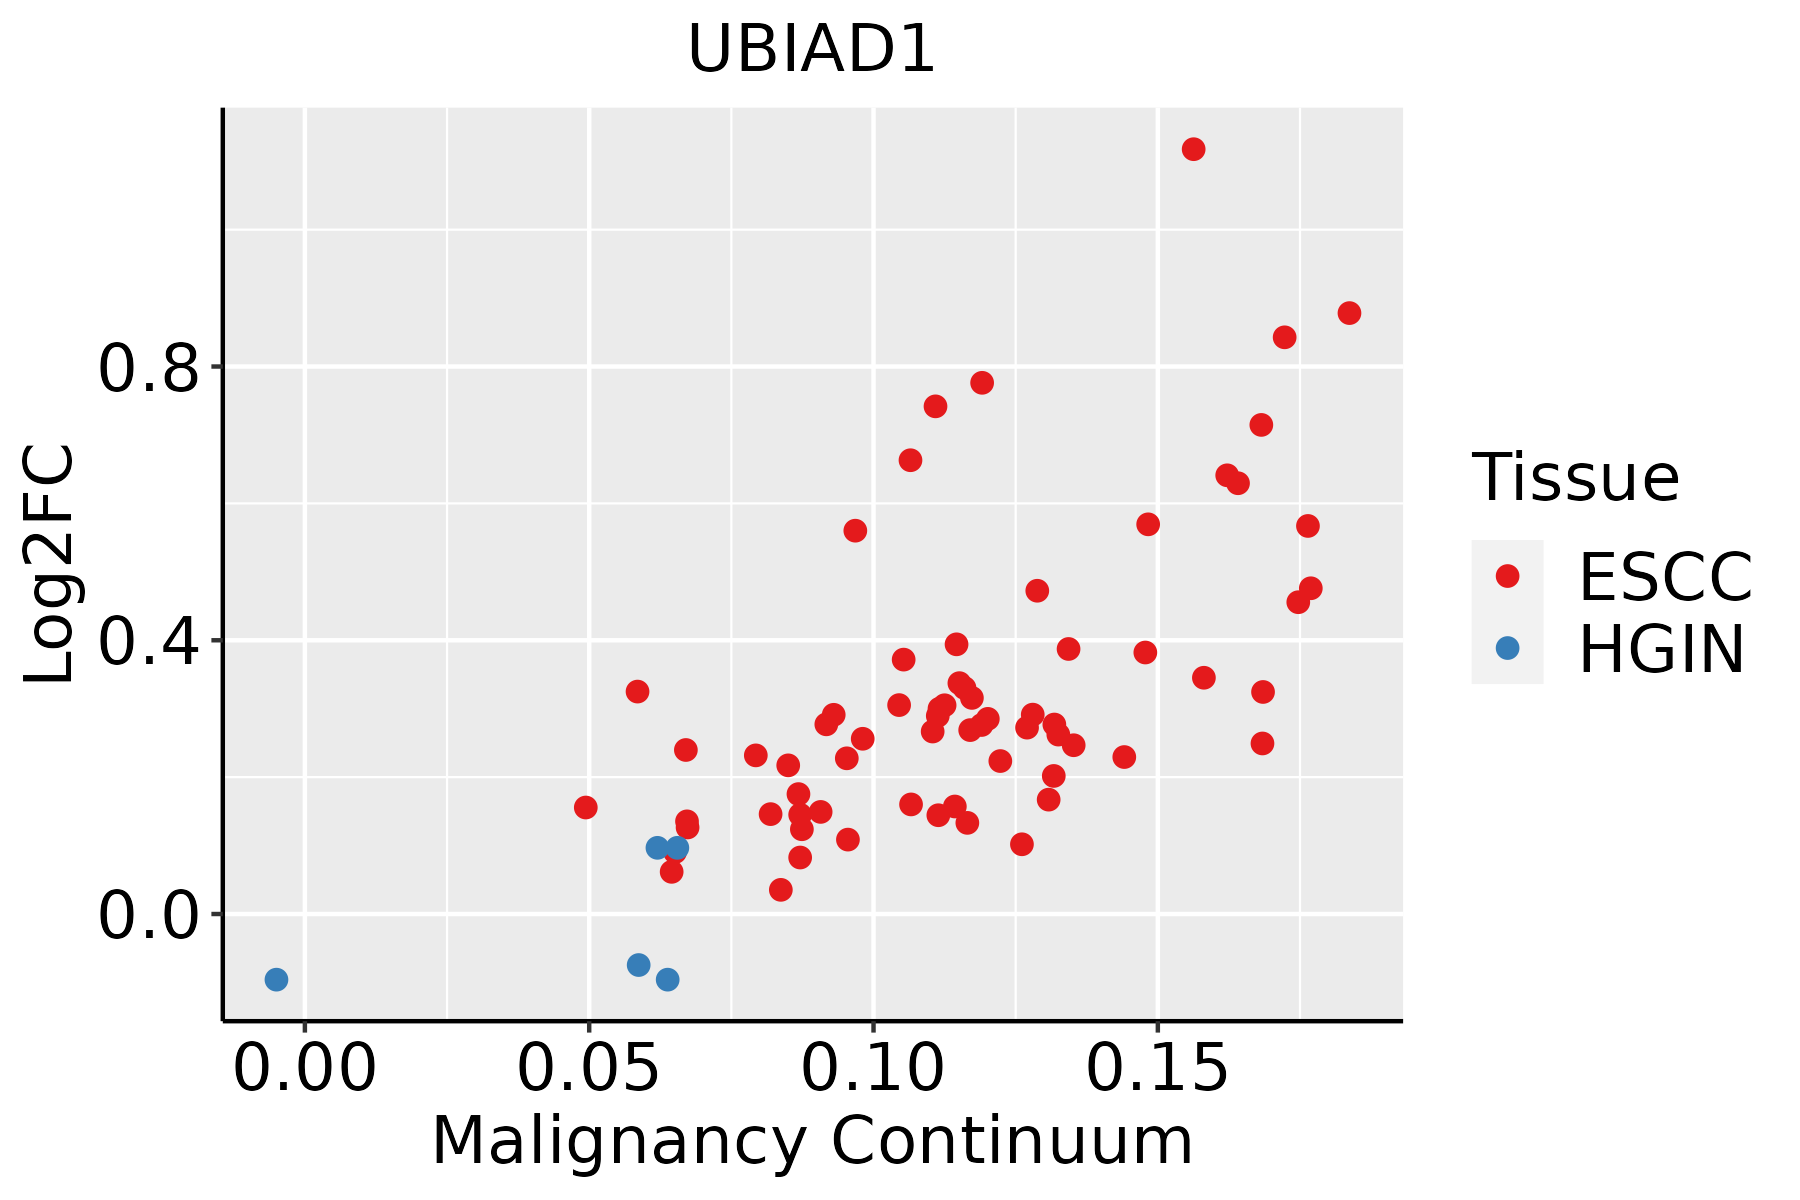 | ESCC: Esophageal squamous cell carcinoma |
| HGIN: High-grade intraepithelial neoplasias | ||
| LGIN: Low-grade intraepithelial neoplasias | ||
| Liver | 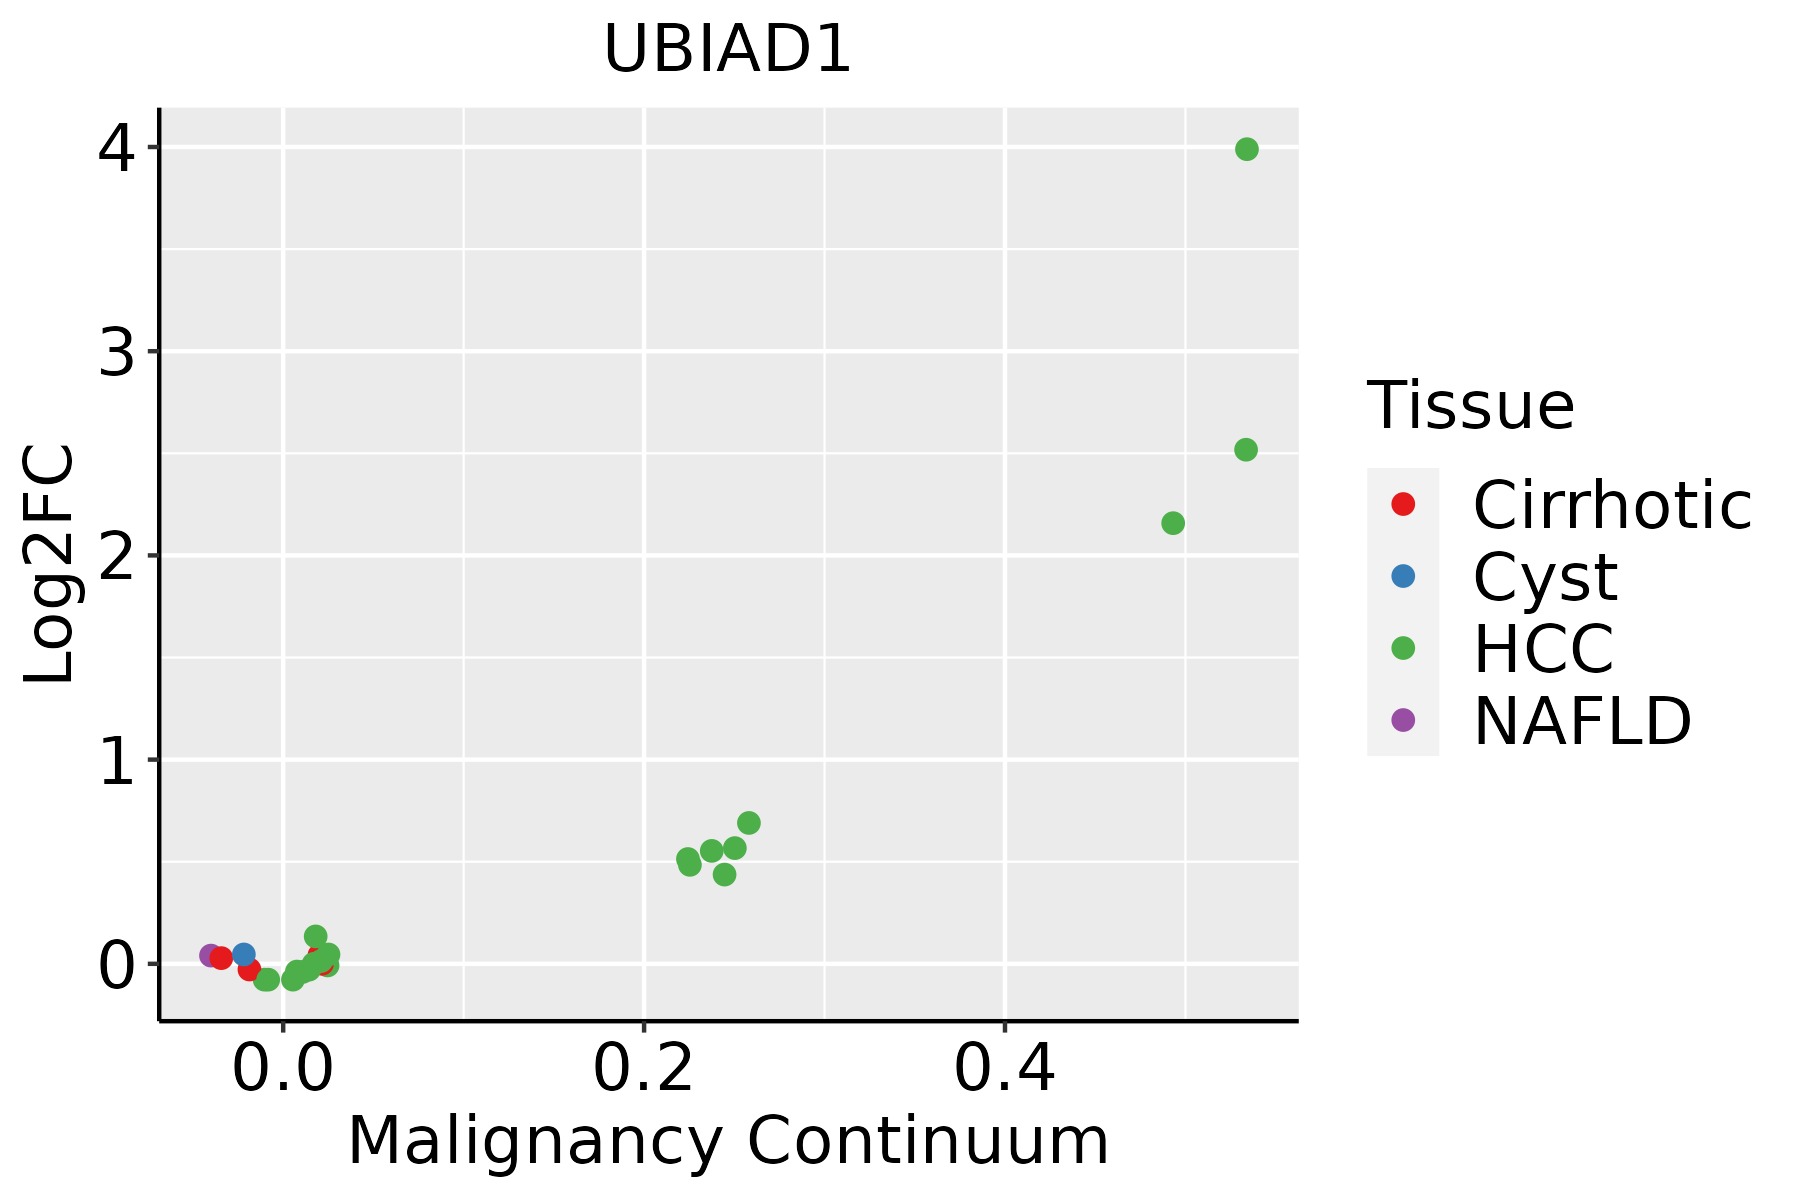 | HCC: Hepatocellular carcinoma |
| NAFLD: Non-alcoholic fatty liver disease | ||
| Oral Cavity | 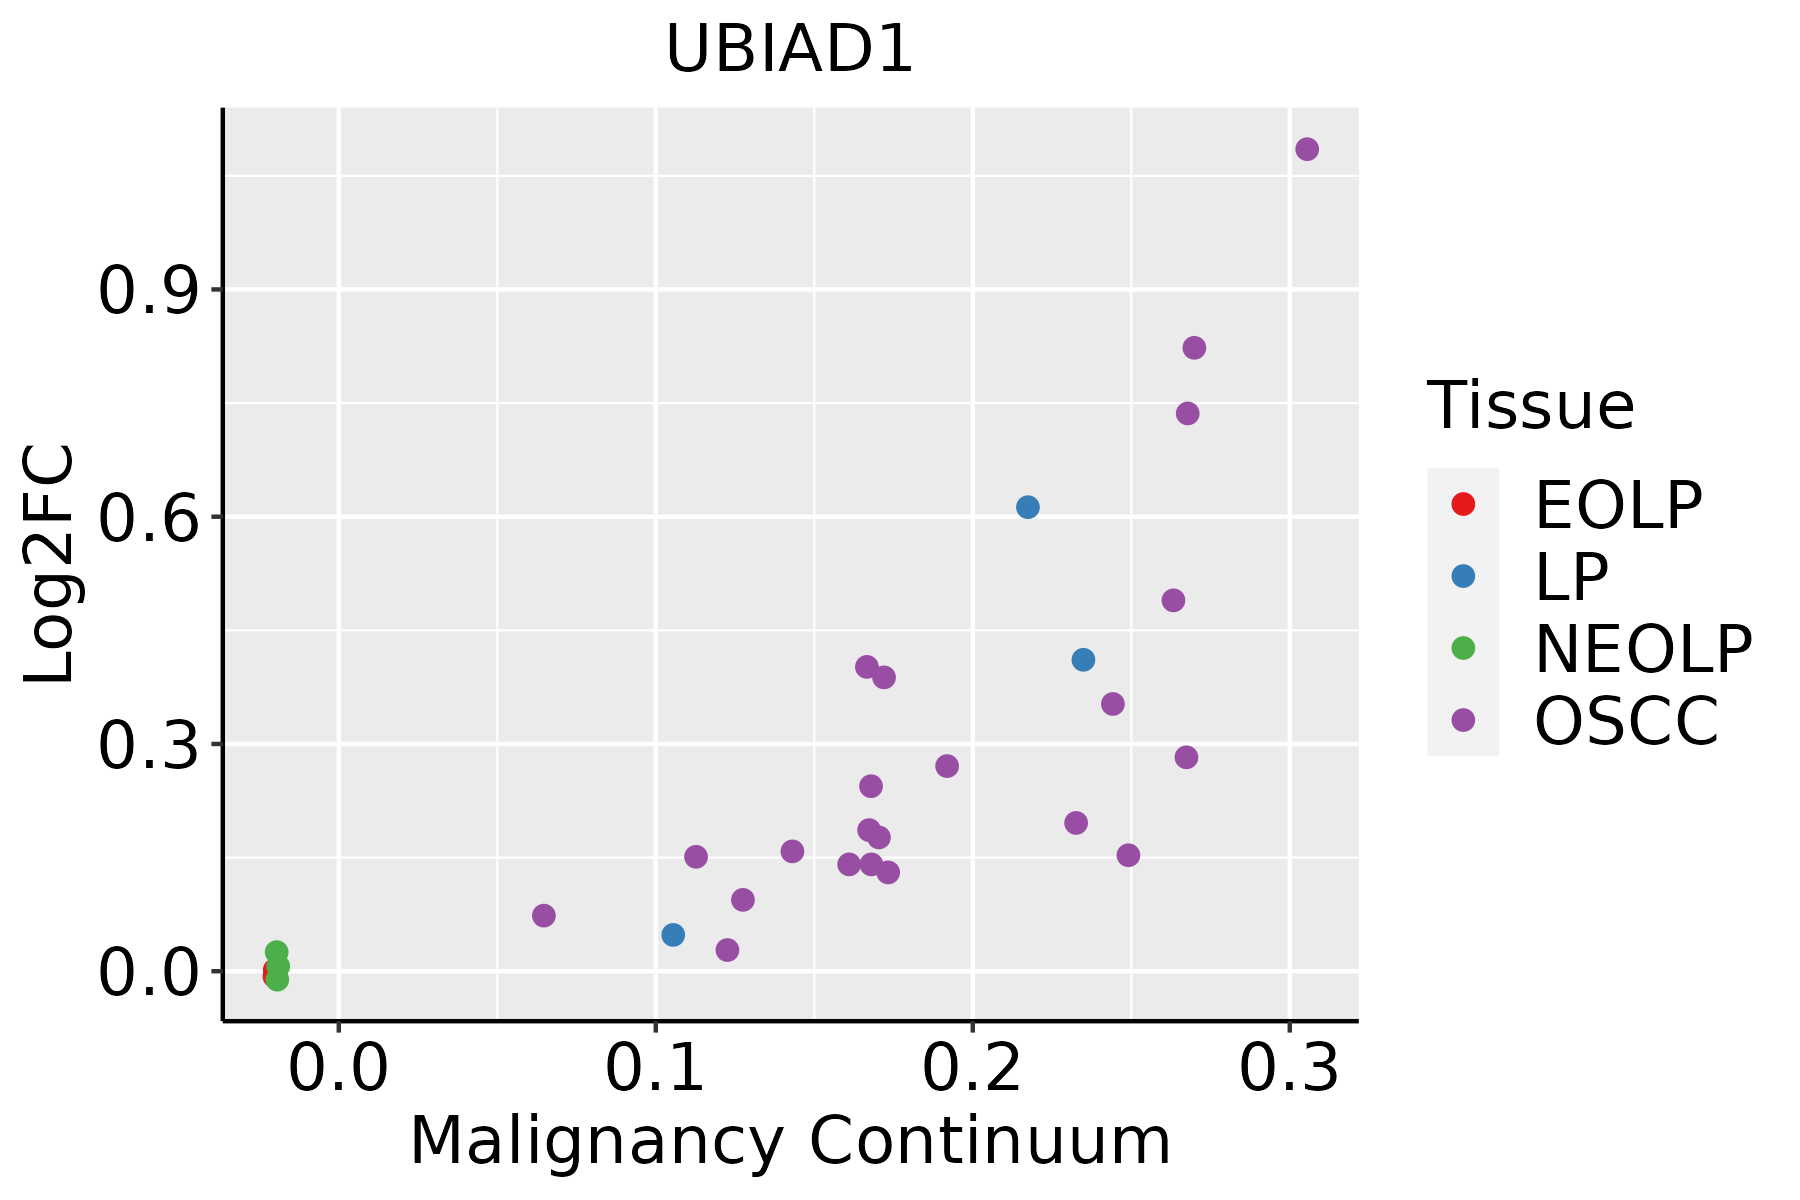 | EOLP: Erosive Oral lichen planus |
| LP: leukoplakia | ||
| NEOLP: Non-erosive oral lichen planus | ||
| OSCC: Oral squamous cell carcinoma |
| ∗log2FC in expression of this searched gene in stem-like cells from each diseased tissue sample relative to stem-like cells in normal samples in each tissue plotted against the malignancy continuum. Samples are colored based on if they are from different disease stage. |
Top |
Malignant transformation related pathway analysis |
| Find out the enriched GO biological processes and KEGG pathways involved in transition from healthy to precancer to cancer |
| Tissue | Disease Stage | Enriched GO biological Processes |
| Colorectum | AD |  |
| Colorectum | SER |  |
| Colorectum | MSS |  |
| Colorectum | MSI-H |  |
| Colorectum | FAP |  |
| ∗Top 15 enriched GO BP terms are showed in the bar plot of each disease state in each tissue. Each row represents a significant GO biological process which is colored according to the -log10(p.adjust). |
| Page: 1 2 3 4 5 6 7 8 9 |
| GO ID | Tissue | Disease Stage | Description | Gene Ratio | Bg Ratio | pvalue | p.adjust | Count |
| GO:190166112 | Esophagus | ESCC | quinone metabolic process | 34/8552 | 40/18723 | 3.00e-07 | 4.27e-06 | 34 |
| GO:00067432 | Esophagus | ESCC | ubiquinone metabolic process | 17/8552 | 19/18723 | 9.02e-05 | 6.50e-04 | 17 |
| GO:000963620 | Esophagus | ESCC | response to toxic substance | 150/8552 | 262/18723 | 1.00e-04 | 7.12e-04 | 150 |
| GO:00067661 | Esophagus | ESCC | vitamin metabolic process | 67/8552 | 106/18723 | 2.03e-04 | 1.28e-03 | 67 |
| GO:00067442 | Esophagus | ESCC | ubiquinone biosynthetic process | 15/8552 | 17/18723 | 3.48e-04 | 2.03e-03 | 15 |
| GO:19016632 | Esophagus | ESCC | quinone biosynthetic process | 15/8552 | 17/18723 | 3.48e-04 | 2.03e-03 | 15 |
| GO:00421805 | Esophagus | ESCC | cellular ketone metabolic process | 120/8552 | 211/18723 | 6.70e-04 | 3.55e-03 | 120 |
| GO:1990748110 | Esophagus | ESCC | cellular detoxification | 70/8552 | 116/18723 | 1.02e-03 | 5.17e-03 | 70 |
| GO:0097237110 | Esophagus | ESCC | cellular response to toxic substance | 72/8552 | 124/18723 | 3.65e-03 | 1.49e-02 | 72 |
| GO:0098869110 | Esophagus | ESCC | cellular oxidant detoxification | 60/8552 | 101/18723 | 3.76e-03 | 1.53e-02 | 60 |
| GO:0009110 | Esophagus | ESCC | vitamin biosynthetic process | 15/8552 | 20/18723 | 7.60e-03 | 2.71e-02 | 15 |
| GO:000963622 | Liver | HCC | response to toxic substance | 153/7958 | 262/18723 | 1.37e-07 | 2.58e-06 | 153 |
| GO:004218021 | Liver | HCC | cellular ketone metabolic process | 123/7958 | 211/18723 | 2.52e-06 | 3.37e-05 | 123 |
| GO:199074812 | Liver | HCC | cellular detoxification | 70/7958 | 116/18723 | 7.87e-05 | 7.02e-04 | 70 |
| GO:009723712 | Liver | HCC | cellular response to toxic substance | 74/7958 | 124/18723 | 8.36e-05 | 7.36e-04 | 74 |
| GO:009875412 | Liver | HCC | detoxification | 87/7958 | 152/18723 | 1.70e-04 | 1.35e-03 | 87 |
| GO:009886912 | Liver | HCC | cellular oxidant detoxification | 59/7958 | 101/18723 | 9.00e-04 | 5.31e-03 | 59 |
| GO:19016611 | Liver | HCC | quinone metabolic process | 26/7958 | 40/18723 | 3.40e-03 | 1.55e-02 | 26 |
| GO:0006766 | Liver | HCC | vitamin metabolic process | 57/7958 | 106/18723 | 1.25e-02 | 4.53e-02 | 57 |
| GO:19016613 | Oral cavity | OSCC | quinone metabolic process | 32/7305 | 40/18723 | 1.40e-07 | 2.34e-06 | 32 |
| Page: 1 2 3 |
| Pathway ID | Tissue | Disease Stage | Description | Gene Ratio | Bg Ratio | pvalue | p.adjust | qvalue | Count |
| Page: 1 |
Top |
Cell-cell communication analysis |
| Identification of potential cell-cell interactions between two cell types and their ligand-receptor pairs for different disease states |
| Ligand | Receptor | LRpair | Pathway | Tissue | Disease Stage |
| Page: 1 |
Top |
Single-cell gene regulatory network inference analysis |
| Find out the significant the regulons (TFs) and the target genes of each regulon across cell types for different disease states |
| TF | Cell Type | Tissue | Disease Stage | Target Gene | RSS | Regulon Activity |
| ∗The dot plots of a searched regulon are shown for all cell subpopulations in each disease state of each tissue based on the regulon specific score inferred using pySCENIC and by calculating the average expression. |
| Page: 1 |
Top |
Somatic mutation of malignant transformation related genes |
| Annotation of somatic variants for genes involved in malignant transformation |
| Hugo Symbol | Variant Class | Variant Classification | dbSNP RS | HGVSc | HGVSp | HGVSp Short | SWISSPROT | BIOTYPE | SIFT | PolyPhen | Tumor Sample Barcode | Tissue | Histology | Sex | Age | Stage | Therapy Types | Drugs | Outcome |
| UBIAD1 | SNV | Missense_Mutation | novel | c.11N>G | p.Ser4Cys | p.S4C | Q9Y5Z9 | protein_coding | deleterious_low_confidence(0.03) | benign(0.058) | TCGA-3C-AALI-01 | Breast | breast invasive carcinoma | Female | <65 | I/II | Unspecific | Poly E | Complete Response |
| UBIAD1 | SNV | Missense_Mutation | novel | c.313N>C | p.Tyr105His | p.Y105H | Q9Y5Z9 | protein_coding | deleterious(0) | probably_damaging(0.984) | TCGA-BH-A0AY-01 | Breast | breast invasive carcinoma | Female | <65 | I/II | Chemotherapy | SD | |
| UBIAD1 | SNV | Missense_Mutation | rs755253867 | c.676G>A | p.Glu226Lys | p.E226K | Q9Y5Z9 | protein_coding | deleterious(0) | possibly_damaging(0.728) | TCGA-D8-A1JN-01 | Breast | breast invasive carcinoma | Female | >=65 | III/IV | Hormone Therapy | anastrozolum | SD |
| UBIAD1 | SNV | Missense_Mutation | novel | c.1003C>G | p.Leu335Val | p.L335V | Q9Y5Z9 | protein_coding | deleterious(0.01) | probably_damaging(0.923) | TCGA-VS-A8QF-01 | Cervix | cervical & endocervical cancer | Female | <65 | I/II | Chemotherapy | cisplatin | CR |
| UBIAD1 | SNV | Missense_Mutation | c.289G>A | p.Ala97Thr | p.A97T | Q9Y5Z9 | protein_coding | deleterious(0) | probably_damaging(0.942) | TCGA-AA-3977-01 | Colorectum | colon adenocarcinoma | Male | >=65 | I/II | Unknown | Unknown | SD | |
| UBIAD1 | SNV | Missense_Mutation | c.289N>A | p.Ala97Thr | p.A97T | Q9Y5Z9 | protein_coding | deleterious(0) | probably_damaging(0.942) | TCGA-AA-A010-01 | Colorectum | colon adenocarcinoma | Female | <65 | I/II | Chemotherapy | folinic | CR | |
| UBIAD1 | SNV | Missense_Mutation | novel | c.403G>A | p.Gly135Arg | p.G135R | Q9Y5Z9 | protein_coding | deleterious(0) | probably_damaging(0.967) | TCGA-AA-A02R-01 | Colorectum | colon adenocarcinoma | Female | >=65 | I/II | Unknown | Unknown | PD |
| UBIAD1 | SNV | Missense_Mutation | c.656T>C | p.Ile219Thr | p.I219T | Q9Y5Z9 | protein_coding | deleterious(0) | benign(0.411) | TCGA-AD-6964-01 | Colorectum | colon adenocarcinoma | Male | <65 | III/IV | Chemotherapy | folfox | PD | |
| UBIAD1 | SNV | Missense_Mutation | c.623N>A | p.Gly208Glu | p.G208E | Q9Y5Z9 | protein_coding | deleterious(0) | probably_damaging(0.987) | TCGA-F4-6461-01 | Colorectum | colon adenocarcinoma | Female | <65 | III/IV | Unknown | Unknown | PD | |
| UBIAD1 | SNV | Missense_Mutation | c.770C>T | p.Ser257Phe | p.S257F | Q9Y5Z9 | protein_coding | deleterious(0) | probably_damaging(0.999) | TCGA-WS-AB45-01 | Colorectum | colon adenocarcinoma | Female | <65 | I/II | Unknown | Unknown | SD |
| Page: 1 2 3 4 |
Top |
Related drugs of malignant transformation related genes |
| Identification of chemicals and drugs interact with genes involved in malignant transfromation |
| (DGIdb 4.0) |
| Entrez ID | Symbol | Category | Interaction Types | Drug Claim Name | Drug Name | PMIDs |
| Page: 1 |

Copyright 2023-Present -The University of Texas Health Science Center at Houston |