
|
|||||
|
 | |
| |
| |
| |
| |
| |
|
Gene: UBE4A |
Gene summary for UBE4A |
| Gene information | Species | Human | Gene symbol | UBE4A | Gene ID | 9354 |
| Gene name | ubiquitination factor E4A | |
| Gene Alias | E4 | |
| Cytomap | 11q23.3 | |
| Gene Type | protein-coding | GO ID | GO:0000209 | UniProtAcc | Q14139 |
Top |
Malignant transformation analysis |
| Identification of the aberrant gene expression in precancerous and cancerous lesions by comparing the gene expression of stem-like cells in diseased tissues with normal stem cells |
| Entrez ID | Symbol | Replicates | Species | Organ | Tissue | Adj P-value | Log2FC | Malignancy |
| 9354 | UBE4A | LZE4T | Human | Esophagus | ESCC | 3.38e-06 | 1.68e-01 | 0.0811 |
| 9354 | UBE4A | LZE7T | Human | Esophagus | ESCC | 2.01e-05 | 3.47e-01 | 0.0667 |
| 9354 | UBE4A | LZE20T | Human | Esophagus | ESCC | 5.19e-08 | 2.08e-01 | 0.0662 |
| 9354 | UBE4A | LZE24T | Human | Esophagus | ESCC | 6.96e-17 | 5.76e-01 | 0.0596 |
| 9354 | UBE4A | P1T-E | Human | Esophagus | ESCC | 2.94e-05 | 1.94e-01 | 0.0875 |
| 9354 | UBE4A | P2T-E | Human | Esophagus | ESCC | 2.70e-14 | 1.78e-01 | 0.1177 |
| 9354 | UBE4A | P4T-E | Human | Esophagus | ESCC | 3.69e-21 | 5.36e-01 | 0.1323 |
| 9354 | UBE4A | P5T-E | Human | Esophagus | ESCC | 2.48e-14 | 2.79e-01 | 0.1327 |
| 9354 | UBE4A | P8T-E | Human | Esophagus | ESCC | 9.55e-20 | 1.63e-01 | 0.0889 |
| 9354 | UBE4A | P9T-E | Human | Esophagus | ESCC | 2.58e-12 | 1.51e-01 | 0.1131 |
| 9354 | UBE4A | P10T-E | Human | Esophagus | ESCC | 2.39e-12 | 2.48e-01 | 0.116 |
| 9354 | UBE4A | P11T-E | Human | Esophagus | ESCC | 1.82e-05 | 3.70e-01 | 0.1426 |
| 9354 | UBE4A | P12T-E | Human | Esophagus | ESCC | 8.85e-24 | 3.80e-01 | 0.1122 |
| 9354 | UBE4A | P15T-E | Human | Esophagus | ESCC | 1.25e-13 | 2.68e-01 | 0.1149 |
| 9354 | UBE4A | P16T-E | Human | Esophagus | ESCC | 2.66e-20 | 3.67e-01 | 0.1153 |
| 9354 | UBE4A | P17T-E | Human | Esophagus | ESCC | 2.22e-03 | 3.32e-01 | 0.1278 |
| 9354 | UBE4A | P20T-E | Human | Esophagus | ESCC | 1.05e-17 | 2.13e-01 | 0.1124 |
| 9354 | UBE4A | P21T-E | Human | Esophagus | ESCC | 3.17e-25 | 5.93e-01 | 0.1617 |
| 9354 | UBE4A | P22T-E | Human | Esophagus | ESCC | 3.69e-20 | 1.73e-01 | 0.1236 |
| 9354 | UBE4A | P23T-E | Human | Esophagus | ESCC | 1.79e-16 | 3.72e-01 | 0.108 |
| Page: 1 2 3 4 5 |
| Tissue | Expression Dynamics | Abbreviation |
| Esophagus | 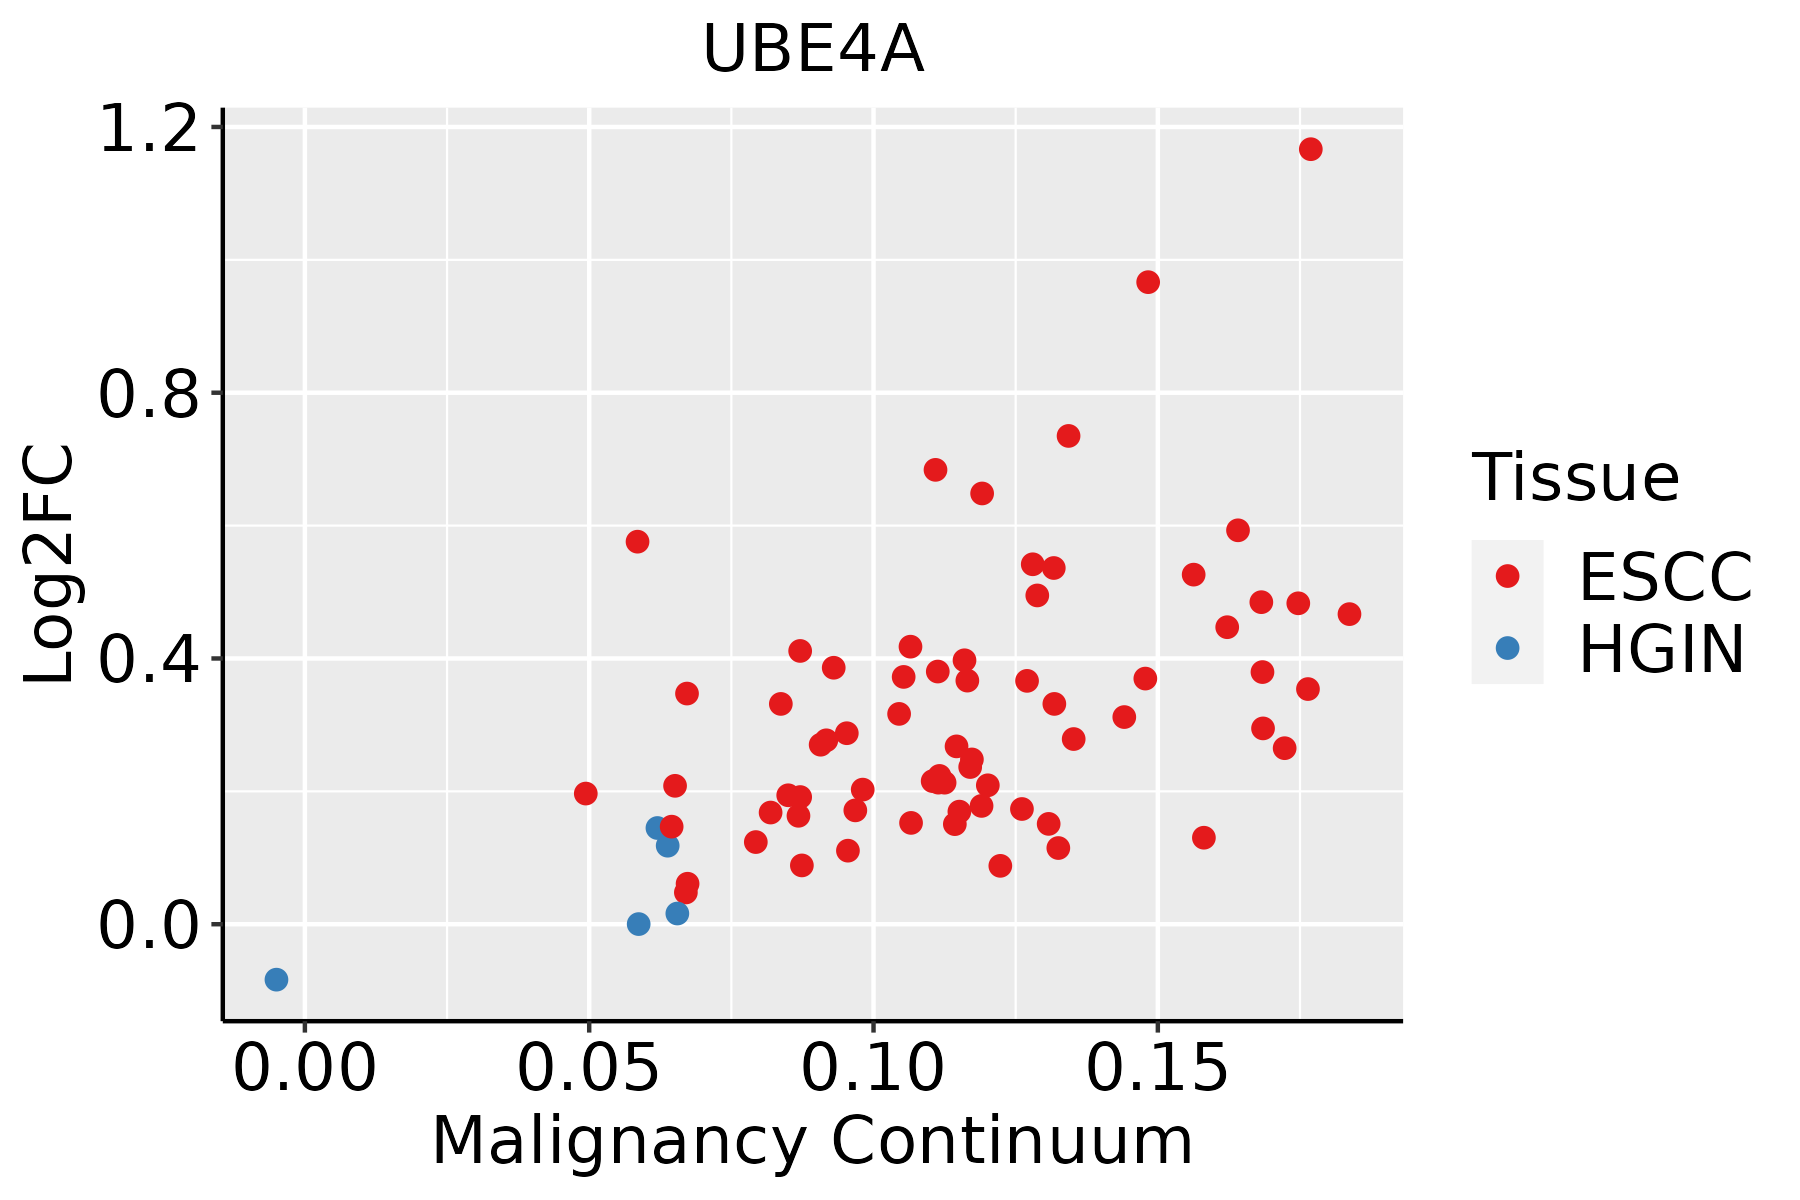 | ESCC: Esophageal squamous cell carcinoma |
| HGIN: High-grade intraepithelial neoplasias | ||
| LGIN: Low-grade intraepithelial neoplasias | ||
| Liver | 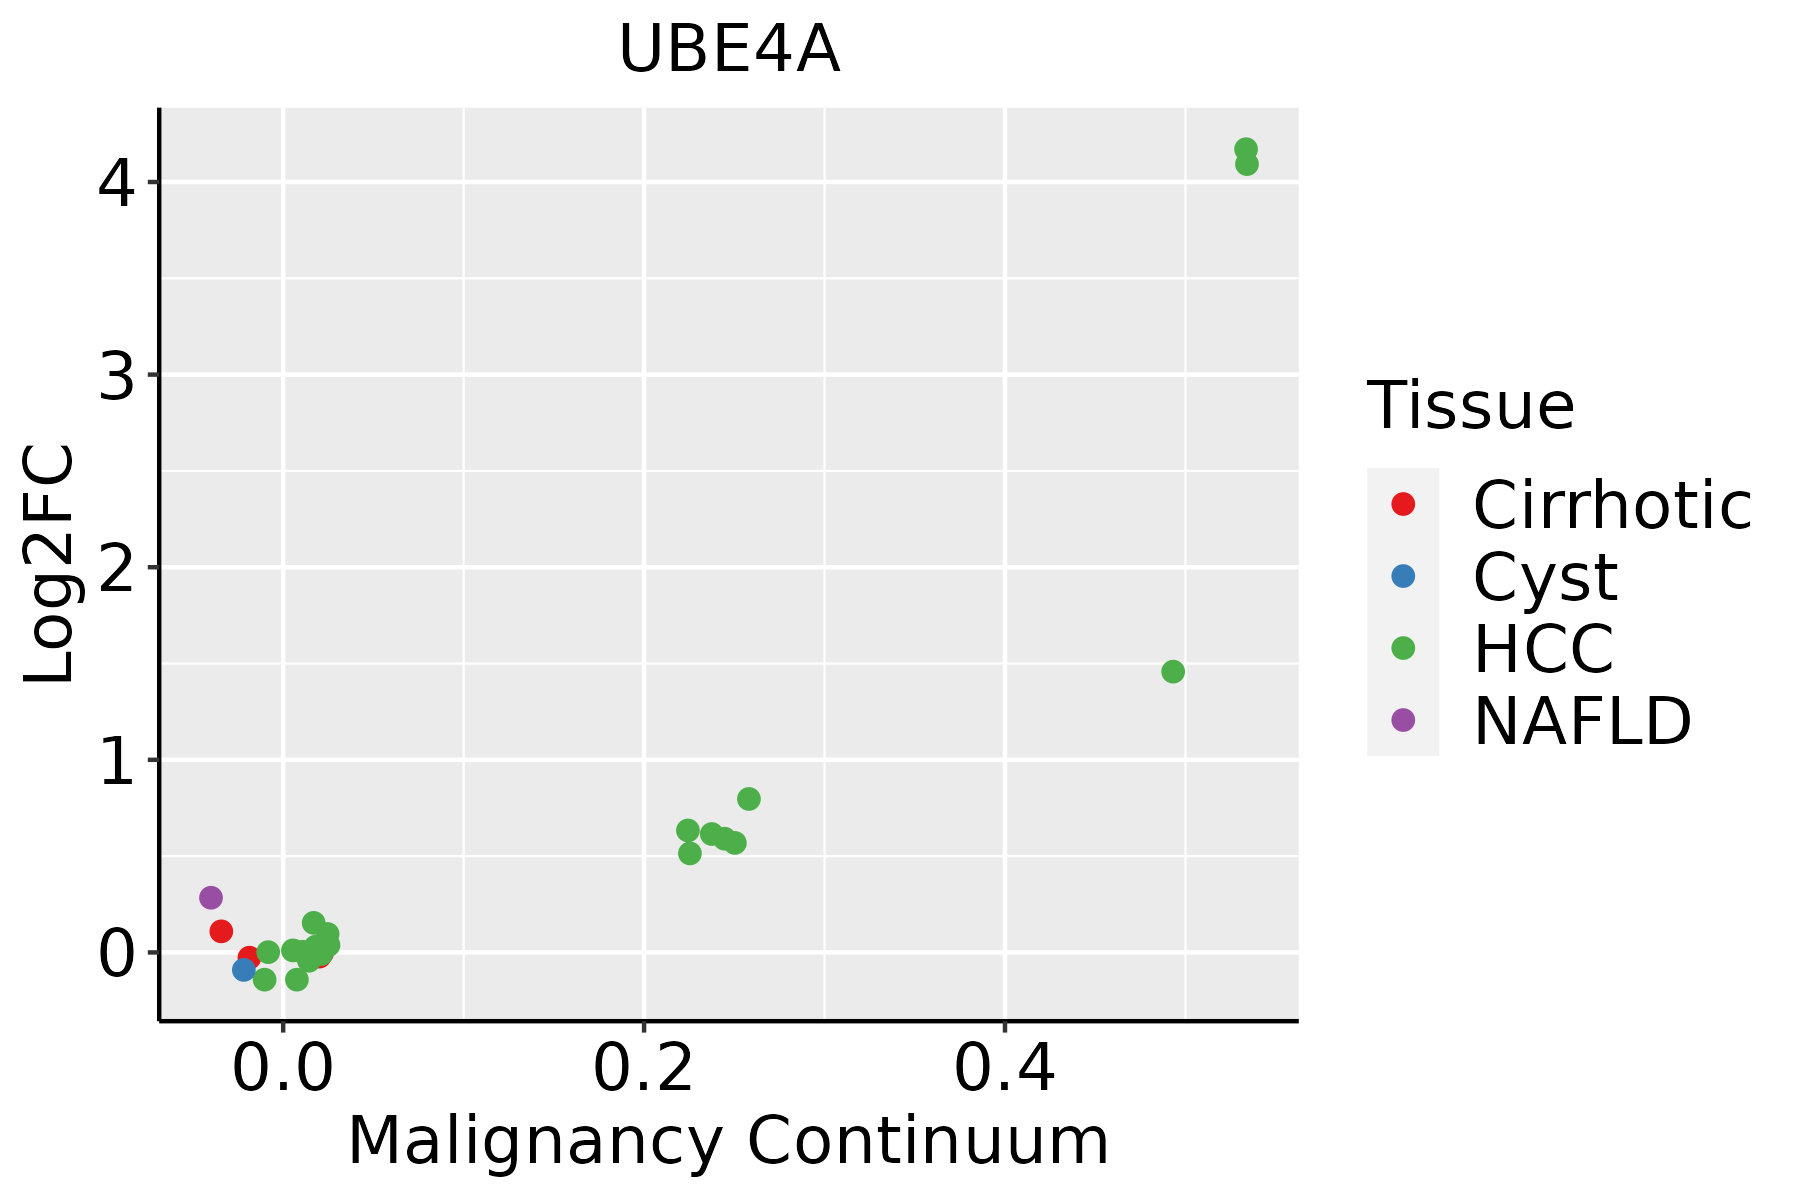 | HCC: Hepatocellular carcinoma |
| NAFLD: Non-alcoholic fatty liver disease | ||
| Skin | 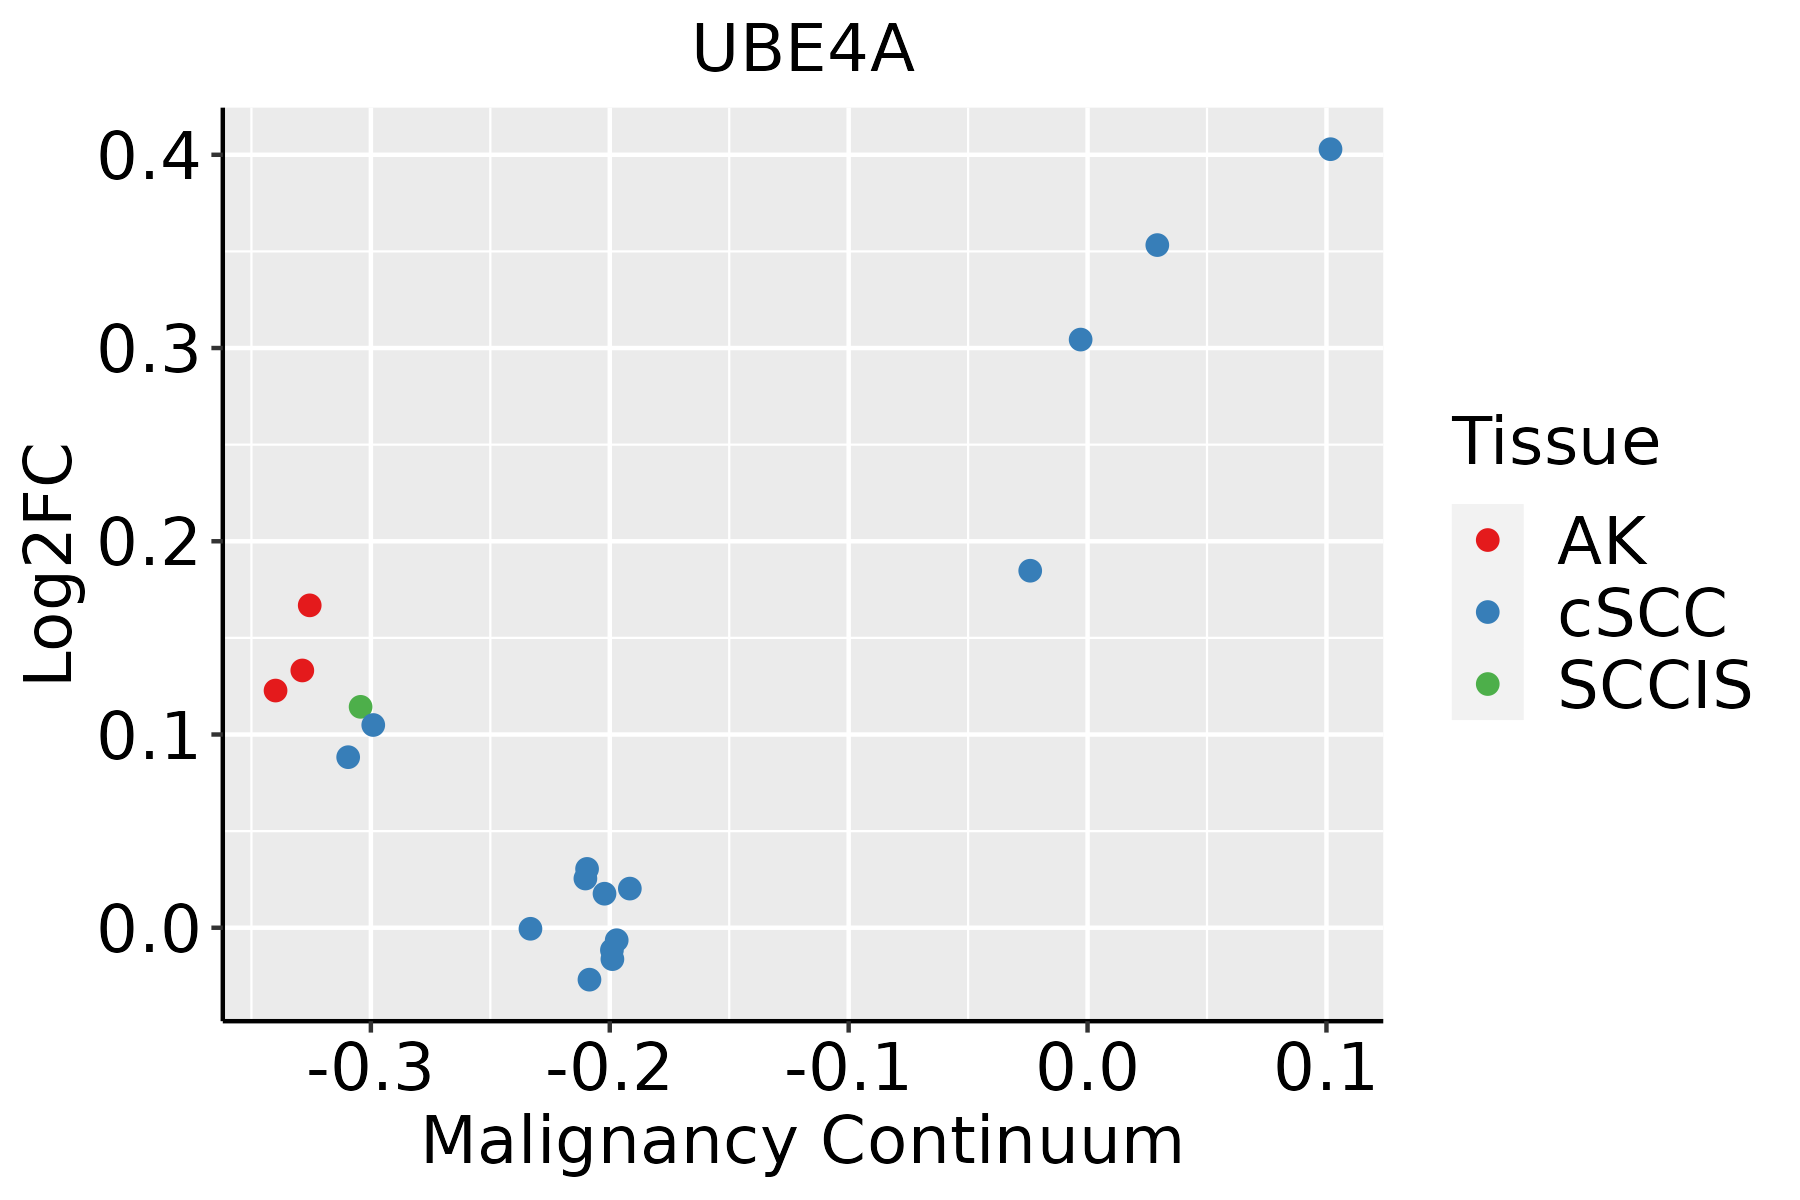 | AK: Actinic keratosis |
| cSCC: Cutaneous squamous cell carcinoma | ||
| SCCIS:squamous cell carcinoma in situ | ||
| Thyroid |  | ATC: Anaplastic thyroid cancer |
| HT: Hashimoto's thyroiditis | ||
| PTC: Papillary thyroid cancer |
| ∗log2FC in expression of this searched gene in stem-like cells from each diseased tissue sample relative to stem-like cells in normal samples in each tissue plotted against the malignancy continuum. Samples are colored based on if they are from different disease stage. |
Top |
Malignant transformation related pathway analysis |
| Find out the enriched GO biological processes and KEGG pathways involved in transition from healthy to precancer to cancer |
| Tissue | Disease Stage | Enriched GO biological Processes |
| Colorectum | AD |  |
| Colorectum | SER |  |
| Colorectum | MSS |  |
| Colorectum | MSI-H |  |
| Colorectum | FAP |  |
| ∗Top 15 enriched GO BP terms are showed in the bar plot of each disease state in each tissue. Each row represents a significant GO biological process which is colored according to the -log10(p.adjust). |
| Page: 1 2 3 4 5 6 7 8 9 |
| GO ID | Tissue | Disease Stage | Description | Gene Ratio | Bg Ratio | pvalue | p.adjust | Count |
| GO:0010498111 | Esophagus | ESCC | proteasomal protein catabolic process | 369/8552 | 490/18723 | 1.13e-41 | 1.80e-38 | 369 |
| GO:0043161111 | Esophagus | ESCC | proteasome-mediated ubiquitin-dependent protein catabolic process | 312/8552 | 412/18723 | 3.53e-36 | 4.48e-33 | 312 |
| GO:0034976111 | Esophagus | ESCC | response to endoplasmic reticulum stress | 192/8552 | 256/18723 | 7.15e-22 | 1.30e-19 | 192 |
| GO:000020917 | Esophagus | ESCC | protein polyubiquitination | 170/8552 | 236/18723 | 1.40e-16 | 1.09e-14 | 170 |
| GO:003650315 | Esophagus | ESCC | ERAD pathway | 82/8552 | 107/18723 | 5.80e-11 | 1.84e-09 | 82 |
| GO:003043314 | Esophagus | ESCC | ubiquitin-dependent ERAD pathway | 66/8552 | 85/18723 | 1.64e-09 | 3.78e-08 | 66 |
| GO:001049822 | Liver | HCC | proteasomal protein catabolic process | 351/7958 | 490/18723 | 6.92e-40 | 1.46e-36 | 351 |
| GO:004316122 | Liver | HCC | proteasome-mediated ubiquitin-dependent protein catabolic process | 299/7958 | 412/18723 | 7.82e-36 | 8.27e-33 | 299 |
| GO:003497612 | Liver | HCC | response to endoplasmic reticulum stress | 189/7958 | 256/18723 | 1.43e-24 | 4.06e-22 | 189 |
| GO:003650311 | Liver | HCC | ERAD pathway | 88/7958 | 107/18723 | 2.87e-17 | 2.85e-15 | 88 |
| GO:00304331 | Liver | HCC | ubiquitin-dependent ERAD pathway | 72/7958 | 85/18723 | 9.78e-16 | 7.47e-14 | 72 |
| GO:000020921 | Liver | HCC | protein polyubiquitination | 151/7958 | 236/18723 | 1.90e-11 | 7.59e-10 | 151 |
| GO:001049828 | Skin | cSCC | proteasomal protein catabolic process | 243/4864 | 490/18723 | 7.85e-30 | 4.10e-27 | 243 |
| GO:004316128 | Skin | cSCC | proteasome-mediated ubiquitin-dependent protein catabolic process | 205/4864 | 412/18723 | 1.46e-25 | 4.16e-23 | 205 |
| GO:0034976112 | Skin | cSCC | response to endoplasmic reticulum stress | 128/4864 | 256/18723 | 1.16e-16 | 1.17e-14 | 128 |
| GO:000020924 | Skin | cSCC | protein polyubiquitination | 103/4864 | 236/18723 | 2.57e-09 | 9.09e-08 | 103 |
| GO:00304336 | Skin | cSCC | ubiquitin-dependent ERAD pathway | 43/4864 | 85/18723 | 1.02e-06 | 1.82e-05 | 43 |
| GO:00365037 | Skin | cSCC | ERAD pathway | 51/4864 | 107/18723 | 1.11e-06 | 1.95e-05 | 51 |
| GO:0010498113 | Thyroid | PTC | proteasomal protein catabolic process | 297/5968 | 490/18723 | 4.58e-40 | 9.63e-37 | 297 |
| GO:0043161113 | Thyroid | PTC | proteasome-mediated ubiquitin-dependent protein catabolic process | 254/5968 | 412/18723 | 3.91e-36 | 4.54e-33 | 254 |
| Page: 1 2 |
| Pathway ID | Tissue | Disease Stage | Description | Gene Ratio | Bg Ratio | pvalue | p.adjust | qvalue | Count |
| hsa0412027 | Esophagus | ESCC | Ubiquitin mediated proteolysis | 122/4205 | 142/8465 | 6.53e-20 | 7.29e-18 | 3.74e-18 | 122 |
| hsa0412036 | Esophagus | ESCC | Ubiquitin mediated proteolysis | 122/4205 | 142/8465 | 6.53e-20 | 7.29e-18 | 3.74e-18 | 122 |
| hsa0412041 | Liver | HCC | Ubiquitin mediated proteolysis | 110/4020 | 142/8465 | 1.67e-13 | 3.74e-12 | 2.08e-12 | 110 |
| hsa0412051 | Liver | HCC | Ubiquitin mediated proteolysis | 110/4020 | 142/8465 | 1.67e-13 | 3.74e-12 | 2.08e-12 | 110 |
| Page: 1 |
Top |
Cell-cell communication analysis |
| Identification of potential cell-cell interactions between two cell types and their ligand-receptor pairs for different disease states |
| Ligand | Receptor | LRpair | Pathway | Tissue | Disease Stage |
| Page: 1 |
Top |
Single-cell gene regulatory network inference analysis |
| Find out the significant the regulons (TFs) and the target genes of each regulon across cell types for different disease states |
| TF | Cell Type | Tissue | Disease Stage | Target Gene | RSS | Regulon Activity |
| ∗The dot plots of a searched regulon are shown for all cell subpopulations in each disease state of each tissue based on the regulon specific score inferred using pySCENIC and by calculating the average expression. |
| Page: 1 |
Top |
Somatic mutation of malignant transformation related genes |
| Annotation of somatic variants for genes involved in malignant transformation |
| Hugo Symbol | Variant Class | Variant Classification | dbSNP RS | HGVSc | HGVSp | HGVSp Short | SWISSPROT | BIOTYPE | SIFT | PolyPhen | Tumor Sample Barcode | Tissue | Histology | Sex | Age | Stage | Therapy Types | Drugs | Outcome |
| UBE4A | SNV | Missense_Mutation | c.3173N>A | p.Ile1058Asn | p.I1058N | Q14139 | protein_coding | deleterious(0) | probably_damaging(0.999) | TCGA-BH-A0DK-01 | Breast | breast invasive carcinoma | Female | <65 | I/II | Hormone Therapy | tamoxiphen | SD | |
| UBE4A | SNV | Missense_Mutation | novel | c.1223N>G | p.Ser408Cys | p.S408C | Q14139 | protein_coding | tolerated(0.05) | possibly_damaging(0.487) | TCGA-BH-A2L8-01 | Breast | breast invasive carcinoma | Female | <65 | I/II | Chemotherapy | cytoxan | CR |
| UBE4A | SNV | Missense_Mutation | c.2552N>C | p.Arg851Pro | p.R851P | Q14139 | protein_coding | deleterious(0) | probably_damaging(0.986) | TCGA-E2-A1LA-01 | Breast | breast invasive carcinoma | Female | <65 | I/II | Hormone Therapy | arimidex | SD | |
| UBE4A | SNV | Missense_Mutation | novel | c.214T>A | p.Phe72Ile | p.F72I | Q14139 | protein_coding | tolerated(0.56) | benign(0.172) | TCGA-E2-A56Z-01 | Breast | breast invasive carcinoma | Female | >=65 | I/II | Hormone Therapy | arimidex | SD |
| UBE4A | SNV | Missense_Mutation | c.2273N>G | p.Ile758Ser | p.I758S | Q14139 | protein_coding | deleterious(0) | benign(0.308) | TCGA-E9-A226-01 | Breast | breast invasive carcinoma | Female | <65 | III/IV | Hormone Therapy | tamoxiphen | PD | |
| UBE4A | insertion | Frame_Shift_Ins | novel | c.1396_1397insT | p.Thr466IlefsTer3 | p.T466Ifs*3 | Q14139 | protein_coding | TCGA-A8-A09T-01 | Breast | breast invasive carcinoma | Female | >=65 | I/II | Hormone Therapy | anastrozole | SD | ||
| UBE4A | insertion | Frame_Shift_Ins | novel | c.1398_1399insCCTAA | p.Phe467ProfsTer13 | p.F467Pfs*13 | Q14139 | protein_coding | TCGA-A8-A09T-01 | Breast | breast invasive carcinoma | Female | >=65 | I/II | Hormone Therapy | anastrozole | SD | ||
| UBE4A | insertion | Frame_Shift_Ins | novel | c.1435_1436insGCCTGCC | p.Asp479GlyfsTer4 | p.D479Gfs*4 | Q14139 | protein_coding | TCGA-AN-A04C-01 | Breast | breast invasive carcinoma | Female | <65 | I/II | Unknown | Unknown | SD | ||
| UBE4A | insertion | Nonsense_Mutation | novel | c.1436_1437insCCTGTTTTTGTAAATAAAGGTTTAT | p.Glu480LeufsTer4 | p.E480Lfs*4 | Q14139 | protein_coding | TCGA-AN-A04C-01 | Breast | breast invasive carcinoma | Female | <65 | I/II | Unknown | Unknown | SD | ||
| UBE4A | SNV | Missense_Mutation | novel | c.1642N>T | p.Val548Phe | p.V548F | Q14139 | protein_coding | deleterious(0.05) | benign(0.264) | TCGA-2W-A8YY-01 | Cervix | cervical & endocervical cancer | Female | <65 | I/II | Chemotherapy | cisplatin | CR |
| Page: 1 2 3 4 5 6 7 8 9 10 |
Top |
Related drugs of malignant transformation related genes |
| Identification of chemicals and drugs interact with genes involved in malignant transfromation |
| (DGIdb 4.0) |
| Entrez ID | Symbol | Category | Interaction Types | Drug Claim Name | Drug Name | PMIDs |
| Page: 1 |

Copyright 2023-Present -The University of Texas Health Science Center at Houston |