| Tissue | Expression Dynamics | Abbreviation |
| Cervix | 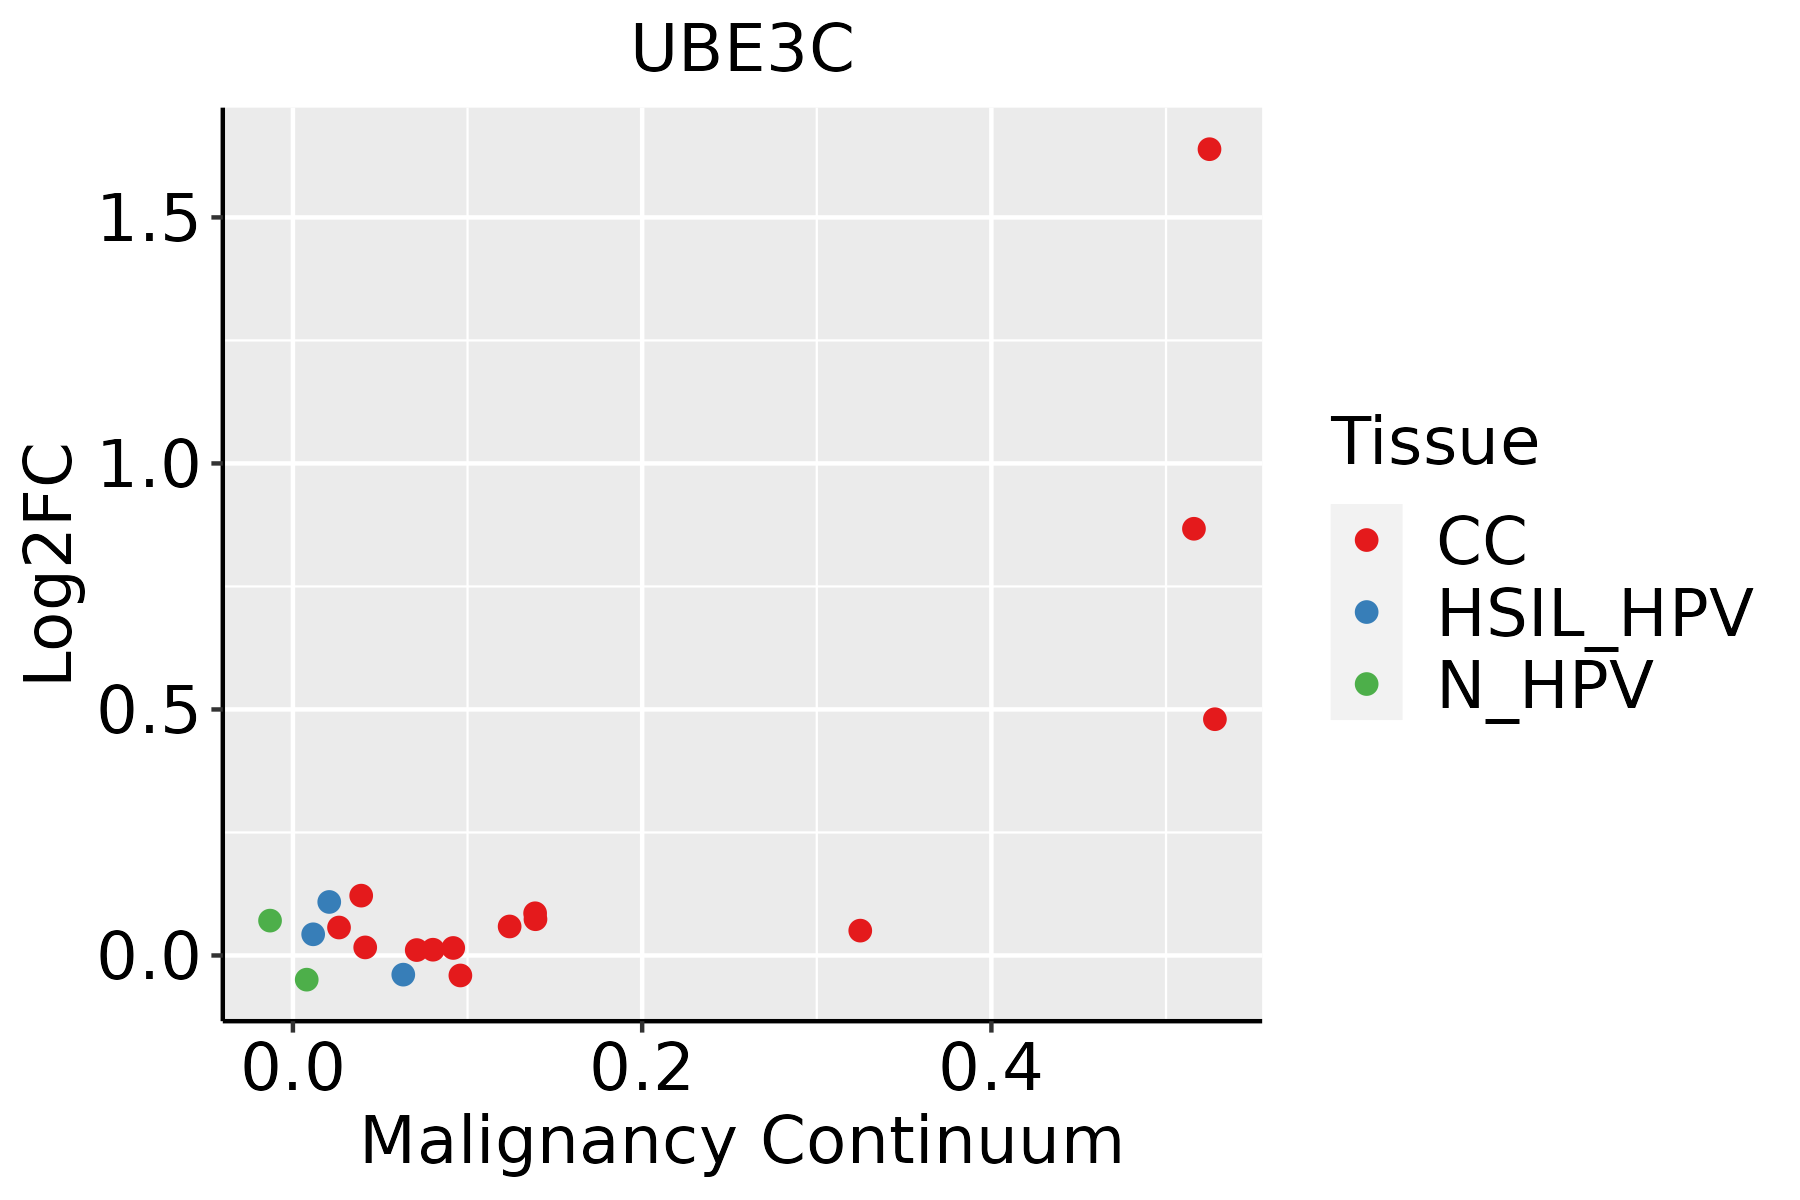 | CC: Cervix cancer |
| HSIL_HPV: HPV-infected high-grade squamous intraepithelial lesions |
| N_HPV: HPV-infected normal cervix |
| Colorectum (GSE201348) |  | FAP: Familial adenomatous polyposis |
| CRC: Colorectal cancer |
| Colorectum (HTA11) |  | AD: Adenomas |
| SER: Sessile serrated lesions |
| MSI-H: Microsatellite-high colorectal cancer |
| MSS: Microsatellite stable colorectal cancer |
| Esophagus | 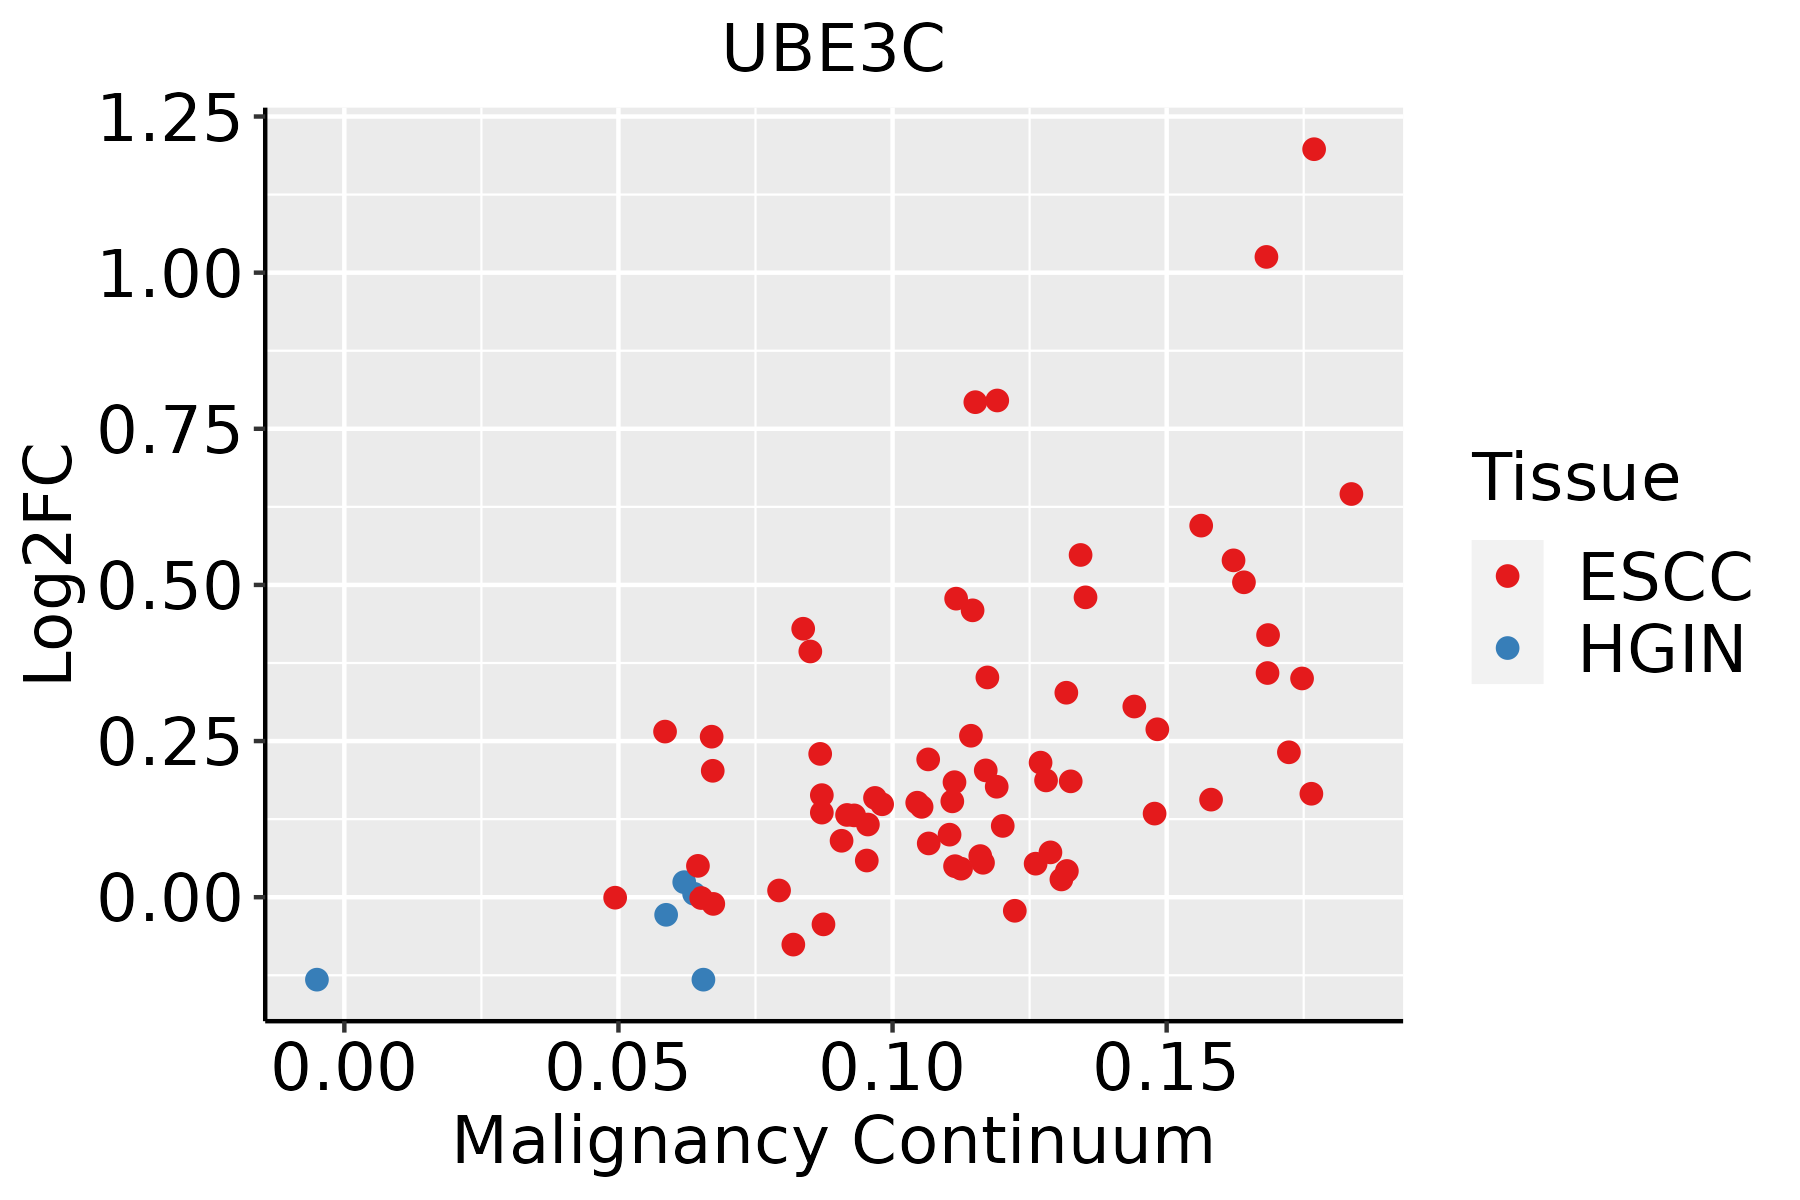 | ESCC: Esophageal squamous cell carcinoma |
| HGIN: High-grade intraepithelial neoplasias |
| LGIN: Low-grade intraepithelial neoplasias |
| Liver | 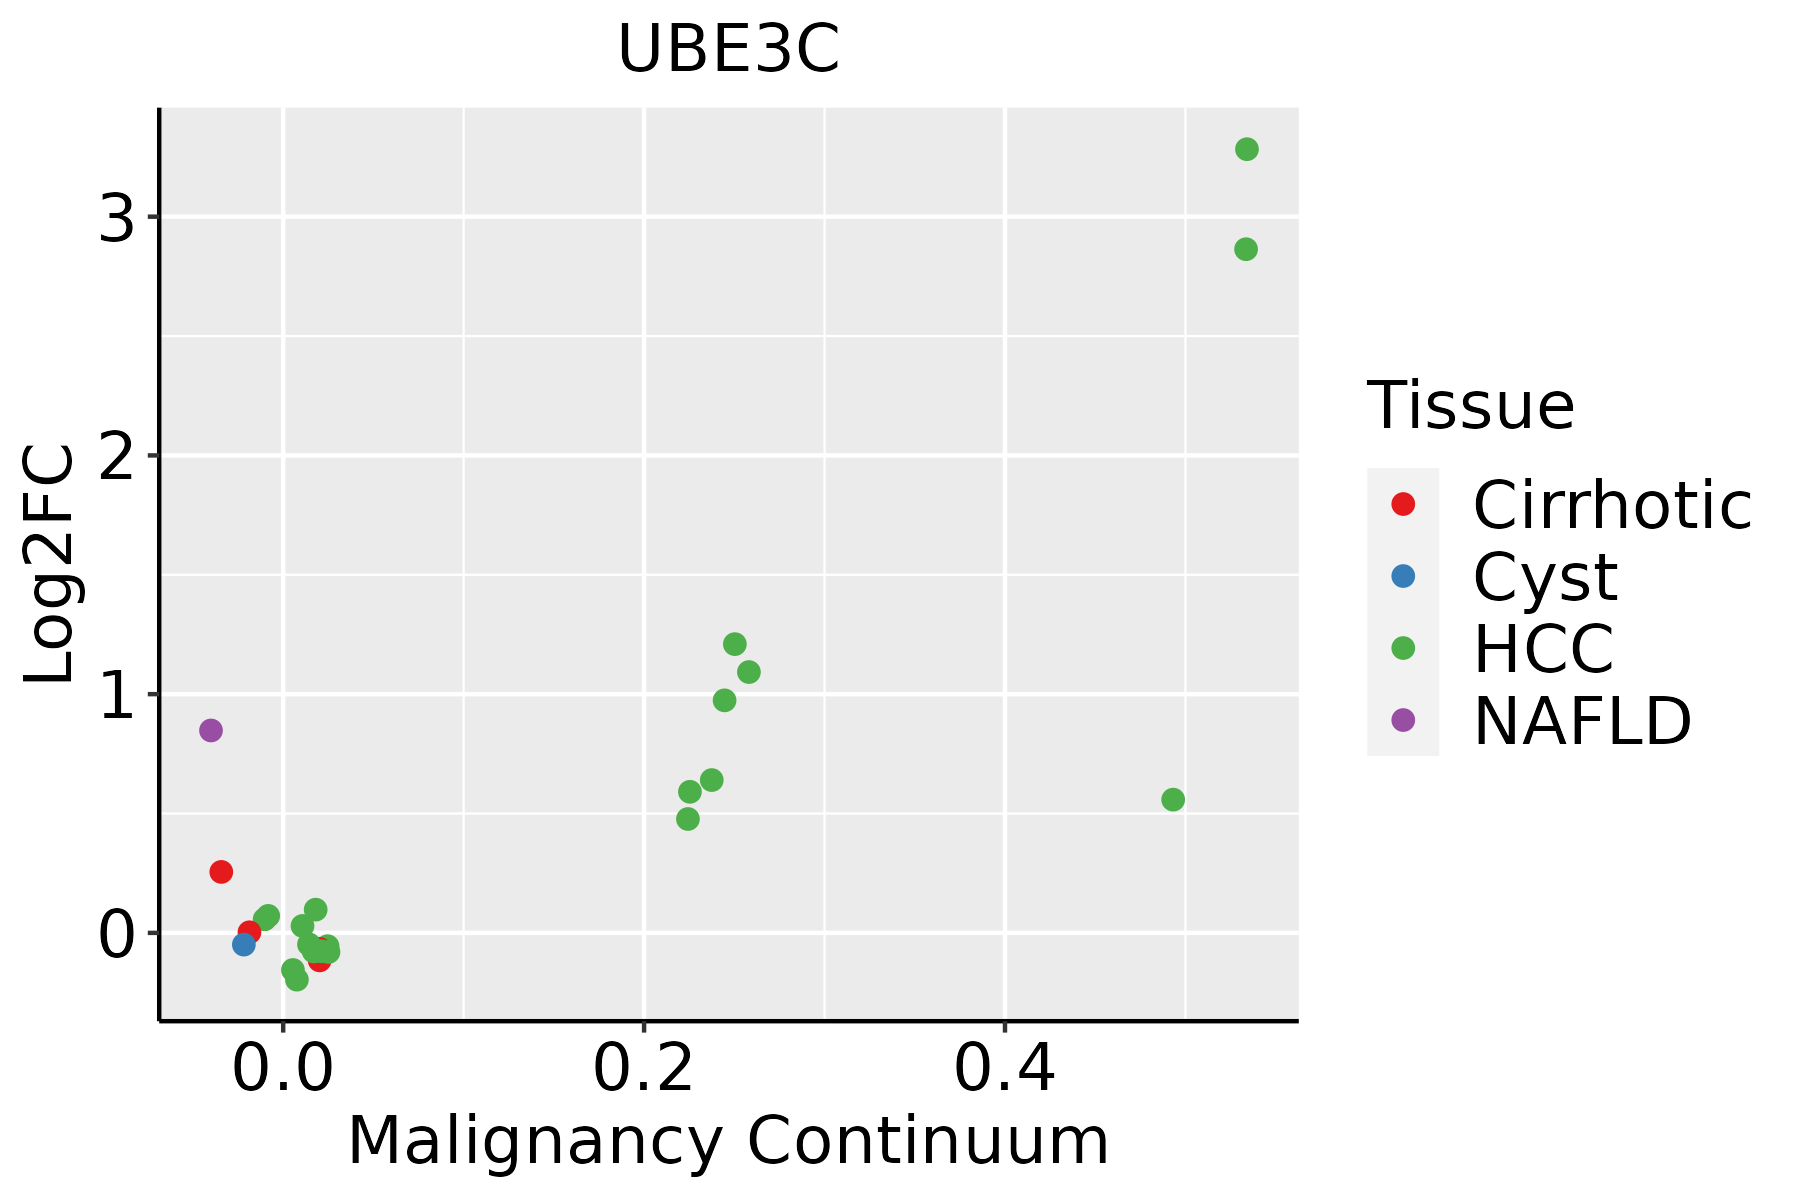 | HCC: Hepatocellular carcinoma |
| NAFLD: Non-alcoholic fatty liver disease |
| Lung | 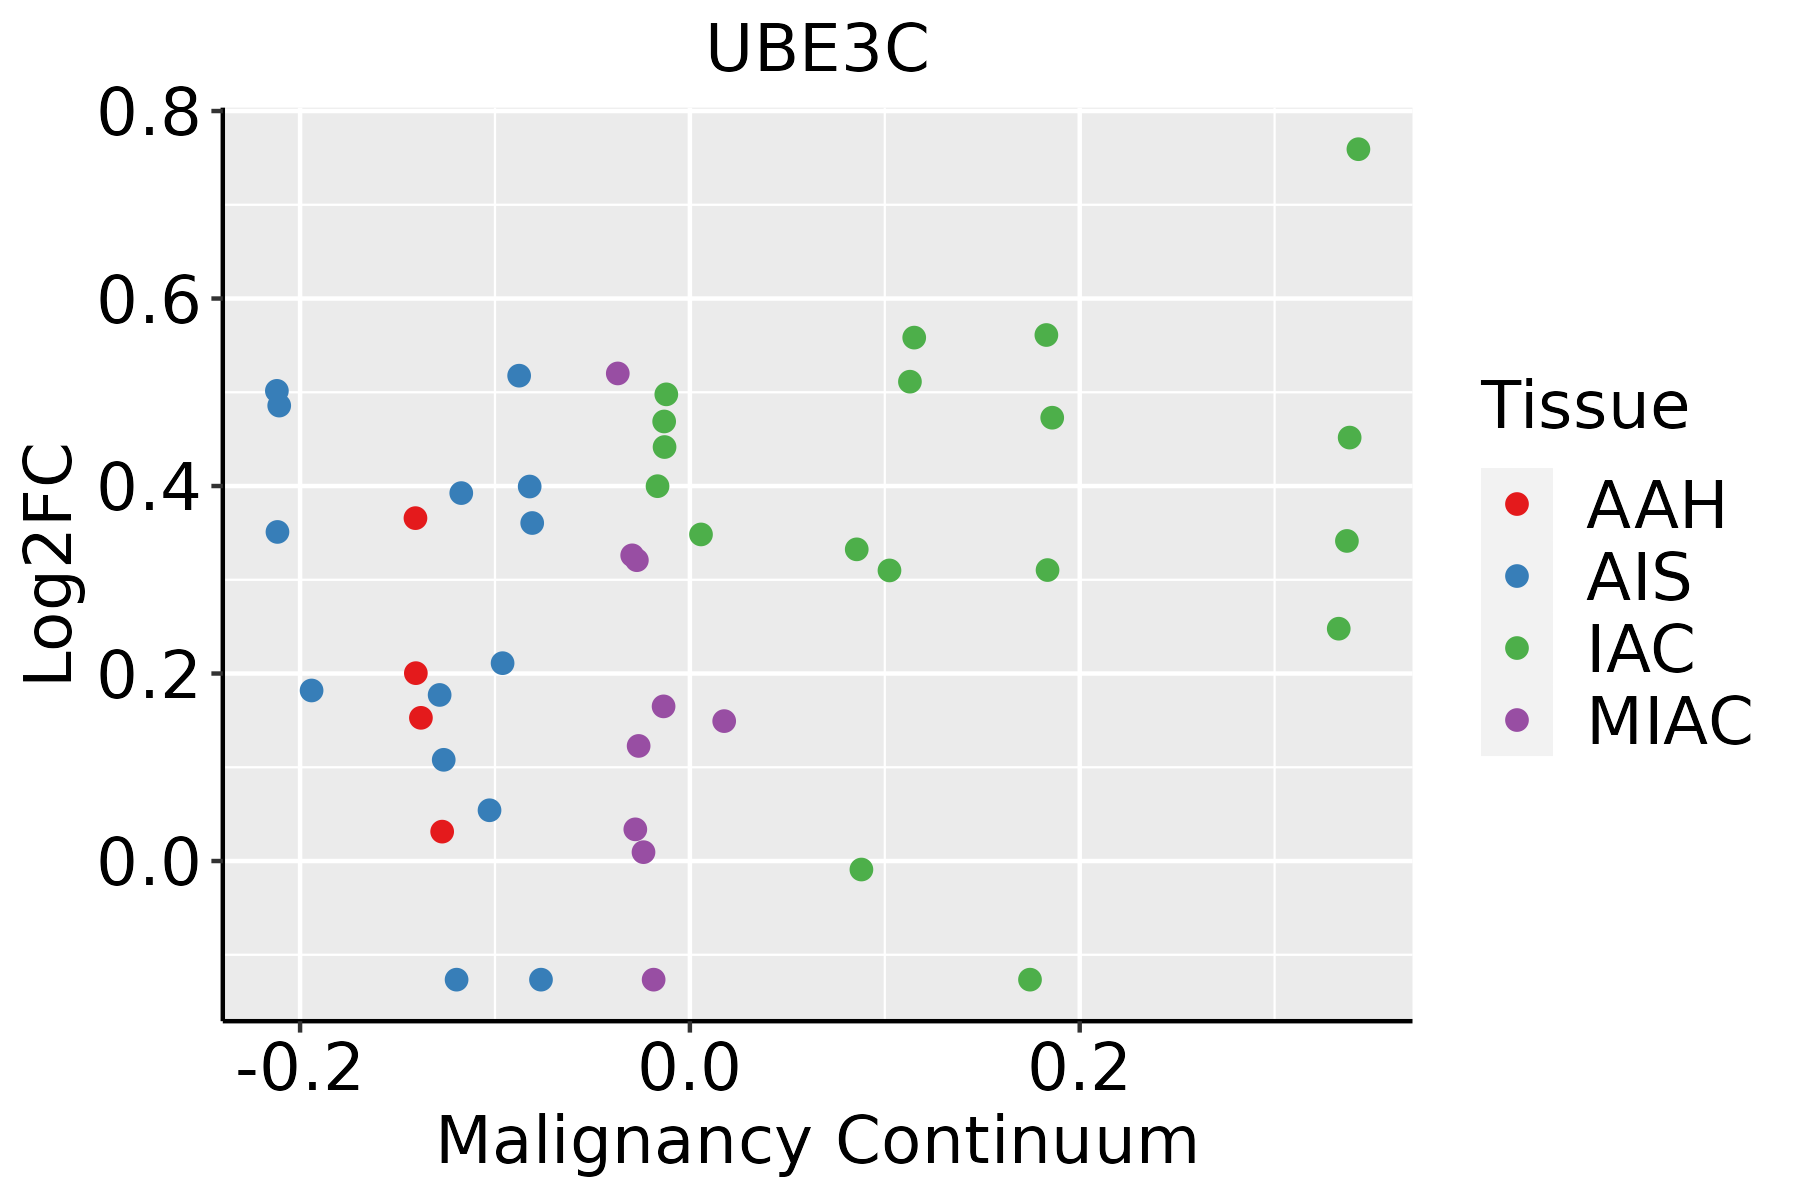 | AAH: Atypical adenomatous hyperplasia |
| AIS: Adenocarcinoma in situ |
| IAC: Invasive lung adenocarcinoma |
| MIA: Minimally invasive adenocarcinoma |
| Oral Cavity | 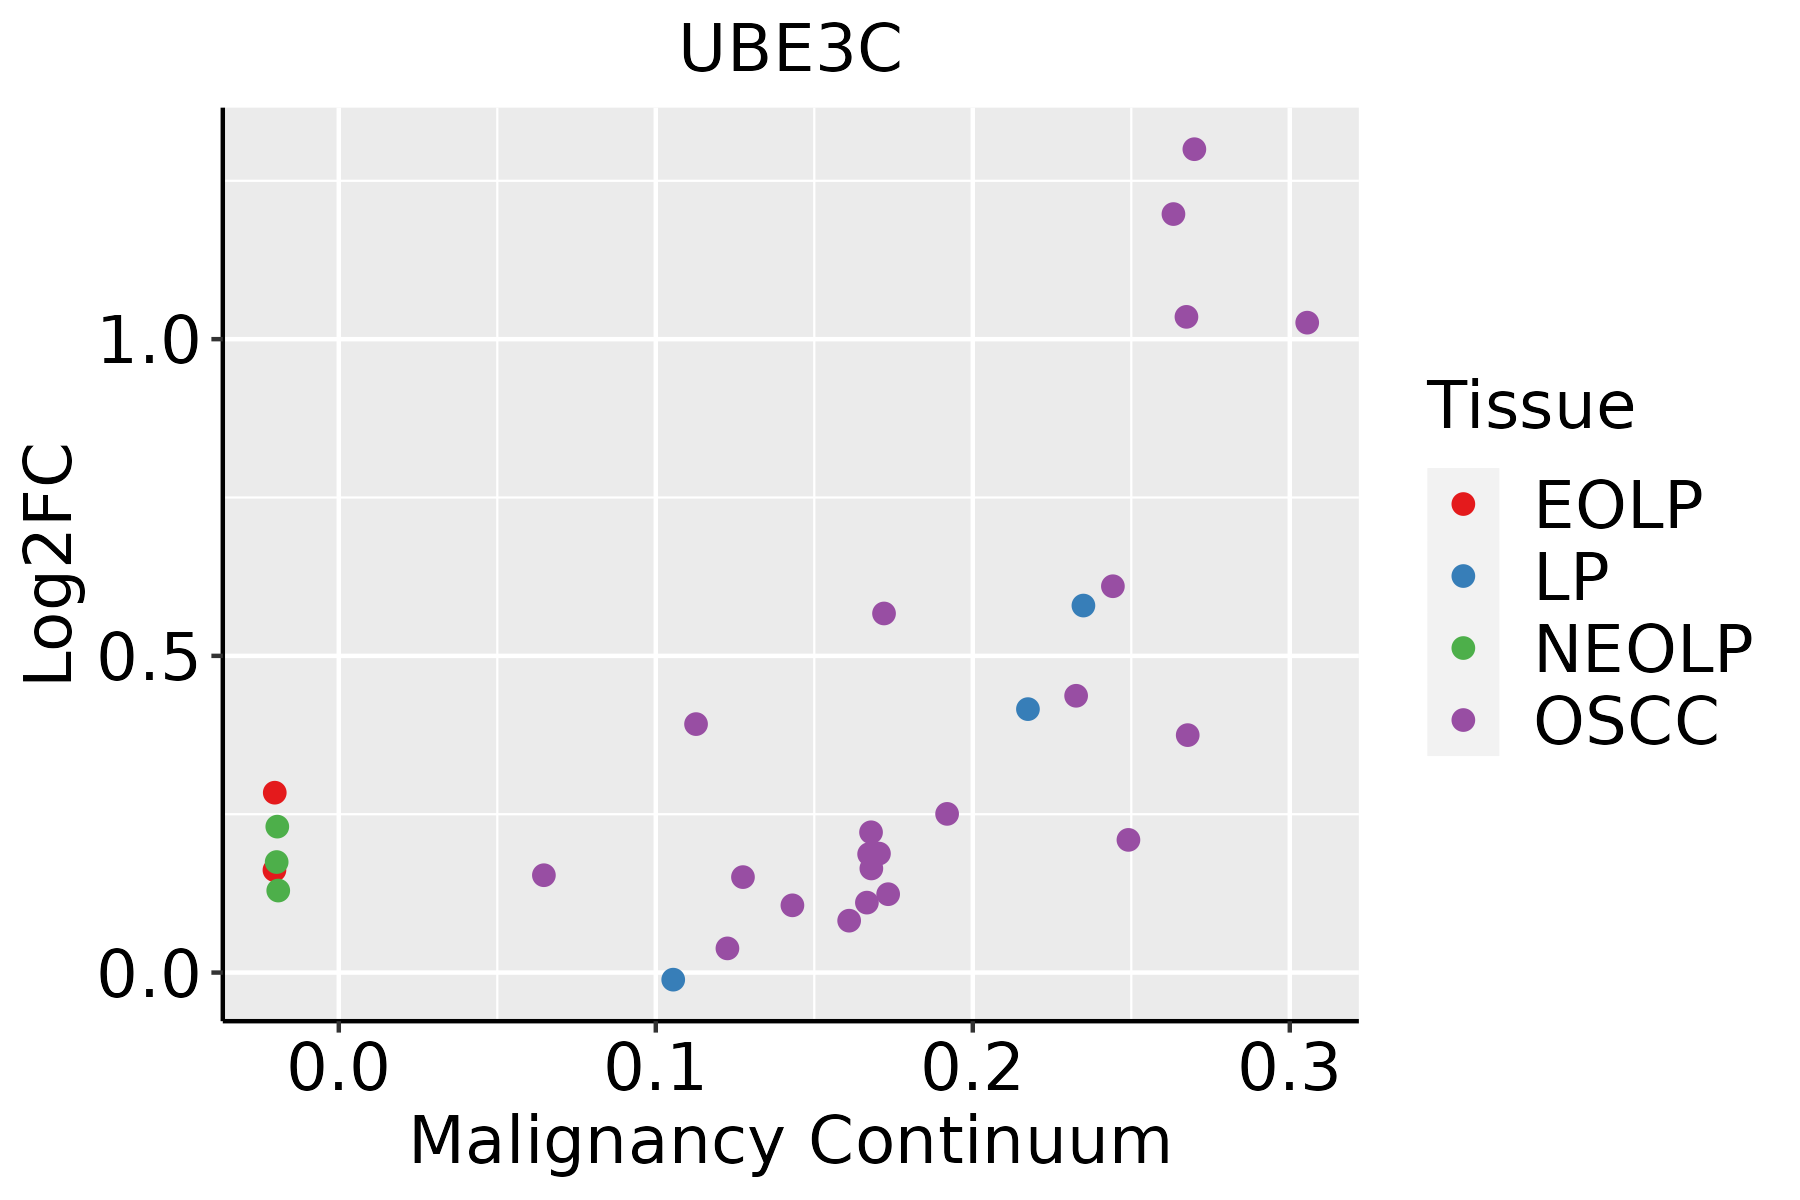 | EOLP: Erosive Oral lichen planus |
| LP: leukoplakia |
| NEOLP: Non-erosive oral lichen planus |
| OSCC: Oral squamous cell carcinoma |
| Prostate | 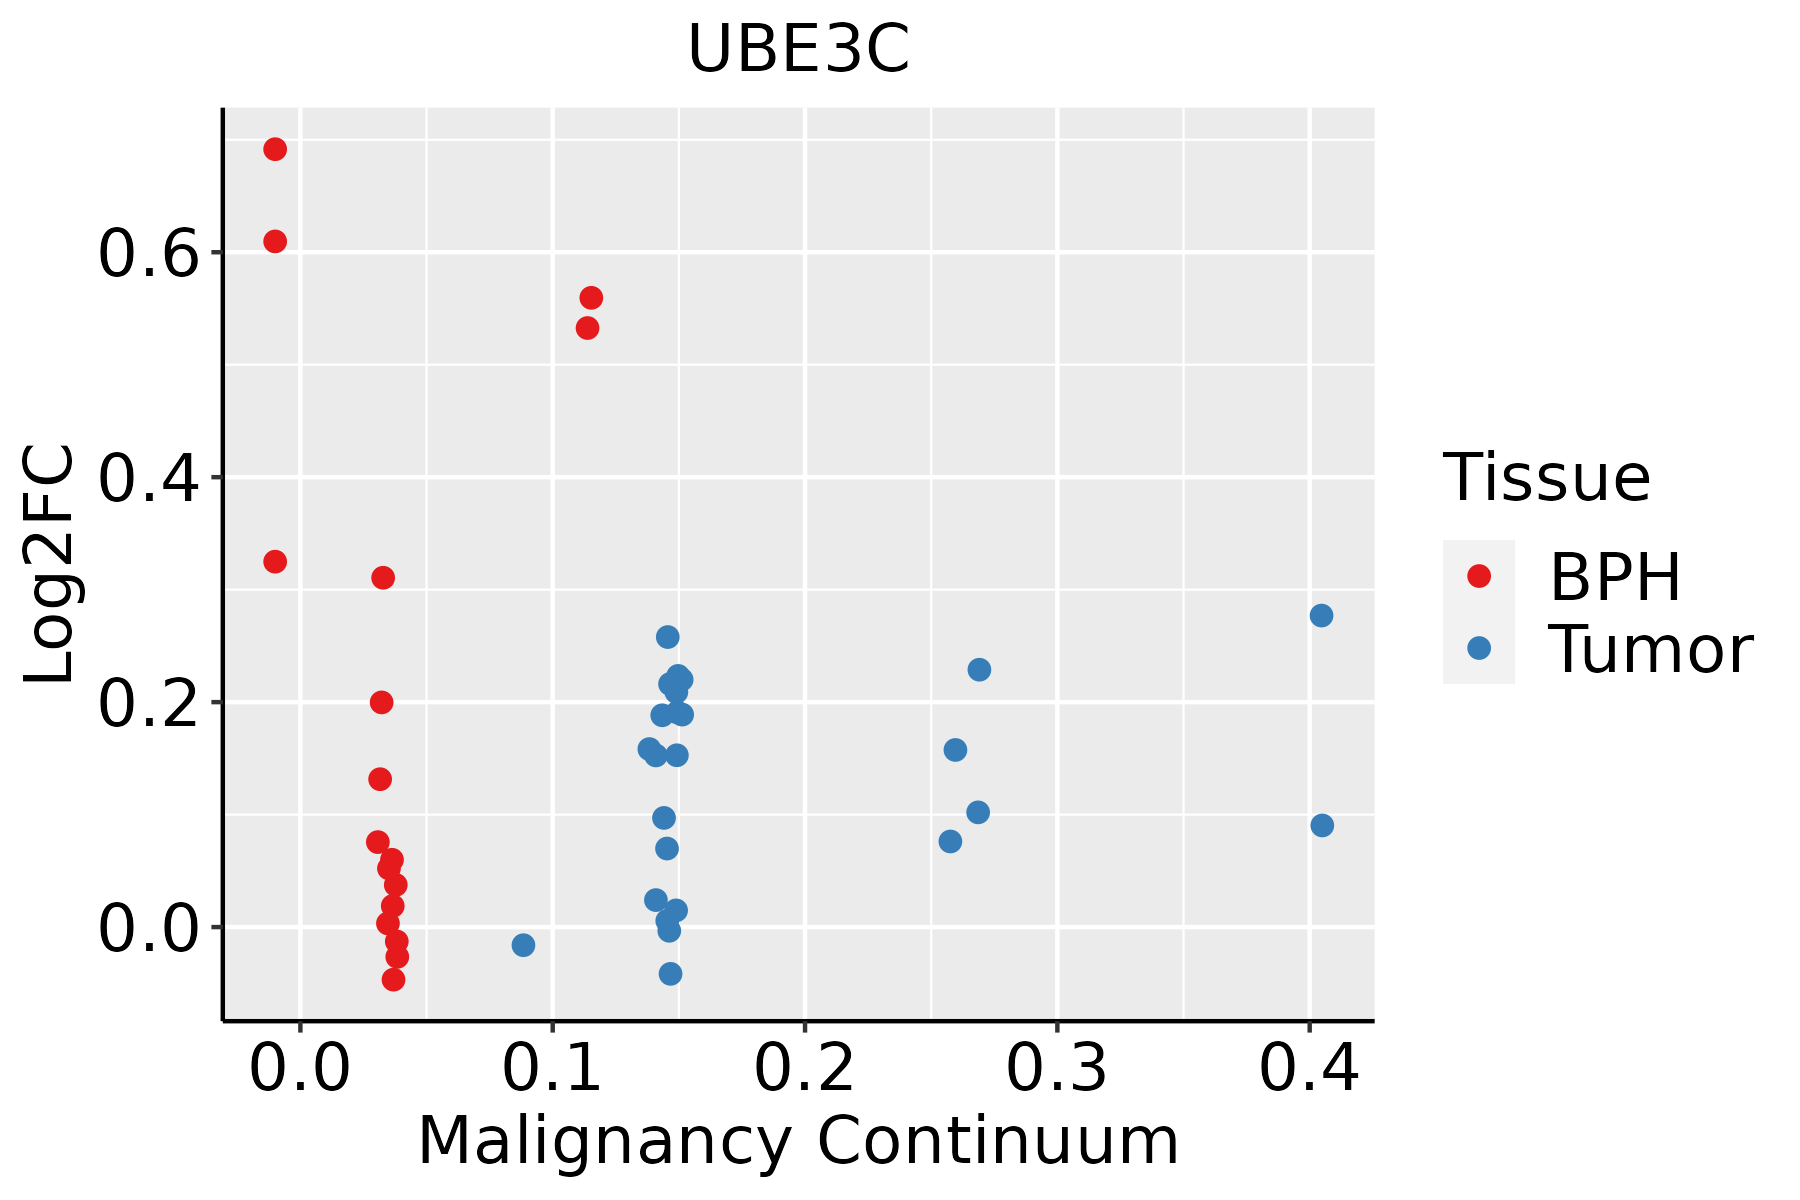 | BPH: Benign Prostatic Hyperplasia |
| Skin | 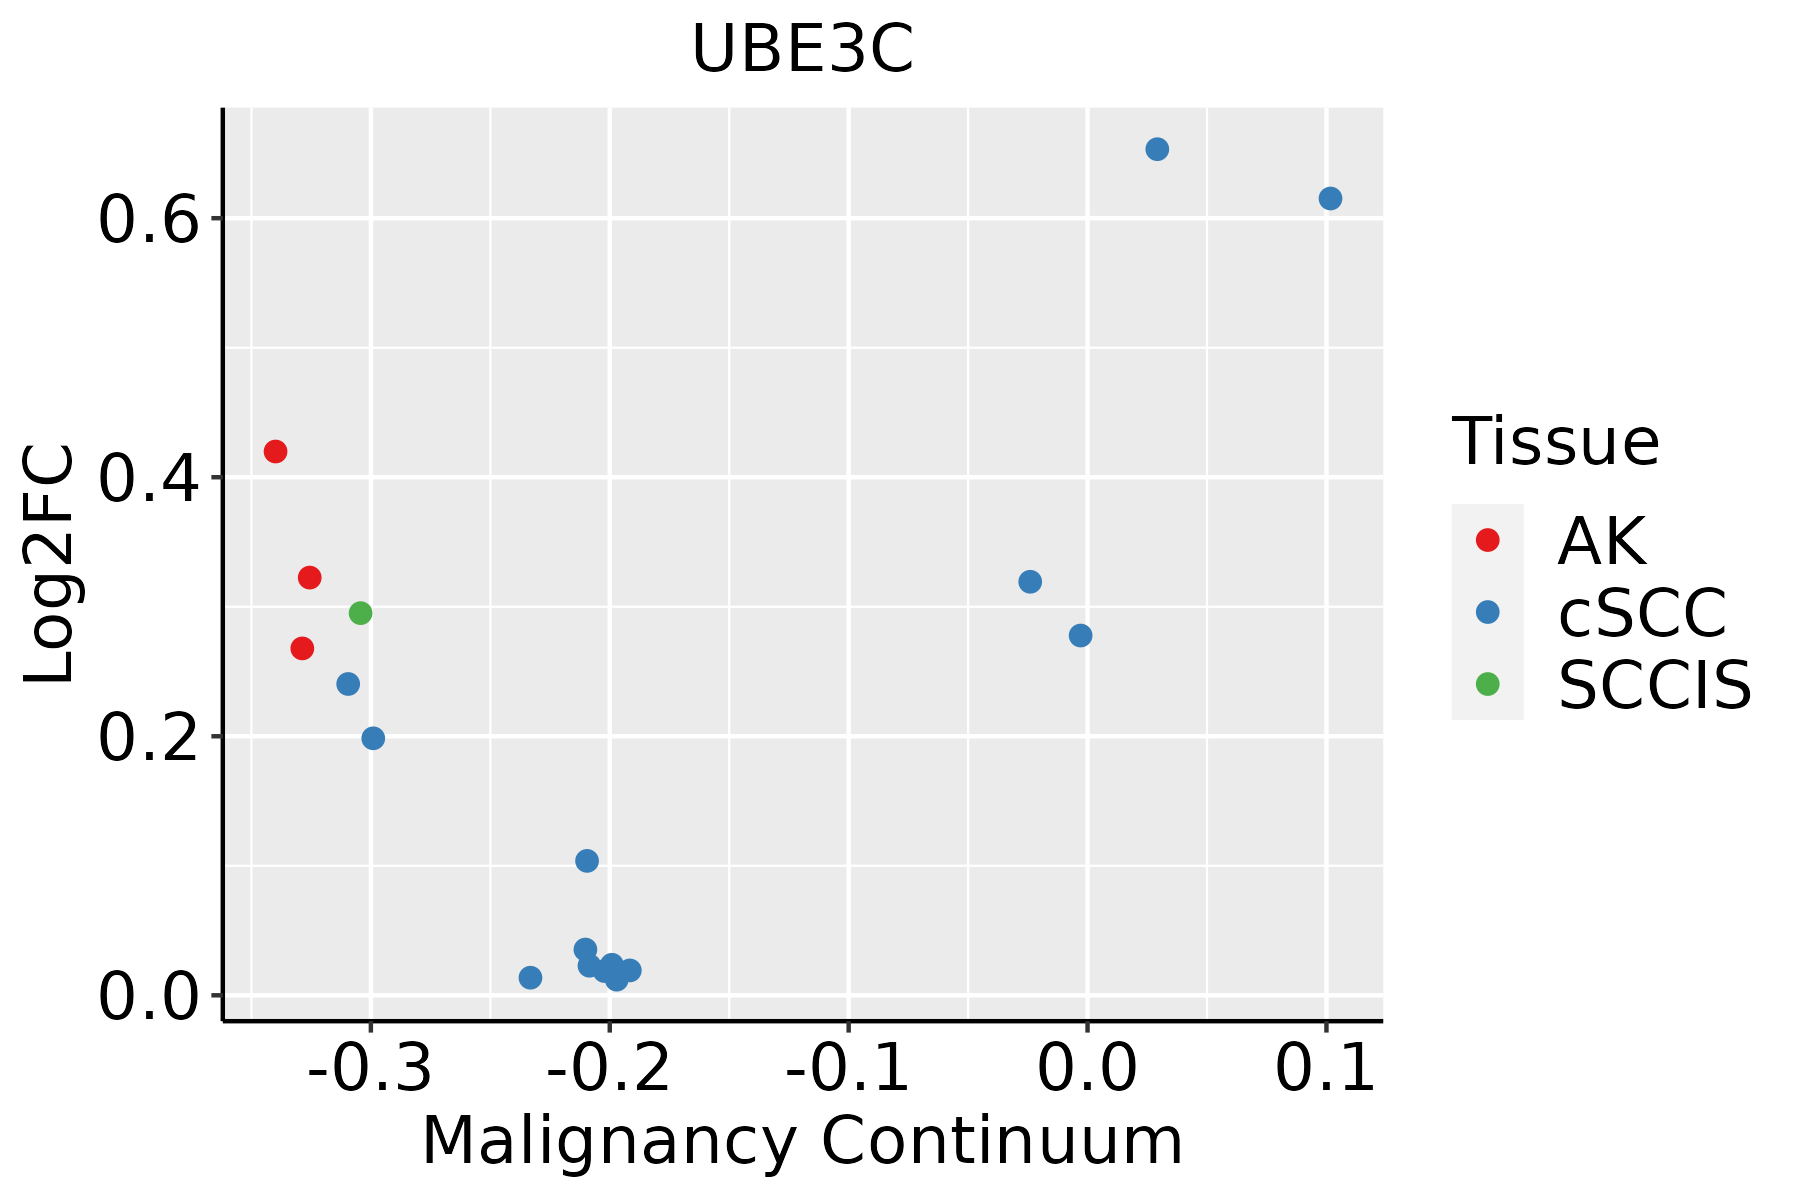 | AK: Actinic keratosis |
| cSCC: Cutaneous squamous cell carcinoma |
| SCCIS:squamous cell carcinoma in situ |
| Thyroid |  | ATC: Anaplastic thyroid cancer |
| HT: Hashimoto's thyroiditis |
| PTC: Papillary thyroid cancer |
| GO ID | Tissue | Disease Stage | Description | Gene Ratio | Bg Ratio | pvalue | p.adjust | Count |
| GO:00002097 | Cervix | CC | protein polyubiquitination | 58/2311 | 236/18723 | 1.57e-07 | 7.41e-06 | 58 |
| GO:0000209 | Colorectum | AD | protein polyubiquitination | 78/3918 | 236/18723 | 8.71e-06 | 2.06e-04 | 78 |
| GO:00002092 | Colorectum | MSS | protein polyubiquitination | 72/3467 | 236/18723 | 5.19e-06 | 1.42e-04 | 72 |
| GO:00002093 | Colorectum | FAP | protein polyubiquitination | 59/2622 | 236/18723 | 4.53e-06 | 1.52e-04 | 59 |
| GO:00002094 | Colorectum | CRC | protein polyubiquitination | 46/2078 | 236/18723 | 9.91e-05 | 1.98e-03 | 46 |
| GO:000020917 | Esophagus | ESCC | protein polyubiquitination | 170/8552 | 236/18723 | 1.40e-16 | 1.09e-14 | 170 |
| GO:00002095 | Liver | NAFLD | protein polyubiquitination | 51/1882 | 236/18723 | 1.04e-07 | 8.10e-06 | 51 |
| GO:000020921 | Liver | HCC | protein polyubiquitination | 151/7958 | 236/18723 | 1.90e-11 | 7.59e-10 | 151 |
| GO:00002096 | Lung | IAC | protein polyubiquitination | 49/2061 | 236/18723 | 8.51e-06 | 2.89e-04 | 49 |
| GO:000020912 | Lung | AIS | protein polyubiquitination | 49/1849 | 236/18723 | 3.85e-07 | 3.16e-05 | 49 |
| GO:000020910 | Oral cavity | OSCC | protein polyubiquitination | 150/7305 | 236/18723 | 1.59e-14 | 9.27e-13 | 150 |
| GO:000020923 | Oral cavity | EOLP | protein polyubiquitination | 62/2218 | 236/18723 | 7.88e-10 | 5.90e-08 | 62 |
| GO:000020931 | Oral cavity | NEOLP | protein polyubiquitination | 53/2005 | 236/18723 | 1.22e-07 | 4.38e-06 | 53 |
| GO:00002099 | Prostate | BPH | protein polyubiquitination | 64/3107 | 236/18723 | 2.83e-05 | 3.31e-04 | 64 |
| GO:000020914 | Prostate | Tumor | protein polyubiquitination | 64/3246 | 236/18723 | 1.08e-04 | 1.03e-03 | 64 |
| GO:000020918 | Skin | AK | protein polyubiquitination | 41/1910 | 236/18723 | 4.78e-04 | 4.44e-03 | 41 |
| GO:000020919 | Skin | SCCIS | protein polyubiquitination | 22/919 | 236/18723 | 3.03e-03 | 2.76e-02 | 22 |
| GO:000020924 | Skin | cSCC | protein polyubiquitination | 103/4864 | 236/18723 | 2.57e-09 | 9.09e-08 | 103 |
| GO:000020920 | Thyroid | PTC | protein polyubiquitination | 128/5968 | 236/18723 | 7.81e-13 | 3.65e-11 | 128 |
| GO:0000209110 | Thyroid | ATC | protein polyubiquitination | 134/6293 | 236/18723 | 1.86e-13 | 9.20e-12 | 134 |
| Pathway ID | Tissue | Disease Stage | Description | Gene Ratio | Bg Ratio | pvalue | p.adjust | qvalue | Count |
| hsa0412014 | Cervix | CC | Ubiquitin mediated proteolysis | 49/1267 | 142/8465 | 4.26e-09 | 7.68e-08 | 4.54e-08 | 49 |
| hsa0412015 | Cervix | CC | Ubiquitin mediated proteolysis | 49/1267 | 142/8465 | 4.26e-09 | 7.68e-08 | 4.54e-08 | 49 |
| hsa04120 | Colorectum | AD | Ubiquitin mediated proteolysis | 58/2092 | 142/8465 | 1.46e-05 | 1.53e-04 | 9.76e-05 | 58 |
| hsa041201 | Colorectum | AD | Ubiquitin mediated proteolysis | 58/2092 | 142/8465 | 1.46e-05 | 1.53e-04 | 9.76e-05 | 58 |
| hsa041204 | Colorectum | MSS | Ubiquitin mediated proteolysis | 55/1875 | 142/8465 | 5.02e-06 | 6.00e-05 | 3.68e-05 | 55 |
| hsa041205 | Colorectum | MSS | Ubiquitin mediated proteolysis | 55/1875 | 142/8465 | 5.02e-06 | 6.00e-05 | 3.68e-05 | 55 |
| hsa041206 | Colorectum | FAP | Ubiquitin mediated proteolysis | 51/1404 | 142/8465 | 1.55e-08 | 5.84e-07 | 3.55e-07 | 51 |
| hsa041207 | Colorectum | FAP | Ubiquitin mediated proteolysis | 51/1404 | 142/8465 | 1.55e-08 | 5.84e-07 | 3.55e-07 | 51 |
| hsa041208 | Colorectum | CRC | Ubiquitin mediated proteolysis | 42/1091 | 142/8465 | 9.98e-08 | 6.67e-06 | 4.52e-06 | 42 |
| hsa041209 | Colorectum | CRC | Ubiquitin mediated proteolysis | 42/1091 | 142/8465 | 9.98e-08 | 6.67e-06 | 4.52e-06 | 42 |
| hsa0412027 | Esophagus | ESCC | Ubiquitin mediated proteolysis | 122/4205 | 142/8465 | 6.53e-20 | 7.29e-18 | 3.74e-18 | 122 |
| hsa0412036 | Esophagus | ESCC | Ubiquitin mediated proteolysis | 122/4205 | 142/8465 | 6.53e-20 | 7.29e-18 | 3.74e-18 | 122 |
| hsa0412010 | Liver | NAFLD | Ubiquitin mediated proteolysis | 44/1043 | 142/8465 | 2.59e-09 | 1.70e-07 | 1.37e-07 | 44 |
| hsa0412011 | Liver | NAFLD | Ubiquitin mediated proteolysis | 44/1043 | 142/8465 | 2.59e-09 | 1.70e-07 | 1.37e-07 | 44 |
| hsa0412041 | Liver | HCC | Ubiquitin mediated proteolysis | 110/4020 | 142/8465 | 1.67e-13 | 3.74e-12 | 2.08e-12 | 110 |
| hsa0412051 | Liver | HCC | Ubiquitin mediated proteolysis | 110/4020 | 142/8465 | 1.67e-13 | 3.74e-12 | 2.08e-12 | 110 |
| hsa0412012 | Lung | IAC | Ubiquitin mediated proteolysis | 40/1053 | 142/8465 | 3.24e-07 | 1.76e-05 | 1.17e-05 | 40 |
| hsa0412013 | Lung | IAC | Ubiquitin mediated proteolysis | 40/1053 | 142/8465 | 3.24e-07 | 1.76e-05 | 1.17e-05 | 40 |
| hsa0412022 | Lung | AIS | Ubiquitin mediated proteolysis | 41/961 | 142/8465 | 8.01e-09 | 4.33e-07 | 2.77e-07 | 41 |
| hsa0412032 | Lung | AIS | Ubiquitin mediated proteolysis | 41/961 | 142/8465 | 8.01e-09 | 4.33e-07 | 2.77e-07 | 41 |
| Hugo Symbol | Variant Class | Variant Classification | dbSNP RS | HGVSc | HGVSp | HGVSp Short | SWISSPROT | BIOTYPE | SIFT | PolyPhen | Tumor Sample Barcode | Tissue | Histology | Sex | Age | Stage | Therapy Types | Drugs | Outcome |
| UBE3C | SNV | Missense_Mutation | novel | c.3113N>A | p.Gly1038Glu | p.G1038E | Q15386 | protein_coding | deleterious(0) | probably_damaging(0.94) | TCGA-5L-AAT0-01 | Breast | breast invasive carcinoma | Female | <65 | I/II | Hormone Therapy | tamoxiphen | SD |
| UBE3C | SNV | Missense_Mutation | | c.2560G>A | p.Val854Met | p.V854M | Q15386 | protein_coding | deleterious(0) | probably_damaging(0.946) | TCGA-A8-A09W-01 | Breast | breast invasive carcinoma | Female | >=65 | III/IV | Unknown | Unknown | SD |
| UBE3C | SNV | Missense_Mutation | novel | c.2650G>C | p.Gly884Arg | p.G884R | Q15386 | protein_coding | deleterious(0) | probably_damaging(0.988) | TCGA-AC-A3W5-01 | Breast | breast invasive carcinoma | Female | >=65 | I/II | Chemotherapy | docetaxel | CR |
| UBE3C | SNV | Missense_Mutation | novel | c.2468N>C | p.Arg823Thr | p.R823T | Q15386 | protein_coding | deleterious(0.01) | possibly_damaging(0.903) | TCGA-AC-A5XS-01 | Breast | breast invasive carcinoma | Female | >=65 | I/II | Hormone Therapy | femara | SD |
| UBE3C | SNV | Missense_Mutation | | c.92G>A | p.Arg31His | p.R31H | Q15386 | protein_coding | tolerated(0.25) | benign(0.074) | TCGA-AN-A046-01 | Breast | breast invasive carcinoma | Female | >=65 | I/II | Unknown | Unknown | SD |
| UBE3C | SNV | Missense_Mutation | novel | c.509G>A | p.Arg170Lys | p.R170K | Q15386 | protein_coding | deleterious(0) | probably_damaging(0.996) | TCGA-AN-A046-01 | Breast | breast invasive carcinoma | Female | >=65 | I/II | Unknown | Unknown | SD |
| UBE3C | SNV | Missense_Mutation | | c.1885N>C | p.Ser629Pro | p.S629P | Q15386 | protein_coding | deleterious(0) | probably_damaging(0.949) | TCGA-BH-A0HA-01 | Breast | breast invasive carcinoma | Female | <65 | I/II | Unknown | Unknown | SD |
| UBE3C | SNV | Missense_Mutation | | c.2081N>T | p.Pro694Leu | p.P694L | Q15386 | protein_coding | deleterious(0.01) | possibly_damaging(0.796) | TCGA-BH-A18Q-01 | Breast | breast invasive carcinoma | Female | <65 | I/II | Unknown | Unknown | SD |
| UBE3C | insertion | In_Frame_Ins | novel | c.2395_2396insCGCATTCAAAGCCATCCCGAGCCACATCGGCCTGTGGGCTGCAGG | p.Leu799delinsProHisSerLysProSerArgAlaThrSerAlaCysGlyLeuGlnVal | p.L799delinsPHSKPSRATSACGLQV | Q15386 | protein_coding | | | TCGA-A7-A0CE-01 | Breast | breast invasive carcinoma | Female | <65 | I/II | Chemotherapy | adriamycin | SD |
| UBE3C | insertion | Frame_Shift_Ins | novel | c.3016_3017insGGTGTTATTTCTGT | p.Glu1006GlyfsTer12 | p.E1006Gfs*12 | Q15386 | protein_coding | | | TCGA-A8-A06X-01 | Breast | breast invasive carcinoma | Female | >=65 | I/II | Unknown | Unknown | SD |


