
|
|||||
|
 | |
| |
| |
| |
| |
| |
|
Gene: UBE3B |
Gene summary for UBE3B |
| Gene information | Species | Human | Gene symbol | UBE3B | Gene ID | 89910 |
| Gene name | ubiquitin protein ligase E3B | |
| Gene Alias | BPIDS | |
| Cytomap | 12q24.11 | |
| Gene Type | protein-coding | GO ID | GO:0000209 | UniProtAcc | Q7Z3V4 |
Top |
Malignant transformation analysis |
| Identification of the aberrant gene expression in precancerous and cancerous lesions by comparing the gene expression of stem-like cells in diseased tissues with normal stem cells |
| Entrez ID | Symbol | Replicates | Species | Organ | Tissue | Adj P-value | Log2FC | Malignancy |
| 89910 | UBE3B | LZE5T | Human | Esophagus | ESCC | 1.75e-03 | 2.45e-01 | 0.0514 |
| 89910 | UBE3B | LZE20T | Human | Esophagus | ESCC | 9.51e-06 | 1.51e-01 | 0.0662 |
| 89910 | UBE3B | LZE24T | Human | Esophagus | ESCC | 4.12e-04 | 2.11e-01 | 0.0596 |
| 89910 | UBE3B | P1T-E | Human | Esophagus | ESCC | 1.70e-04 | 3.30e-01 | 0.0875 |
| 89910 | UBE3B | P2T-E | Human | Esophagus | ESCC | 1.98e-16 | 3.24e-01 | 0.1177 |
| 89910 | UBE3B | P4T-E | Human | Esophagus | ESCC | 6.87e-13 | 2.19e-01 | 0.1323 |
| 89910 | UBE3B | P5T-E | Human | Esophagus | ESCC | 2.60e-09 | 1.40e-01 | 0.1327 |
| 89910 | UBE3B | P8T-E | Human | Esophagus | ESCC | 1.96e-11 | 2.38e-01 | 0.0889 |
| 89910 | UBE3B | P9T-E | Human | Esophagus | ESCC | 3.53e-03 | 8.66e-02 | 0.1131 |
| 89910 | UBE3B | P10T-E | Human | Esophagus | ESCC | 2.54e-10 | 2.05e-01 | 0.116 |
| 89910 | UBE3B | P11T-E | Human | Esophagus | ESCC | 6.66e-05 | 3.67e-01 | 0.1426 |
| 89910 | UBE3B | P12T-E | Human | Esophagus | ESCC | 2.80e-07 | 1.57e-01 | 0.1122 |
| 89910 | UBE3B | P15T-E | Human | Esophagus | ESCC | 1.51e-12 | 2.96e-01 | 0.1149 |
| 89910 | UBE3B | P16T-E | Human | Esophagus | ESCC | 6.33e-12 | 2.26e-01 | 0.1153 |
| 89910 | UBE3B | P17T-E | Human | Esophagus | ESCC | 1.40e-04 | 1.71e-01 | 0.1278 |
| 89910 | UBE3B | P19T-E | Human | Esophagus | ESCC | 2.57e-03 | 3.10e-01 | 0.1662 |
| 89910 | UBE3B | P20T-E | Human | Esophagus | ESCC | 4.80e-21 | 3.12e-01 | 0.1124 |
| 89910 | UBE3B | P21T-E | Human | Esophagus | ESCC | 1.81e-20 | 3.92e-01 | 0.1617 |
| 89910 | UBE3B | P22T-E | Human | Esophagus | ESCC | 3.88e-07 | 1.71e-01 | 0.1236 |
| 89910 | UBE3B | P23T-E | Human | Esophagus | ESCC | 6.60e-10 | 1.72e-01 | 0.108 |
| Page: 1 2 3 4 |
| Tissue | Expression Dynamics | Abbreviation |
| Esophagus | 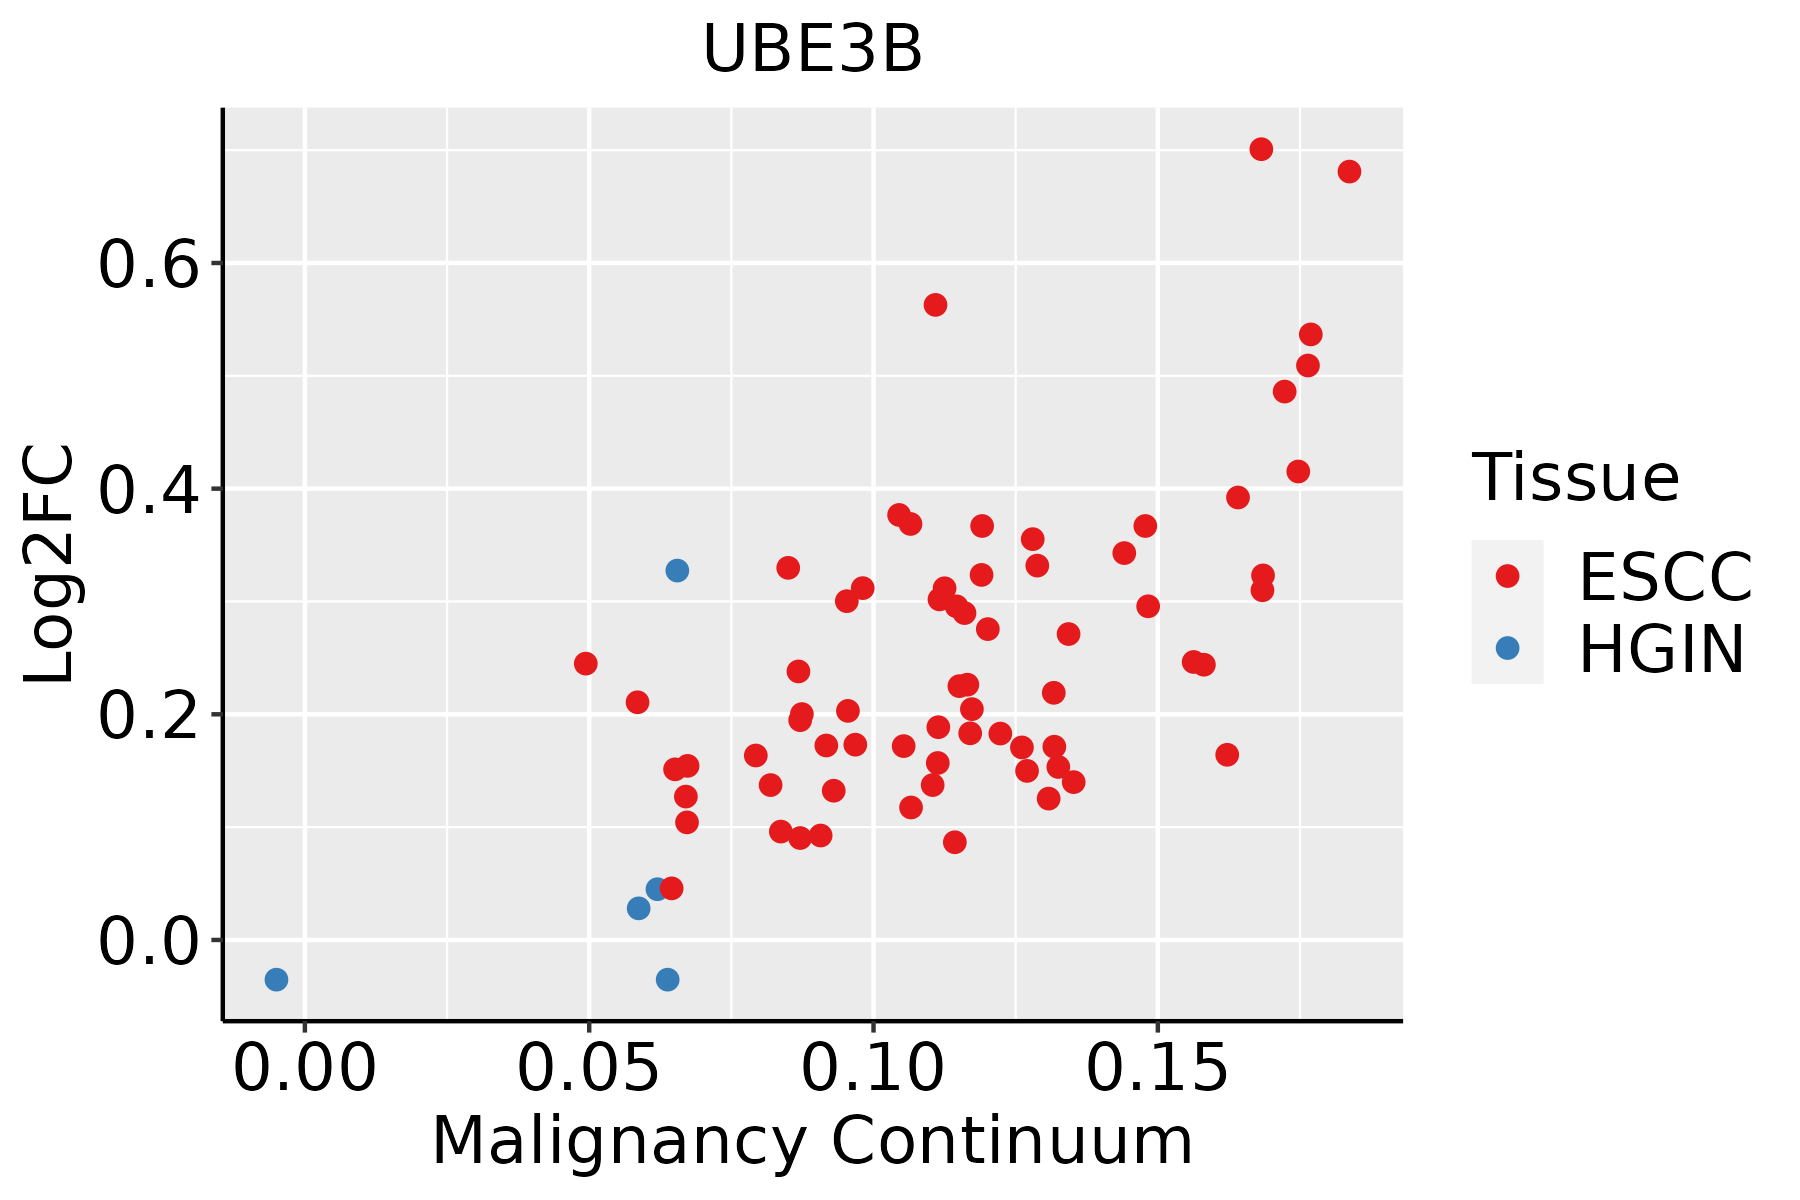 | ESCC: Esophageal squamous cell carcinoma |
| HGIN: High-grade intraepithelial neoplasias | ||
| LGIN: Low-grade intraepithelial neoplasias | ||
| Liver |  | HCC: Hepatocellular carcinoma |
| NAFLD: Non-alcoholic fatty liver disease | ||
| Oral Cavity |  | EOLP: Erosive Oral lichen planus |
| LP: leukoplakia | ||
| NEOLP: Non-erosive oral lichen planus | ||
| OSCC: Oral squamous cell carcinoma |
| ∗log2FC in expression of this searched gene in stem-like cells from each diseased tissue sample relative to stem-like cells in normal samples in each tissue plotted against the malignancy continuum. Samples are colored based on if they are from different disease stage. |
Top |
Malignant transformation related pathway analysis |
| Find out the enriched GO biological processes and KEGG pathways involved in transition from healthy to precancer to cancer |
| Tissue | Disease Stage | Enriched GO biological Processes |
| Colorectum | AD |  |
| Colorectum | SER |  |
| Colorectum | MSS |  |
| Colorectum | MSI-H |  |
| Colorectum | FAP |  |
| ∗Top 15 enriched GO BP terms are showed in the bar plot of each disease state in each tissue. Each row represents a significant GO biological process which is colored according to the -log10(p.adjust). |
| Page: 1 2 3 4 5 6 7 8 9 |
| GO ID | Tissue | Disease Stage | Description | Gene Ratio | Bg Ratio | pvalue | p.adjust | Count |
| GO:000020917 | Esophagus | ESCC | protein polyubiquitination | 170/8552 | 236/18723 | 1.40e-16 | 1.09e-14 | 170 |
| GO:000020921 | Liver | HCC | protein polyubiquitination | 151/7958 | 236/18723 | 1.90e-11 | 7.59e-10 | 151 |
| GO:000020910 | Oral cavity | OSCC | protein polyubiquitination | 150/7305 | 236/18723 | 1.59e-14 | 9.27e-13 | 150 |
| Page: 1 |
| Pathway ID | Tissue | Disease Stage | Description | Gene Ratio | Bg Ratio | pvalue | p.adjust | qvalue | Count |
| hsa0412027 | Esophagus | ESCC | Ubiquitin mediated proteolysis | 122/4205 | 142/8465 | 6.53e-20 | 7.29e-18 | 3.74e-18 | 122 |
| hsa0412036 | Esophagus | ESCC | Ubiquitin mediated proteolysis | 122/4205 | 142/8465 | 6.53e-20 | 7.29e-18 | 3.74e-18 | 122 |
| hsa0412041 | Liver | HCC | Ubiquitin mediated proteolysis | 110/4020 | 142/8465 | 1.67e-13 | 3.74e-12 | 2.08e-12 | 110 |
| hsa0412051 | Liver | HCC | Ubiquitin mediated proteolysis | 110/4020 | 142/8465 | 1.67e-13 | 3.74e-12 | 2.08e-12 | 110 |
| hsa0412020 | Oral cavity | OSCC | Ubiquitin mediated proteolysis | 105/3704 | 142/8465 | 1.83e-13 | 4.37e-12 | 2.23e-12 | 105 |
| hsa04120110 | Oral cavity | OSCC | Ubiquitin mediated proteolysis | 105/3704 | 142/8465 | 1.83e-13 | 4.37e-12 | 2.23e-12 | 105 |
| Page: 1 |
Top |
Cell-cell communication analysis |
| Identification of potential cell-cell interactions between two cell types and their ligand-receptor pairs for different disease states |
| Ligand | Receptor | LRpair | Pathway | Tissue | Disease Stage |
| Page: 1 |
Top |
Single-cell gene regulatory network inference analysis |
| Find out the significant the regulons (TFs) and the target genes of each regulon across cell types for different disease states |
| TF | Cell Type | Tissue | Disease Stage | Target Gene | RSS | Regulon Activity |
| ∗The dot plots of a searched regulon are shown for all cell subpopulations in each disease state of each tissue based on the regulon specific score inferred using pySCENIC and by calculating the average expression. |
| Page: 1 |
Top |
Somatic mutation of malignant transformation related genes |
| Annotation of somatic variants for genes involved in malignant transformation |
| Hugo Symbol | Variant Class | Variant Classification | dbSNP RS | HGVSc | HGVSp | HGVSp Short | SWISSPROT | BIOTYPE | SIFT | PolyPhen | Tumor Sample Barcode | Tissue | Histology | Sex | Age | Stage | Therapy Types | Drugs | Outcome |
| UBE3B | SNV | Missense_Mutation | rs774422074 | c.2141N>C | p.Phe714Ser | p.F714S | Q7Z3V4 | protein_coding | deleterious(0) | probably_damaging(0.994) | TCGA-A2-A0EV-01 | Breast | breast invasive carcinoma | Female | >=65 | I/II | Unknown | Unknown | SD |
| UBE3B | SNV | Missense_Mutation | rs748411631 | c.743A>G | p.Asn248Ser | p.N248S | Q7Z3V4 | protein_coding | tolerated(0.21) | benign(0.001) | TCGA-A7-A4SA-01 | Breast | breast invasive carcinoma | Female | <65 | I/II | Chemotherapy | doxorubicin | CR |
| UBE3B | SNV | Missense_Mutation | novel | c.2633N>C | p.Ser878Thr | p.S878T | Q7Z3V4 | protein_coding | tolerated(0.27) | benign(0.354) | TCGA-B6-A400-01 | Breast | breast invasive carcinoma | Female | <65 | III/IV | Unknown | Unknown | SD |
| UBE3B | SNV | Missense_Mutation | novel | c.267N>G | p.Ile89Met | p.I89M | Q7Z3V4 | protein_coding | tolerated(0.27) | benign(0.006) | TCGA-BH-A0B6-01 | Breast | breast invasive carcinoma | Female | <65 | I/II | Unknown | Unknown | SD |
| UBE3B | SNV | Missense_Mutation | c.2215A>T | p.Ile739Phe | p.I739F | Q7Z3V4 | protein_coding | deleterious(0) | possibly_damaging(0.796) | TCGA-D8-A1XQ-01 | Breast | breast invasive carcinoma | Female | >=65 | I/II | Unknown | Unknown | SD | |
| UBE3B | SNV | Missense_Mutation | c.1834C>G | p.Pro612Ala | p.P612A | Q7Z3V4 | protein_coding | deleterious(0.01) | possibly_damaging(0.835) | TCGA-E2-A1BD-01 | Breast | breast invasive carcinoma | Female | <65 | I/II | Hormone Therapy | arimidex | SD | |
| UBE3B | SNV | Missense_Mutation | novel | c.3177C>G | p.Ile1059Met | p.I1059M | Q7Z3V4 | protein_coding | deleterious(0) | probably_damaging(0.998) | TCGA-EW-A1PC-01 | Breast | breast invasive carcinoma | Female | >=65 | I/II | Hormone Therapy | tamoxiphen | SD |
| UBE3B | SNV | Missense_Mutation | c.703C>G | p.Leu235Val | p.L235V | Q7Z3V4 | protein_coding | tolerated(0.1) | benign(0.343) | TCGA-PE-A5DC-01 | Breast | breast invasive carcinoma | Female | >=65 | III/IV | Unknown | Unknown | SD | |
| UBE3B | insertion | Nonsense_Mutation | novel | c.2122_2123insAGCACTCATTCAAAAGCAGGTGAGAACGGCTCCT | p.Gly708GlufsTer8 | p.G708Efs*8 | Q7Z3V4 | protein_coding | TCGA-A8-A0AB-01 | Breast | breast invasive carcinoma | Female | <65 | I/II | Chemotherapy | 5-fluorouracil | CR | ||
| UBE3B | insertion | Nonsense_Mutation | novel | c.1544_1545insTTCCCTAATATAGTCCTCTGAATTTTTACCATTGTG | p.Leu515_Asn516insSerLeuIleTerSerSerGluPheLeuProLeuTrp | p.L515_N516insSLI*SSEFLPLW | Q7Z3V4 | protein_coding | TCGA-AN-A041-01 | Breast | breast invasive carcinoma | Female | <65 | I/II | Unknown | Unknown | SD |
| Page: 1 2 3 4 5 6 7 8 9 10 11 12 13 |
Top |
Related drugs of malignant transformation related genes |
| Identification of chemicals and drugs interact with genes involved in malignant transfromation |
| (DGIdb 4.0) |
| Entrez ID | Symbol | Category | Interaction Types | Drug Claim Name | Drug Name | PMIDs |
| Page: 1 |

Copyright 2023-Present -The University of Texas Health Science Center at Houston |