
|
|||||
|
 | |
| |
| |
| |
| |
| |
|
Gene: UBE2Z |
Gene summary for UBE2Z |
| Gene information | Species | Human | Gene symbol | UBE2Z | Gene ID | 65264 |
| Gene name | ubiquitin conjugating enzyme E2 Z | |
| Gene Alias | HOYS7 | |
| Cytomap | 17q21.32 | |
| Gene Type | protein-coding | GO ID | GO:0006464 | UniProtAcc | Q9H832 |
Top |
Malignant transformation analysis |
| Identification of the aberrant gene expression in precancerous and cancerous lesions by comparing the gene expression of stem-like cells in diseased tissues with normal stem cells |
| Entrez ID | Symbol | Replicates | Species | Organ | Tissue | Adj P-value | Log2FC | Malignancy |
| 65264 | UBE2Z | LZE2T | Human | Esophagus | ESCC | 6.25e-07 | 2.36e-01 | 0.082 |
| 65264 | UBE2Z | LZE4T | Human | Esophagus | ESCC | 4.20e-11 | 7.87e-02 | 0.0811 |
| 65264 | UBE2Z | LZE5T | Human | Esophagus | ESCC | 2.36e-04 | 7.87e-02 | 0.0514 |
| 65264 | UBE2Z | LZE7T | Human | Esophagus | ESCC | 2.11e-10 | 1.38e-01 | 0.0667 |
| 65264 | UBE2Z | LZE8T | Human | Esophagus | ESCC | 2.60e-10 | 2.14e-01 | 0.067 |
| 65264 | UBE2Z | LZE20T | Human | Esophagus | ESCC | 7.38e-06 | 2.11e-02 | 0.0662 |
| 65264 | UBE2Z | LZE22T | Human | Esophagus | ESCC | 1.04e-05 | 1.06e-01 | 0.068 |
| 65264 | UBE2Z | LZE24T | Human | Esophagus | ESCC | 2.02e-15 | 4.35e-01 | 0.0596 |
| 65264 | UBE2Z | LZE21T | Human | Esophagus | ESCC | 3.75e-04 | 4.10e-01 | 0.0655 |
| 65264 | UBE2Z | P1T-E | Human | Esophagus | ESCC | 1.65e-07 | -7.04e-03 | 0.0875 |
| 65264 | UBE2Z | P2T-E | Human | Esophagus | ESCC | 5.00e-17 | 4.16e-01 | 0.1177 |
| 65264 | UBE2Z | P4T-E | Human | Esophagus | ESCC | 2.21e-22 | 4.05e-01 | 0.1323 |
| 65264 | UBE2Z | P5T-E | Human | Esophagus | ESCC | 6.78e-13 | 1.30e-01 | 0.1327 |
| 65264 | UBE2Z | P8T-E | Human | Esophagus | ESCC | 1.17e-13 | 1.97e-01 | 0.0889 |
| 65264 | UBE2Z | P9T-E | Human | Esophagus | ESCC | 1.56e-10 | 2.87e-01 | 0.1131 |
| 65264 | UBE2Z | P10T-E | Human | Esophagus | ESCC | 2.00e-17 | 2.60e-01 | 0.116 |
| 65264 | UBE2Z | P11T-E | Human | Esophagus | ESCC | 6.75e-09 | 5.18e-01 | 0.1426 |
| 65264 | UBE2Z | P12T-E | Human | Esophagus | ESCC | 2.23e-14 | 2.48e-01 | 0.1122 |
| 65264 | UBE2Z | P15T-E | Human | Esophagus | ESCC | 9.99e-14 | 2.47e-01 | 0.1149 |
| 65264 | UBE2Z | P16T-E | Human | Esophagus | ESCC | 2.47e-16 | 2.20e-01 | 0.1153 |
| Page: 1 2 3 4 5 6 |
| Tissue | Expression Dynamics | Abbreviation |
| Esophagus |  | ESCC: Esophageal squamous cell carcinoma |
| HGIN: High-grade intraepithelial neoplasias | ||
| LGIN: Low-grade intraepithelial neoplasias | ||
| Liver | 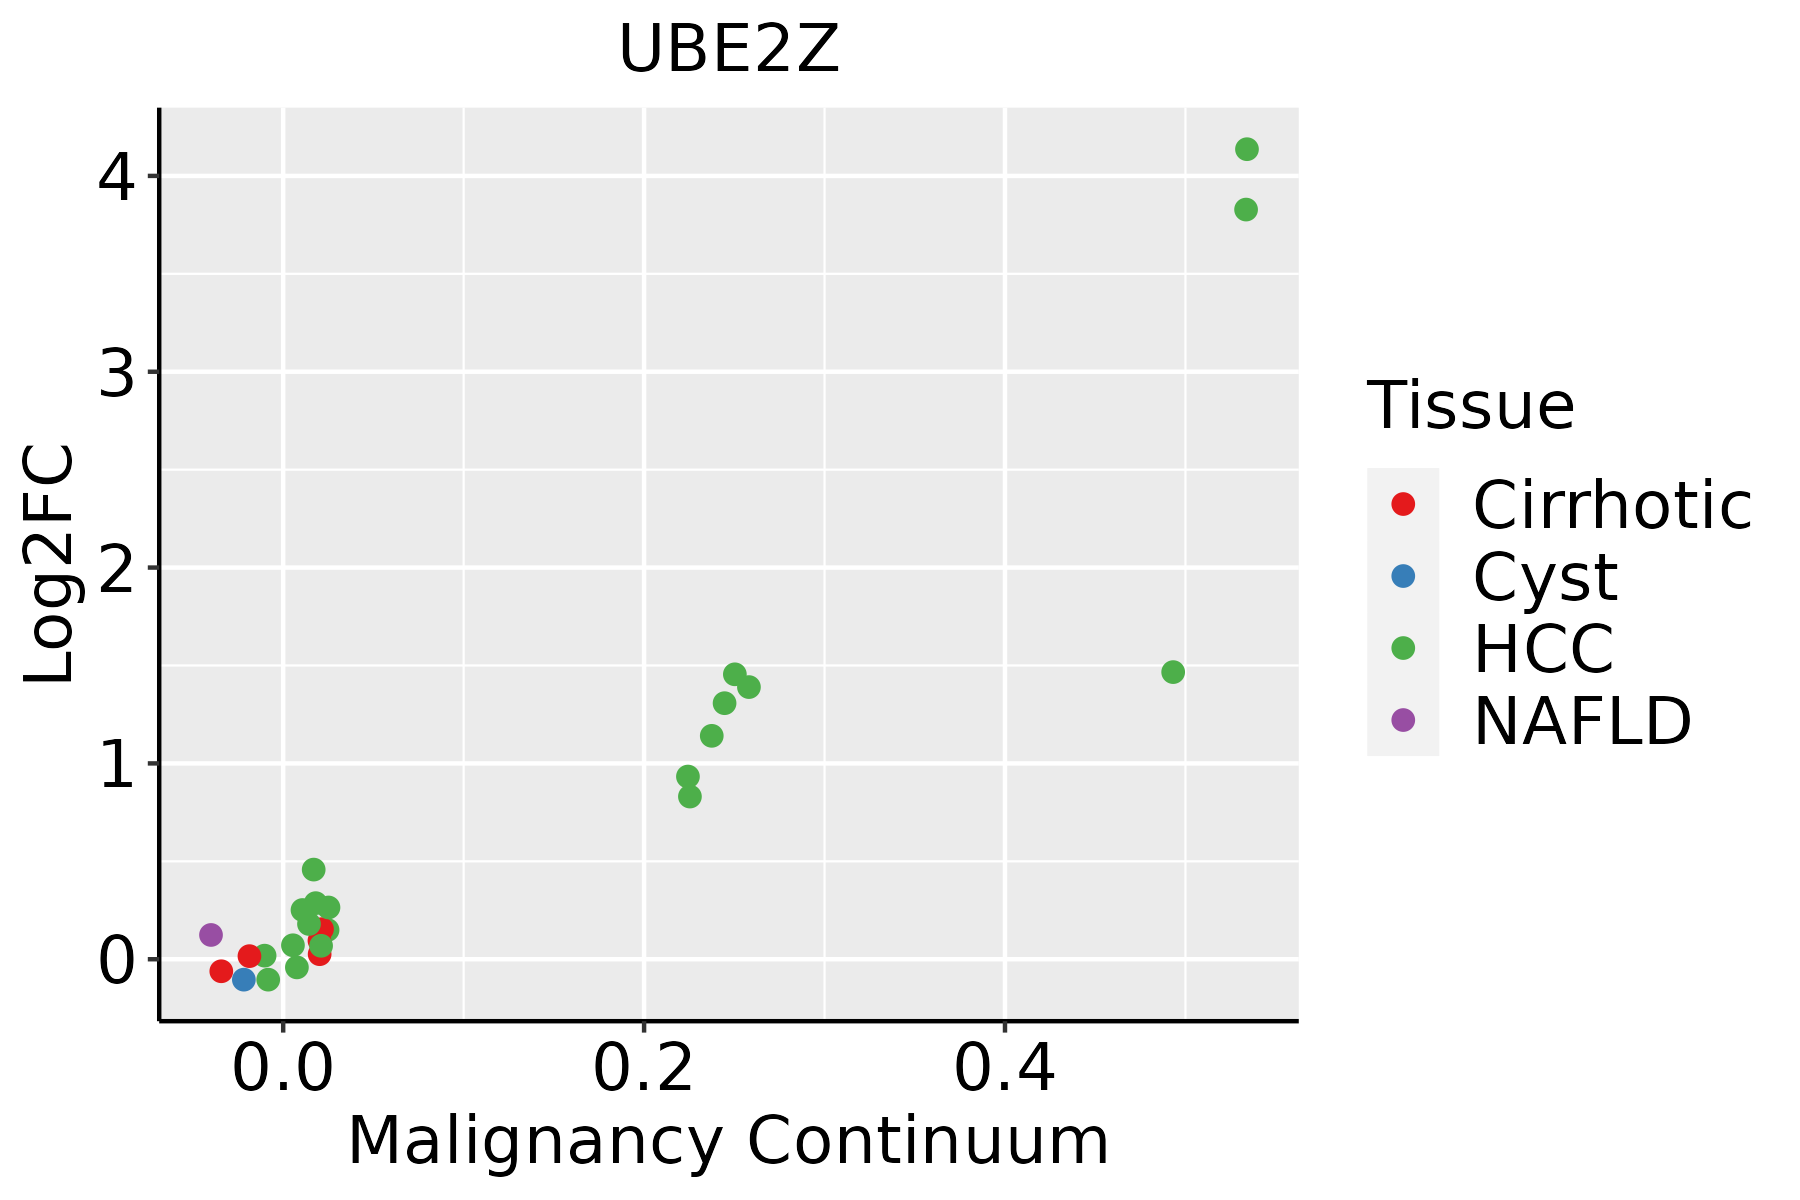 | HCC: Hepatocellular carcinoma |
| NAFLD: Non-alcoholic fatty liver disease | ||
| Oral Cavity | 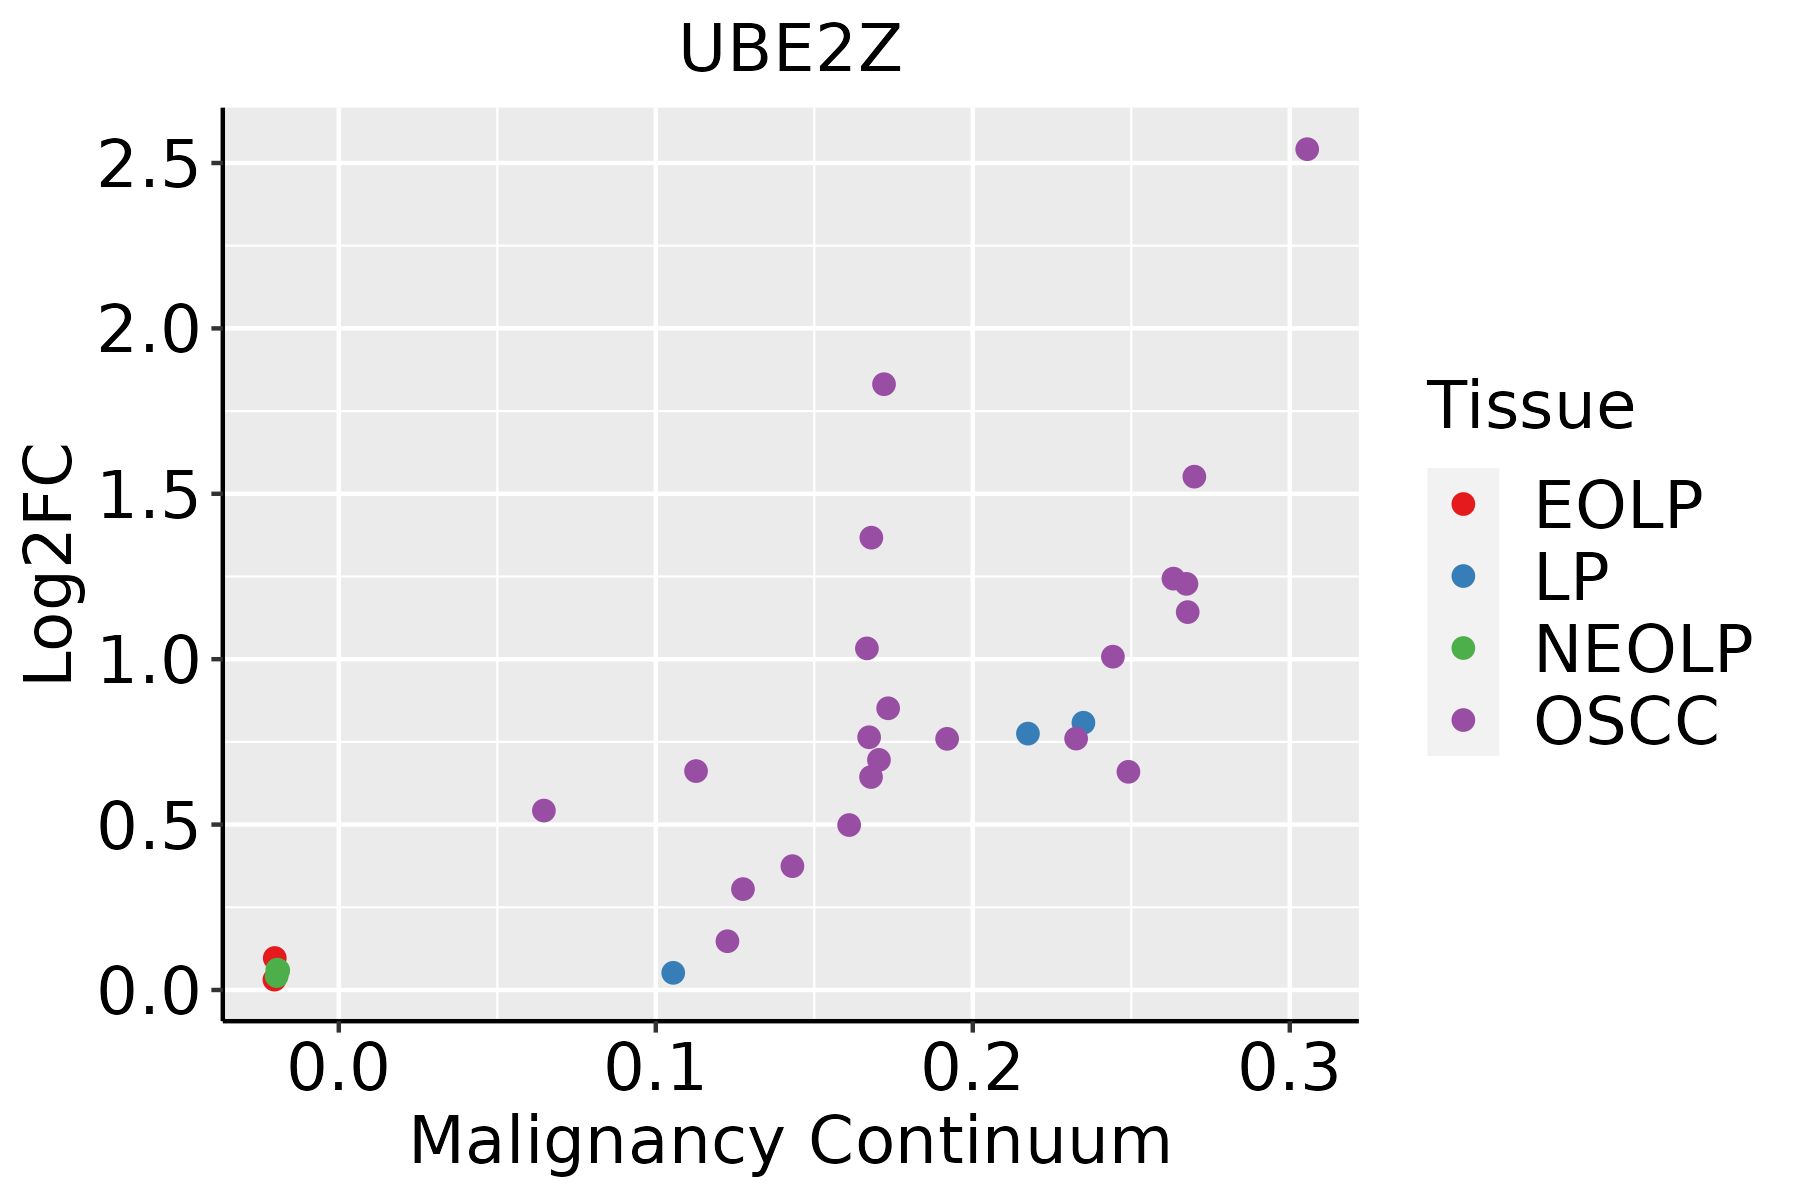 | EOLP: Erosive Oral lichen planus |
| LP: leukoplakia | ||
| NEOLP: Non-erosive oral lichen planus | ||
| OSCC: Oral squamous cell carcinoma | ||
| Skin | 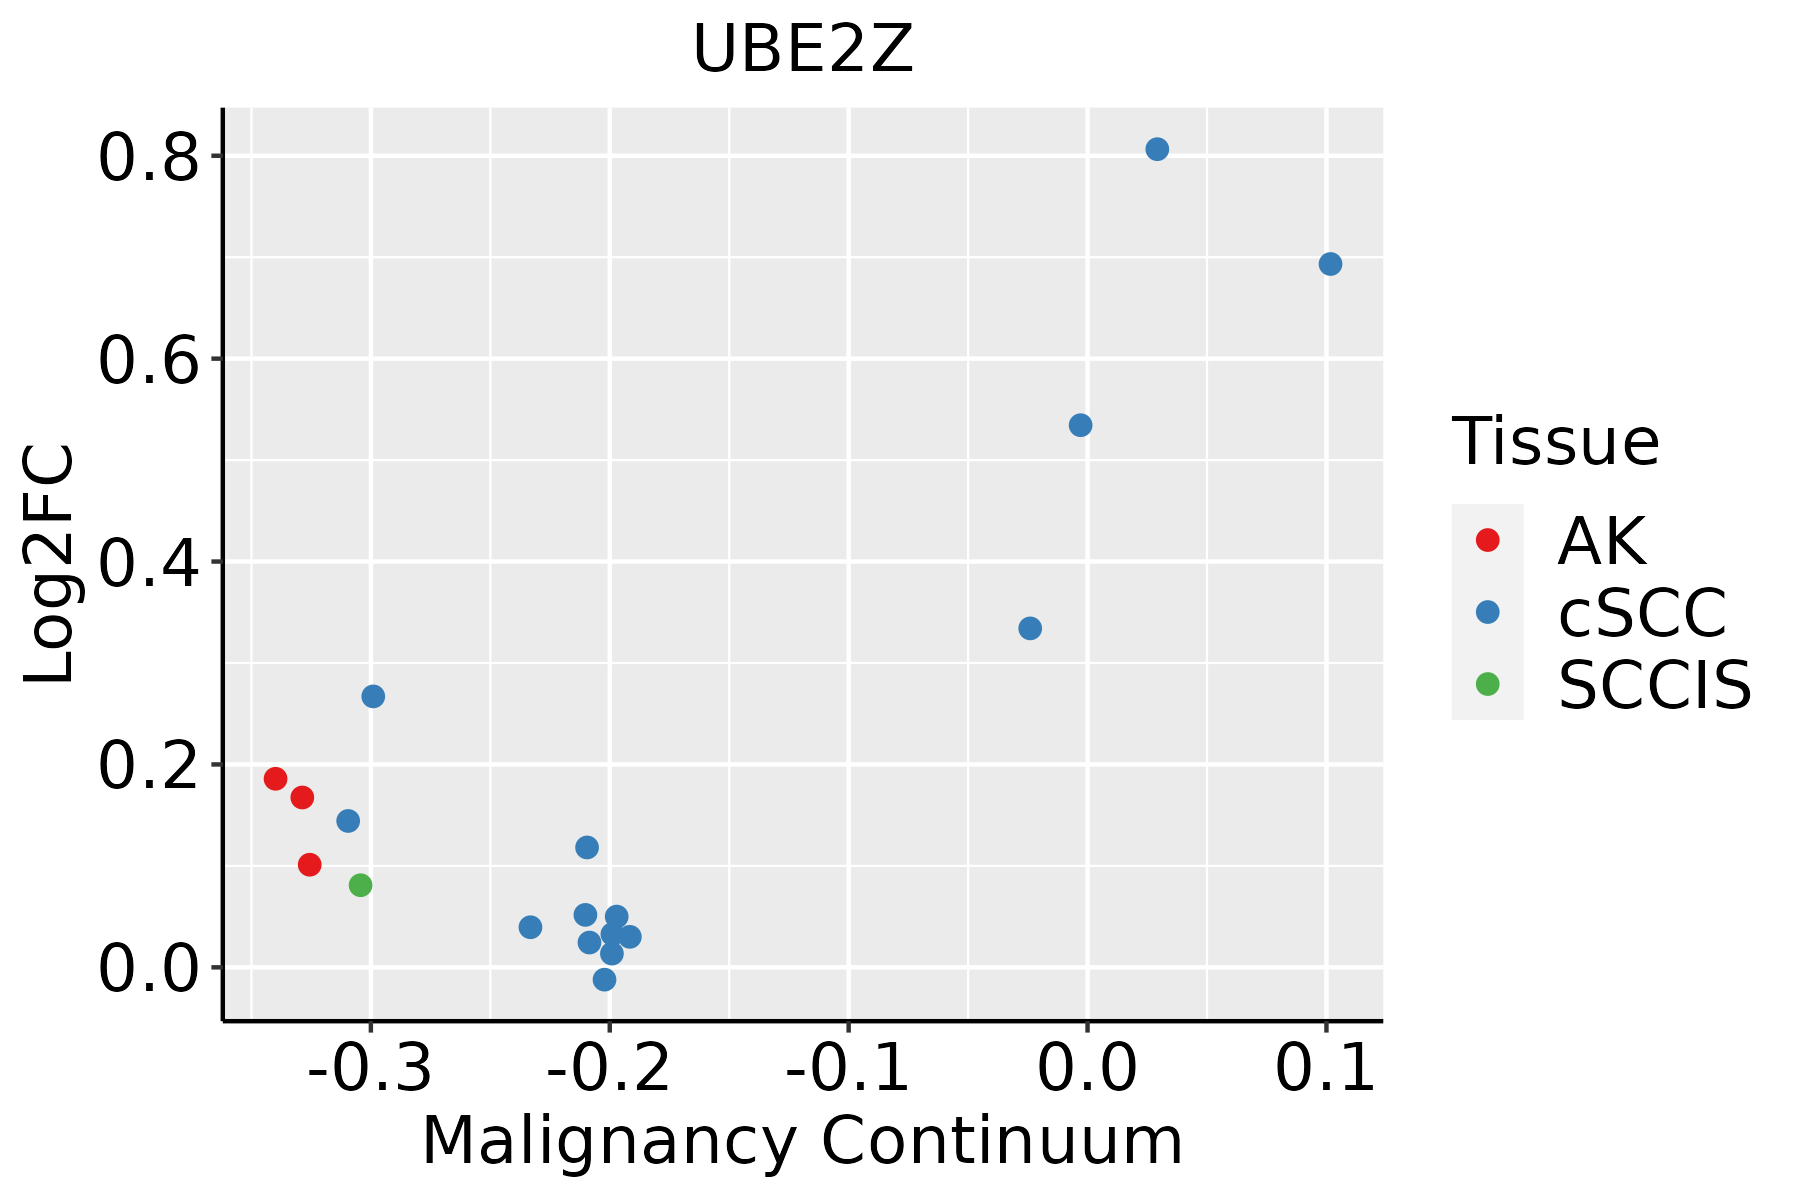 | AK: Actinic keratosis |
| cSCC: Cutaneous squamous cell carcinoma | ||
| SCCIS:squamous cell carcinoma in situ | ||
| Thyroid | 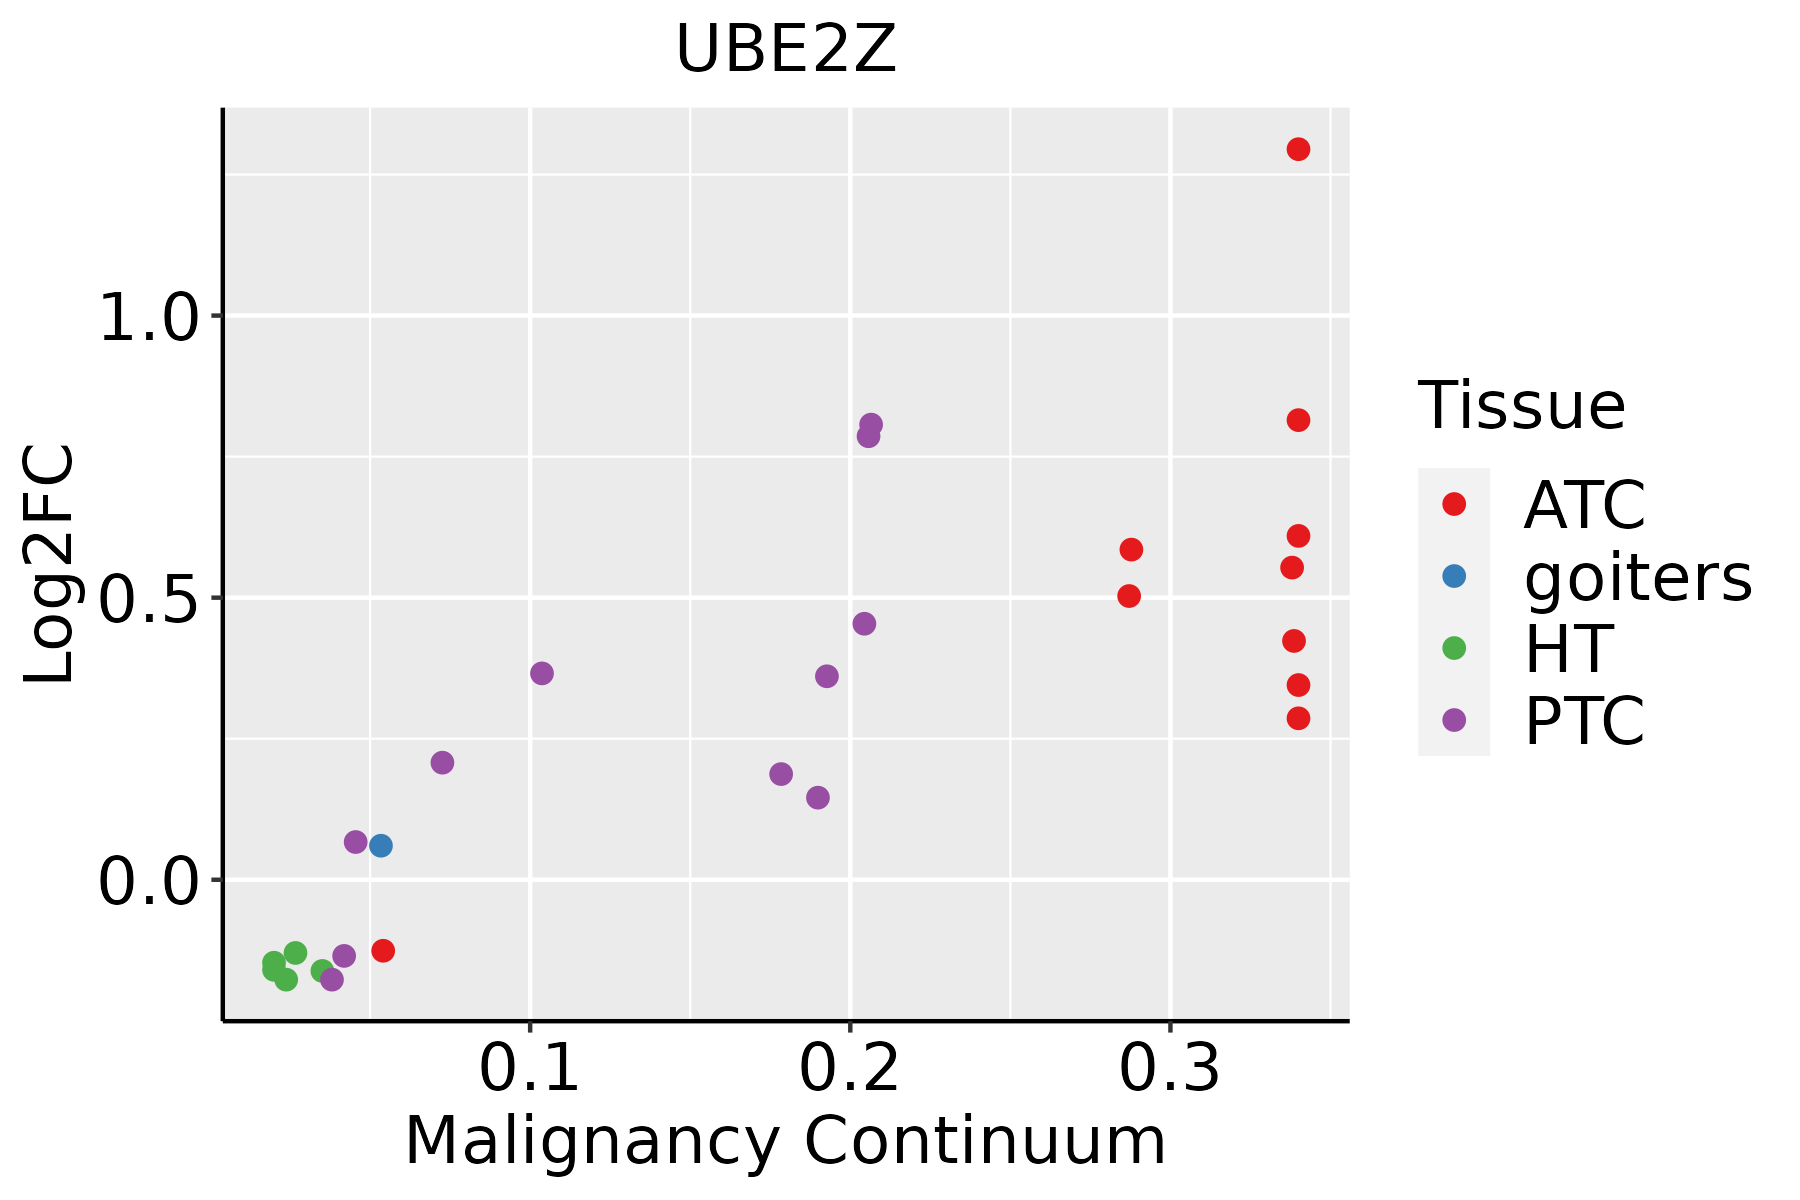 | ATC: Anaplastic thyroid cancer |
| HT: Hashimoto's thyroiditis | ||
| PTC: Papillary thyroid cancer |
| ∗log2FC in expression of this searched gene in stem-like cells from each diseased tissue sample relative to stem-like cells in normal samples in each tissue plotted against the malignancy continuum. Samples are colored based on if they are from different disease stage. |
Top |
Malignant transformation related pathway analysis |
| Find out the enriched GO biological processes and KEGG pathways involved in transition from healthy to precancer to cancer |
| Tissue | Disease Stage | Enriched GO biological Processes |
| Colorectum | AD |  |
| Colorectum | SER |  |
| Colorectum | MSS |  |
| Colorectum | MSI-H |  |
| Colorectum | FAP |  |
| ∗Top 15 enriched GO BP terms are showed in the bar plot of each disease state in each tissue. Each row represents a significant GO biological process which is colored according to the -log10(p.adjust). |
| Page: 1 2 3 4 5 6 7 8 9 |
| GO ID | Tissue | Disease Stage | Description | Gene Ratio | Bg Ratio | pvalue | p.adjust | Count |
| GO:0052547111 | Esophagus | ESCC | regulation of peptidase activity | 275/8552 | 461/18723 | 7.54e-10 | 1.88e-08 | 275 |
| GO:0052548111 | Esophagus | ESCC | regulation of endopeptidase activity | 253/8552 | 432/18723 | 3.68e-08 | 6.78e-07 | 253 |
| GO:0045861111 | Esophagus | ESCC | negative regulation of proteolysis | 195/8552 | 351/18723 | 1.13e-04 | 7.85e-04 | 195 |
| GO:0051346110 | Esophagus | ESCC | negative regulation of hydrolase activity | 208/8552 | 379/18723 | 1.76e-04 | 1.14e-03 | 208 |
| GO:001046620 | Esophagus | ESCC | negative regulation of peptidase activity | 140/8552 | 262/18723 | 6.73e-03 | 2.46e-02 | 140 |
| GO:001095119 | Esophagus | ESCC | negative regulation of endopeptidase activity | 135/8552 | 252/18723 | 6.86e-03 | 2.51e-02 | 135 |
| GO:005254712 | Liver | Cirrhotic | regulation of peptidase activity | 185/4634 | 461/18723 | 1.32e-13 | 1.09e-11 | 185 |
| GO:005254812 | Liver | Cirrhotic | regulation of endopeptidase activity | 172/4634 | 432/18723 | 2.12e-12 | 1.58e-10 | 172 |
| GO:004586112 | Liver | Cirrhotic | negative regulation of proteolysis | 136/4634 | 351/18723 | 3.46e-09 | 1.42e-07 | 136 |
| GO:005134612 | Liver | Cirrhotic | negative regulation of hydrolase activity | 139/4634 | 379/18723 | 1.24e-07 | 3.42e-06 | 139 |
| GO:001095111 | Liver | Cirrhotic | negative regulation of endopeptidase activity | 98/4634 | 252/18723 | 4.19e-07 | 9.77e-06 | 98 |
| GO:001046612 | Liver | Cirrhotic | negative regulation of peptidase activity | 100/4634 | 262/18723 | 8.90e-07 | 1.84e-05 | 100 |
| GO:005254722 | Liver | HCC | regulation of peptidase activity | 247/7958 | 461/18723 | 8.28e-07 | 1.27e-05 | 247 |
| GO:005254822 | Liver | HCC | regulation of endopeptidase activity | 230/7958 | 432/18723 | 3.58e-06 | 4.68e-05 | 230 |
| GO:004586122 | Liver | HCC | negative regulation of proteolysis | 186/7958 | 351/18723 | 4.19e-05 | 4.11e-04 | 186 |
| GO:005134622 | Liver | HCC | negative regulation of hydrolase activity | 195/7958 | 379/18723 | 2.44e-04 | 1.82e-03 | 195 |
| GO:001095121 | Liver | HCC | negative regulation of endopeptidase activity | 129/7958 | 252/18723 | 3.17e-03 | 1.47e-02 | 129 |
| GO:001046621 | Liver | HCC | negative regulation of peptidase activity | 132/7958 | 262/18723 | 5.82e-03 | 2.42e-02 | 132 |
| GO:005254720 | Oral cavity | OSCC | regulation of peptidase activity | 255/7305 | 461/18723 | 5.78e-13 | 2.75e-11 | 255 |
| GO:005254820 | Oral cavity | OSCC | regulation of endopeptidase activity | 235/7305 | 432/18723 | 4.35e-11 | 1.40e-09 | 235 |
| Page: 1 2 3 |
| Pathway ID | Tissue | Disease Stage | Description | Gene Ratio | Bg Ratio | pvalue | p.adjust | qvalue | Count |
| hsa0412027 | Esophagus | ESCC | Ubiquitin mediated proteolysis | 122/4205 | 142/8465 | 6.53e-20 | 7.29e-18 | 3.74e-18 | 122 |
| hsa0412036 | Esophagus | ESCC | Ubiquitin mediated proteolysis | 122/4205 | 142/8465 | 6.53e-20 | 7.29e-18 | 3.74e-18 | 122 |
| hsa0412021 | Liver | Cirrhotic | Ubiquitin mediated proteolysis | 72/2530 | 142/8465 | 1.32e-07 | 1.97e-06 | 1.21e-06 | 72 |
| hsa0412031 | Liver | Cirrhotic | Ubiquitin mediated proteolysis | 72/2530 | 142/8465 | 1.32e-07 | 1.97e-06 | 1.21e-06 | 72 |
| hsa0412041 | Liver | HCC | Ubiquitin mediated proteolysis | 110/4020 | 142/8465 | 1.67e-13 | 3.74e-12 | 2.08e-12 | 110 |
| hsa0412051 | Liver | HCC | Ubiquitin mediated proteolysis | 110/4020 | 142/8465 | 1.67e-13 | 3.74e-12 | 2.08e-12 | 110 |
| hsa0412020 | Oral cavity | OSCC | Ubiquitin mediated proteolysis | 105/3704 | 142/8465 | 1.83e-13 | 4.37e-12 | 2.23e-12 | 105 |
| hsa04120110 | Oral cavity | OSCC | Ubiquitin mediated proteolysis | 105/3704 | 142/8465 | 1.83e-13 | 4.37e-12 | 2.23e-12 | 105 |
| Page: 1 |
Top |
Cell-cell communication analysis |
| Identification of potential cell-cell interactions between two cell types and their ligand-receptor pairs for different disease states |
| Ligand | Receptor | LRpair | Pathway | Tissue | Disease Stage |
| Page: 1 |
Top |
Single-cell gene regulatory network inference analysis |
| Find out the significant the regulons (TFs) and the target genes of each regulon across cell types for different disease states |
| TF | Cell Type | Tissue | Disease Stage | Target Gene | RSS | Regulon Activity |
| ∗The dot plots of a searched regulon are shown for all cell subpopulations in each disease state of each tissue based on the regulon specific score inferred using pySCENIC and by calculating the average expression. |
| Page: 1 |
Top |
Somatic mutation of malignant transformation related genes |
| Annotation of somatic variants for genes involved in malignant transformation |
| Hugo Symbol | Variant Class | Variant Classification | dbSNP RS | HGVSc | HGVSp | HGVSp Short | SWISSPROT | BIOTYPE | SIFT | PolyPhen | Tumor Sample Barcode | Tissue | Histology | Sex | Age | Stage | Therapy Types | Drugs | Outcome |
| UBE2Z | SNV | Missense_Mutation | novel | c.657N>C | p.Glu219Asp | p.E219D | Q9H832 | protein_coding | tolerated(0.1) | benign(0.147) | TCGA-3C-AALI-01 | Breast | breast invasive carcinoma | Female | <65 | I/II | Unspecific | Poly E | Complete Response |
| UBE2Z | SNV | Missense_Mutation | novel | c.457N>T | p.Arg153Trp | p.R153W | Q9H832 | protein_coding | deleterious(0.01) | benign(0.189) | TCGA-AN-A046-01 | Breast | breast invasive carcinoma | Female | >=65 | I/II | Unknown | Unknown | SD |
| UBE2Z | SNV | Missense_Mutation | c.382N>G | p.Met128Val | p.M128V | Q9H832 | protein_coding | tolerated(0.58) | benign(0.115) | TCGA-AO-A0JG-01 | Breast | breast invasive carcinoma | Female | <65 | III/IV | Chemotherapy | doxorubicin | SD | |
| UBE2Z | SNV | Missense_Mutation | novel | c.362N>C | p.Val121Ala | p.V121A | Q9H832 | protein_coding | deleterious(0.03) | possibly_damaging(0.842) | TCGA-2W-A8YY-01 | Cervix | cervical & endocervical cancer | Female | <65 | I/II | Chemotherapy | cisplatin | CR |
| UBE2Z | SNV | Missense_Mutation | novel | c.697N>T | p.His233Tyr | p.H233Y | Q9H832 | protein_coding | tolerated(0.38) | benign(0.099) | TCGA-DS-A5RQ-01 | Cervix | cervical & endocervical cancer | Female | >=65 | I/II | Chemotherapy | cisplatin | CR |
| UBE2Z | SNV | Missense_Mutation | novel | c.717N>A | p.Asn239Lys | p.N239K | Q9H832 | protein_coding | tolerated(0.11) | benign(0.05) | TCGA-A5-A0G2-01 | Endometrium | uterine corpus endometrioid carcinoma | Female | <65 | III/IV | Unknown | Unknown | SD |
| UBE2Z | SNV | Missense_Mutation | c.538N>G | p.Asn180Asp | p.N180D | Q9H832 | protein_coding | deleterious(0) | probably_damaging(1) | TCGA-AP-A056-01 | Endometrium | uterine corpus endometrioid carcinoma | Female | <65 | I/II | Unknown | Unknown | SD | |
| UBE2Z | SNV | Missense_Mutation | novel | c.521N>T | p.Thr174Ile | p.T174I | Q9H832 | protein_coding | tolerated(0.06) | possibly_damaging(0.593) | TCGA-AP-A059-01 | Endometrium | uterine corpus endometrioid carcinoma | Female | >=65 | I/II | Unknown | Unknown | SD |
| UBE2Z | SNV | Missense_Mutation | c.993N>T | p.Glu331Asp | p.E331D | Q9H832 | protein_coding | tolerated(0.15) | benign(0.011) | TCGA-AX-A05Z-01 | Endometrium | uterine corpus endometrioid carcinoma | Female | <65 | III/IV | Chemotherapy | adriamycin | SD | |
| UBE2Z | SNV | Missense_Mutation | novel | c.986A>C | p.His329Pro | p.H329P | Q9H832 | protein_coding | tolerated(0.06) | benign(0) | TCGA-AX-A06F-01 | Endometrium | uterine corpus endometrioid carcinoma | Female | <65 | III/IV | Chemotherapy | carboplatin | SD |
| Page: 1 2 3 |
Top |
Related drugs of malignant transformation related genes |
| Identification of chemicals and drugs interact with genes involved in malignant transfromation |
| (DGIdb 4.0) |
| Entrez ID | Symbol | Category | Interaction Types | Drug Claim Name | Drug Name | PMIDs |
| Page: 1 |

Copyright 2023-Present -The University of Texas Health Science Center at Houston |