| Tissue | Expression Dynamics | Abbreviation |
| Esophagus |  | ESCC: Esophageal squamous cell carcinoma |
| HGIN: High-grade intraepithelial neoplasias |
| LGIN: Low-grade intraepithelial neoplasias |
| Liver | 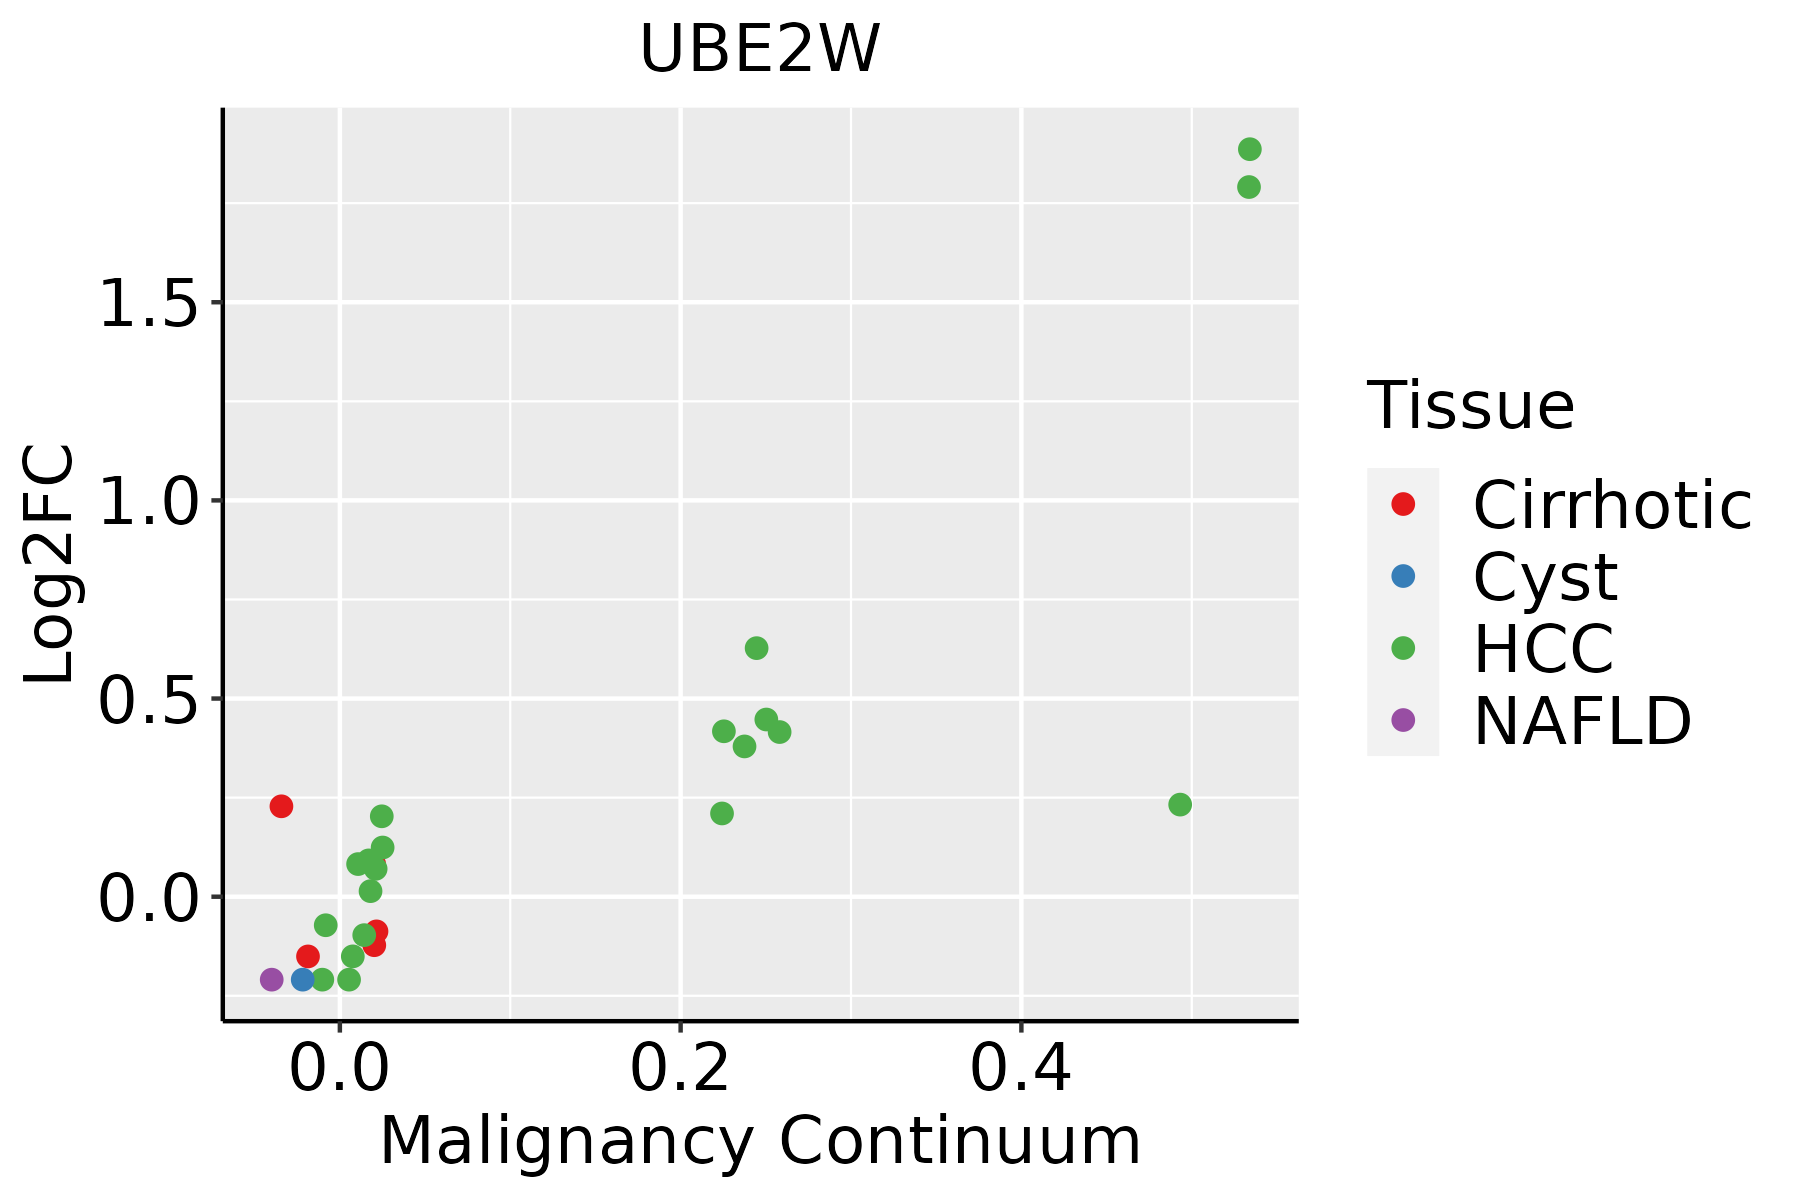 | HCC: Hepatocellular carcinoma |
| NAFLD: Non-alcoholic fatty liver disease |
| Lung | 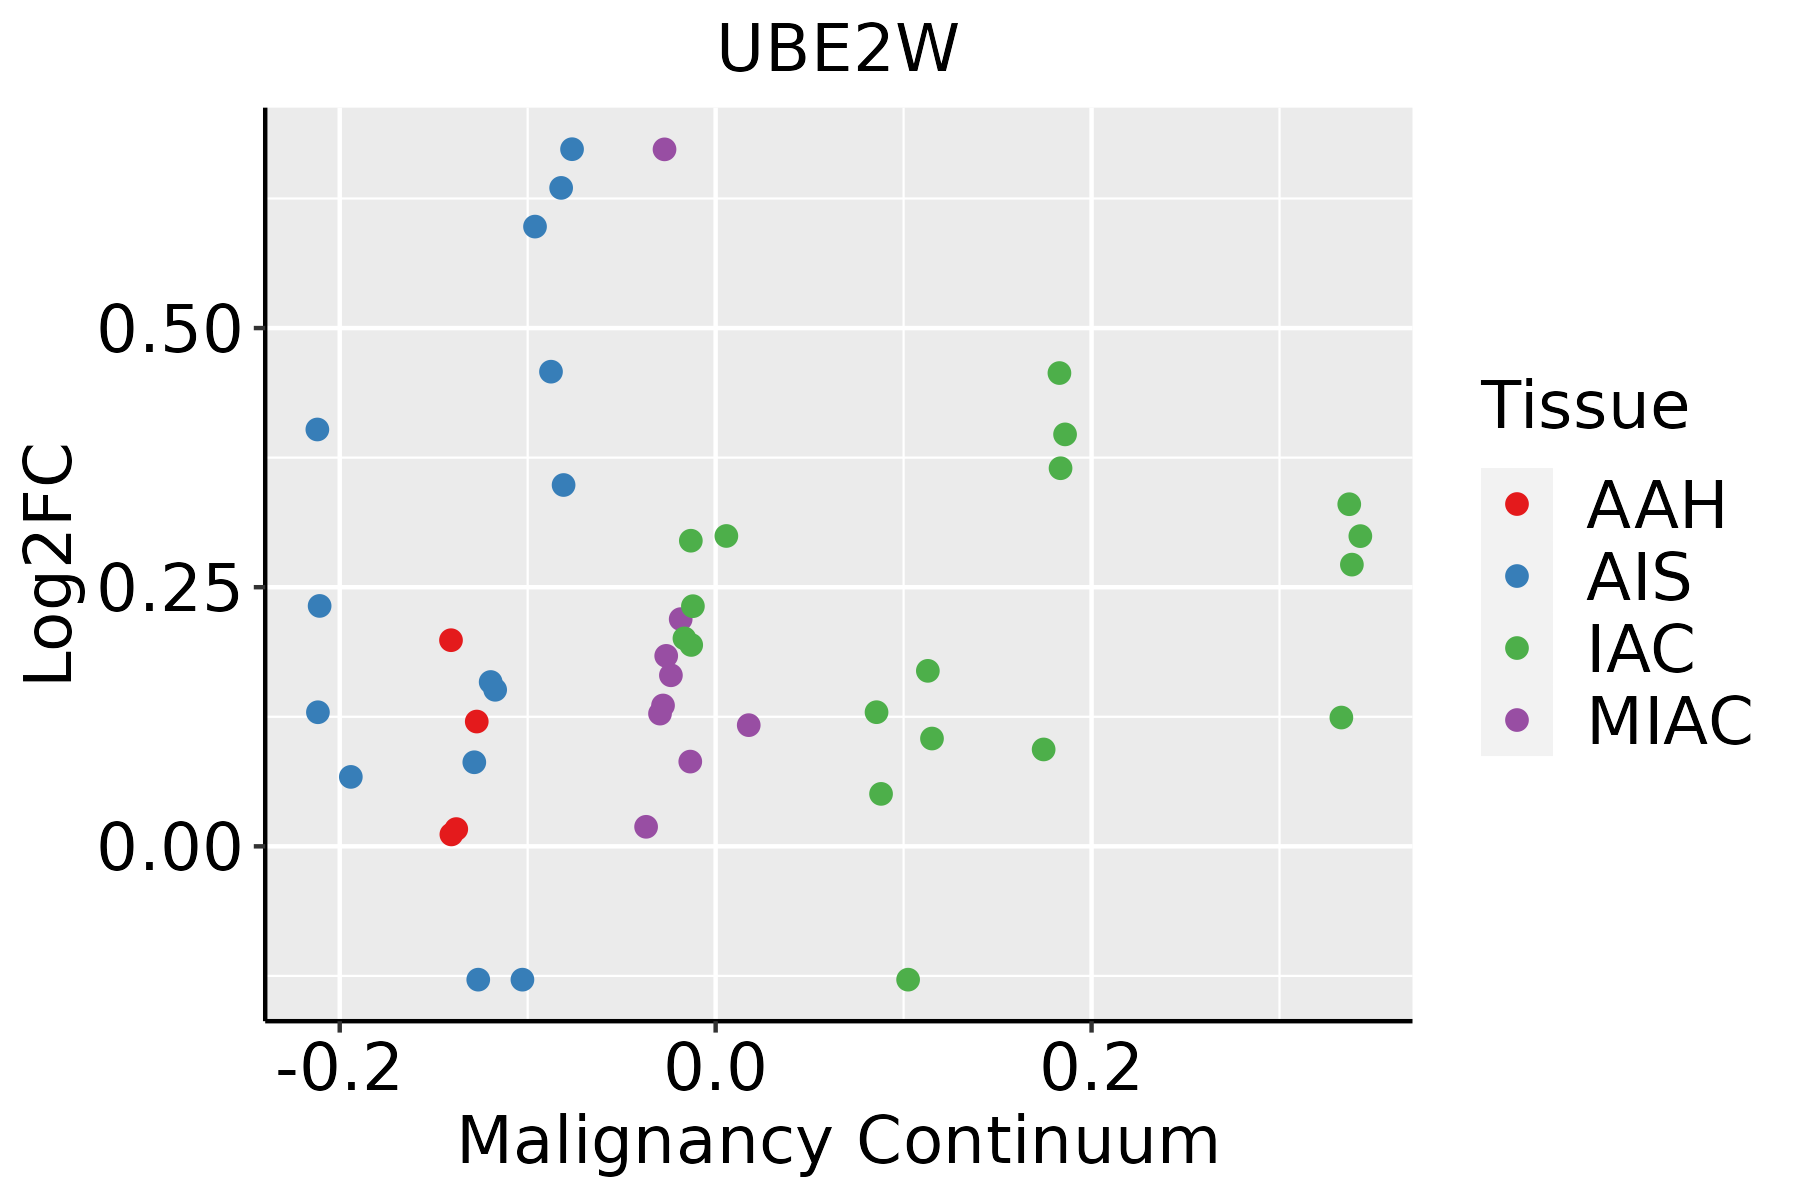 | AAH: Atypical adenomatous hyperplasia |
| AIS: Adenocarcinoma in situ |
| IAC: Invasive lung adenocarcinoma |
| MIA: Minimally invasive adenocarcinoma |
| Oral Cavity | 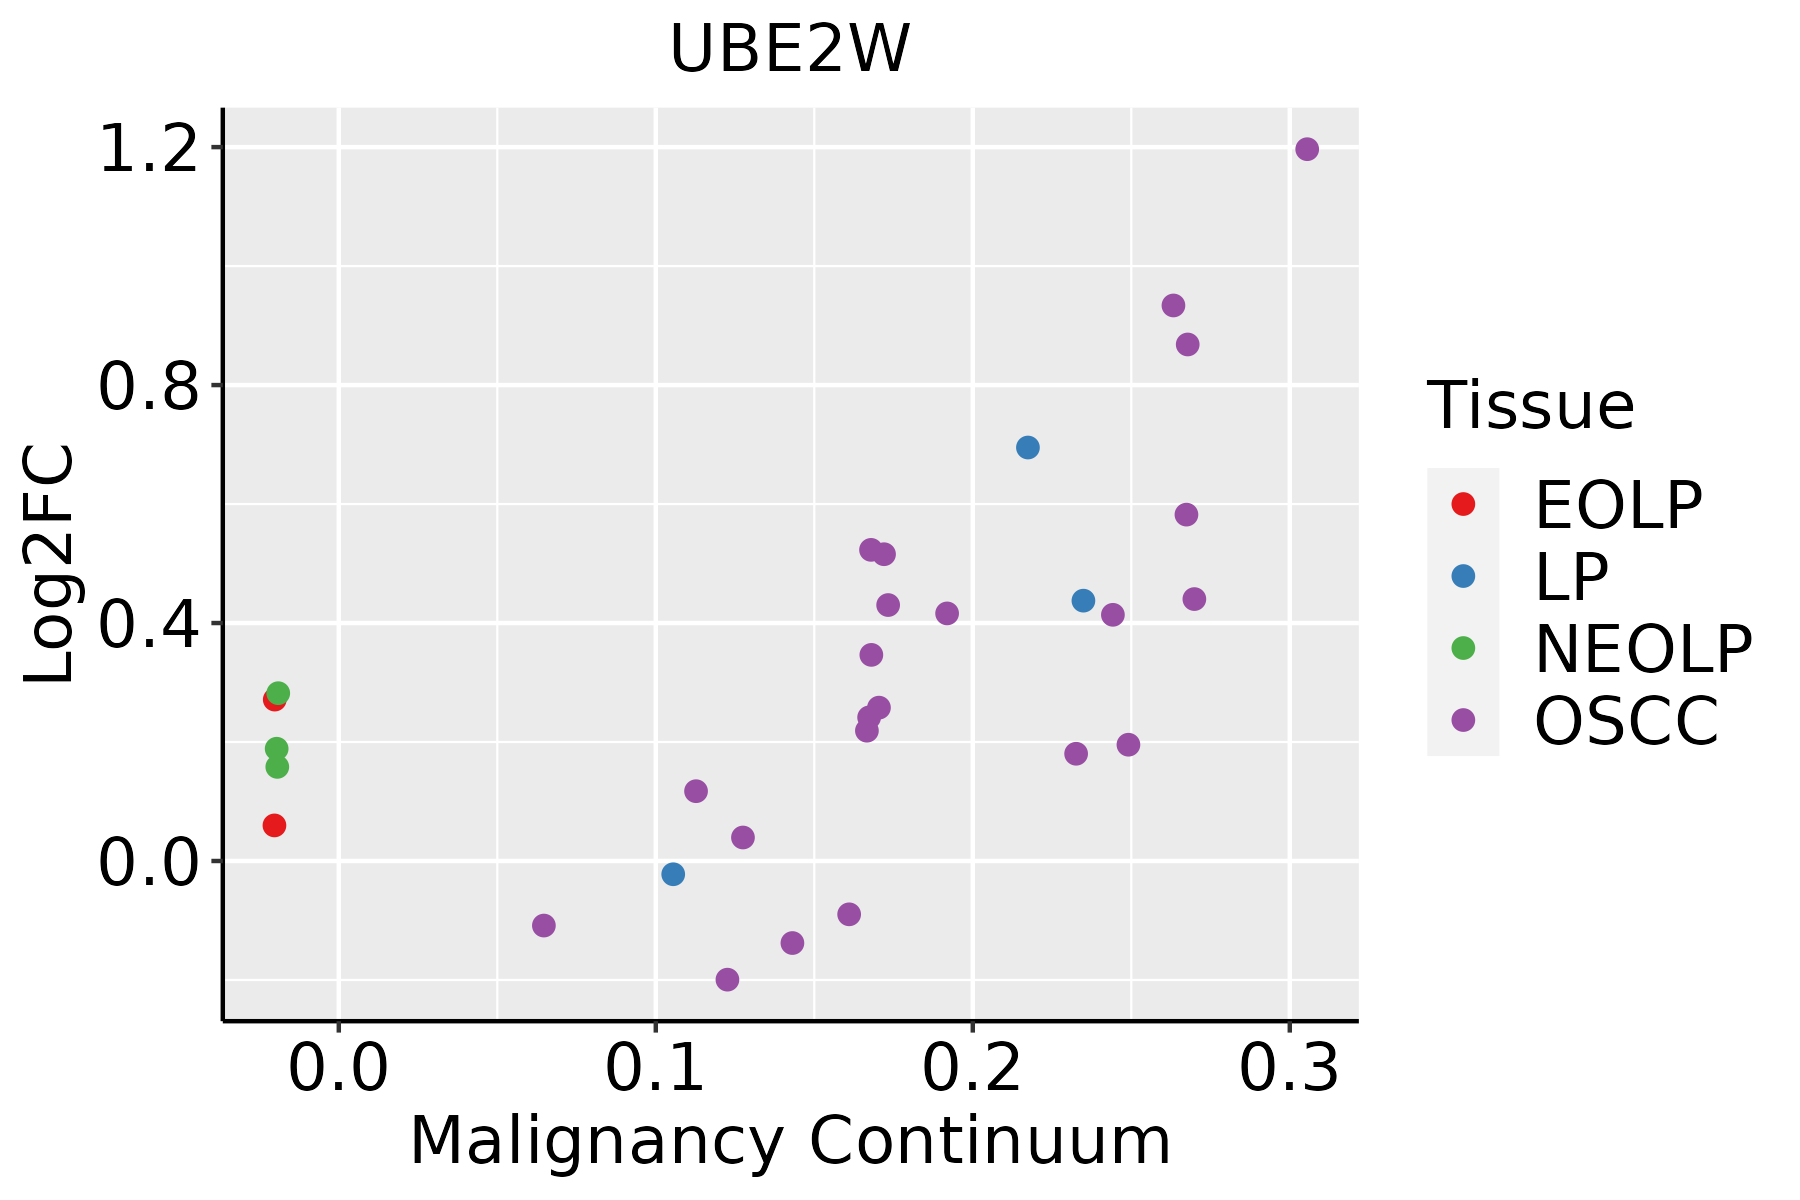 | EOLP: Erosive Oral lichen planus |
| LP: leukoplakia |
| NEOLP: Non-erosive oral lichen planus |
| OSCC: Oral squamous cell carcinoma |
| GO ID | Tissue | Disease Stage | Description | Gene Ratio | Bg Ratio | pvalue | p.adjust | Count |
| GO:0010498111 | Esophagus | ESCC | proteasomal protein catabolic process | 369/8552 | 490/18723 | 1.13e-41 | 1.80e-38 | 369 |
| GO:0043161111 | Esophagus | ESCC | proteasome-mediated ubiquitin-dependent protein catabolic process | 312/8552 | 412/18723 | 3.53e-36 | 4.48e-33 | 312 |
| GO:0035966111 | Esophagus | ESCC | response to topologically incorrect protein | 125/8552 | 159/18723 | 1.44e-17 | 1.27e-15 | 125 |
| GO:000020917 | Esophagus | ESCC | protein polyubiquitination | 170/8552 | 236/18723 | 1.40e-16 | 1.09e-14 | 170 |
| GO:0035967111 | Esophagus | ESCC | cellular response to topologically incorrect protein | 90/8552 | 116/18723 | 1.94e-12 | 8.11e-11 | 90 |
| GO:00065136 | Esophagus | ESCC | protein monoubiquitination | 53/8552 | 67/18723 | 2.11e-08 | 4.03e-07 | 53 |
| GO:007097912 | Esophagus | ESCC | protein K11-linked ubiquitination | 27/8552 | 29/18723 | 8.09e-08 | 1.39e-06 | 27 |
| GO:00517884 | Esophagus | ESCC | response to misfolded protein | 21/8552 | 25/18723 | 9.12e-05 | 6.54e-04 | 21 |
| GO:00712184 | Esophagus | ESCC | cellular response to misfolded protein | 19/8552 | 23/18723 | 3.12e-04 | 1.85e-03 | 19 |
| GO:00065154 | Esophagus | ESCC | protein quality control for misfolded or incompletely synthesized proteins | 21/8552 | 28/18723 | 1.57e-03 | 7.33e-03 | 21 |
| GO:001049812 | Liver | Cirrhotic | proteasomal protein catabolic process | 216/4634 | 490/18723 | 2.52e-21 | 9.29e-19 | 216 |
| GO:004316112 | Liver | Cirrhotic | proteasome-mediated ubiquitin-dependent protein catabolic process | 184/4634 | 412/18723 | 4.52e-19 | 8.85e-17 | 184 |
| GO:00359667 | Liver | Cirrhotic | response to topologically incorrect protein | 91/4634 | 159/18723 | 2.07e-18 | 3.60e-16 | 91 |
| GO:00359677 | Liver | Cirrhotic | cellular response to topologically incorrect protein | 64/4634 | 116/18723 | 2.20e-12 | 1.62e-10 | 64 |
| GO:000020911 | Liver | Cirrhotic | protein polyubiquitination | 89/4634 | 236/18723 | 6.09e-06 | 9.80e-05 | 89 |
| GO:000651511 | Liver | Cirrhotic | protein quality control for misfolded or incompletely synthesized proteins | 16/4634 | 28/18723 | 2.53e-04 | 2.27e-03 | 16 |
| GO:0070979 | Liver | Cirrhotic | protein K11-linked ubiquitination | 16/4634 | 29/18723 | 4.36e-04 | 3.55e-03 | 16 |
| GO:00517881 | Liver | Cirrhotic | response to misfolded protein | 14/4634 | 25/18723 | 8.15e-04 | 5.95e-03 | 14 |
| GO:00712182 | Liver | Cirrhotic | cellular response to misfolded protein | 12/4634 | 23/18723 | 4.23e-03 | 2.24e-02 | 12 |
| GO:00065133 | Liver | Cirrhotic | protein monoubiquitination | 26/4634 | 67/18723 | 7.53e-03 | 3.57e-02 | 26 |
| Pathway ID | Tissue | Disease Stage | Description | Gene Ratio | Bg Ratio | pvalue | p.adjust | qvalue | Count |
| hsa0412027 | Esophagus | ESCC | Ubiquitin mediated proteolysis | 122/4205 | 142/8465 | 6.53e-20 | 7.29e-18 | 3.74e-18 | 122 |
| hsa0412036 | Esophagus | ESCC | Ubiquitin mediated proteolysis | 122/4205 | 142/8465 | 6.53e-20 | 7.29e-18 | 3.74e-18 | 122 |
| hsa0412021 | Liver | Cirrhotic | Ubiquitin mediated proteolysis | 72/2530 | 142/8465 | 1.32e-07 | 1.97e-06 | 1.21e-06 | 72 |
| hsa0412031 | Liver | Cirrhotic | Ubiquitin mediated proteolysis | 72/2530 | 142/8465 | 1.32e-07 | 1.97e-06 | 1.21e-06 | 72 |
| hsa0412041 | Liver | HCC | Ubiquitin mediated proteolysis | 110/4020 | 142/8465 | 1.67e-13 | 3.74e-12 | 2.08e-12 | 110 |
| hsa0412051 | Liver | HCC | Ubiquitin mediated proteolysis | 110/4020 | 142/8465 | 1.67e-13 | 3.74e-12 | 2.08e-12 | 110 |
| hsa0412020 | Oral cavity | OSCC | Ubiquitin mediated proteolysis | 105/3704 | 142/8465 | 1.83e-13 | 4.37e-12 | 2.23e-12 | 105 |
| hsa04120110 | Oral cavity | OSCC | Ubiquitin mediated proteolysis | 105/3704 | 142/8465 | 1.83e-13 | 4.37e-12 | 2.23e-12 | 105 |
| hsa0412043 | Oral cavity | EOLP | Ubiquitin mediated proteolysis | 48/1218 | 142/8465 | 3.55e-09 | 6.74e-08 | 3.98e-08 | 48 |
| hsa0412053 | Oral cavity | EOLP | Ubiquitin mediated proteolysis | 48/1218 | 142/8465 | 3.55e-09 | 6.74e-08 | 3.98e-08 | 48 |
| Hugo Symbol | Variant Class | Variant Classification | dbSNP RS | HGVSc | HGVSp | HGVSp Short | SWISSPROT | BIOTYPE | SIFT | PolyPhen | Tumor Sample Barcode | Tissue | Histology | Sex | Age | Stage | Therapy Types | Drugs | Outcome |
| UBE2W | SNV | Missense_Mutation | | c.491N>A | p.Arg164Gln | p.R164Q | | protein_coding | deleterious(0.03) | benign(0.111) | TCGA-A2-A1FV-01 | Breast | breast invasive carcinoma | Female | >=65 | I/II | Chemotherapy | cyclophosphamide | SD |
| UBE2W | SNV | Missense_Mutation | novel | c.28G>C | p.Ala10Pro | p.A10P | | protein_coding | tolerated_low_confidence(0.26) | benign(0.44) | TCGA-EX-A1H6-01 | Cervix | cervical & endocervical cancer | Female | <65 | I/II | Unknown | Unknown | SD |
| UBE2W | SNV | Missense_Mutation | novel | c.361C>T | p.His121Tyr | p.H121Y | | protein_coding | deleterious(0.04) | possibly_damaging(0.517) | TCGA-VS-A9UC-01 | Cervix | cervical & endocervical cancer | Female | <65 | I/II | Chemotherapy | cisplatin | SD |
| UBE2W | SNV | Missense_Mutation | rs775096274 | c.497C>T | p.Pro166Leu | p.P166L | | protein_coding | deleterious(0.03) | possibly_damaging(0.846) | TCGA-A6-6781-01 | Colorectum | colon adenocarcinoma | Male | <65 | III/IV | Chemotherapy | oxaliplatin | SD |
| UBE2W | SNV | Missense_Mutation | novel | c.216N>G | p.Asn72Lys | p.N72K | | protein_coding | tolerated(0.07) | benign(0.063) | TCGA-F5-6814-01 | Colorectum | rectum adenocarcinoma | Male | <65 | I/II | Unknown | Unknown | SD |
| UBE2W | SNV | Missense_Mutation | novel | c.227A>C | p.Gln76Pro | p.Q76P | | protein_coding | deleterious(0.03) | possibly_damaging(0.668) | TCGA-A5-A0G2-01 | Endometrium | uterine corpus endometrioid carcinoma | Female | <65 | III/IV | Unknown | Unknown | SD |
| UBE2W | SNV | Missense_Mutation | novel | c.206G>A | p.Ser69Asn | p.S69N | | protein_coding | tolerated(0.14) | benign(0.012) | TCGA-A5-A1OF-01 | Endometrium | uterine corpus endometrioid carcinoma | Female | <65 | I/II | Unknown | Unknown | SD |
| UBE2W | SNV | Missense_Mutation | novel | c.475T>C | p.Cys159Arg | p.C159R | | protein_coding | deleterious(0) | probably_damaging(0.913) | TCGA-A5-A2K5-01 | Endometrium | uterine corpus endometrioid carcinoma | Female | >=65 | I/II | Unknown | Unknown | SD |
| UBE2W | SNV | Missense_Mutation | | c.189N>T | p.Met63Ile | p.M63I | | protein_coding | tolerated(0.88) | benign(0.012) | TCGA-AP-A056-01 | Endometrium | uterine corpus endometrioid carcinoma | Female | <65 | I/II | Unknown | Unknown | SD |
| UBE2W | SNV | Missense_Mutation | | c.506N>A | p.Ser169Tyr | p.S169Y | | protein_coding | deleterious(0.01) | possibly_damaging(0.847) | TCGA-AX-A05Z-01 | Endometrium | uterine corpus endometrioid carcinoma | Female | <65 | III/IV | Chemotherapy | adriamycin | SD |


