
|
|||||
|
 | |
| |
| |
| |
| |
| |
|
Gene: UBE2T |
Gene summary for UBE2T |
| Gene information | Species | Human | Gene symbol | UBE2T | Gene ID | 29089 |
| Gene name | ubiquitin conjugating enzyme E2 T | |
| Gene Alias | FANCT | |
| Cytomap | 1q32.1 | |
| Gene Type | protein-coding | GO ID | GO:0000209 | UniProtAcc | Q9NPD8 |
Top |
Malignant transformation analysis |
| Identification of the aberrant gene expression in precancerous and cancerous lesions by comparing the gene expression of stem-like cells in diseased tissues with normal stem cells |
| Entrez ID | Symbol | Replicates | Species | Organ | Tissue | Adj P-value | Log2FC | Malignancy |
| 29089 | UBE2T | GSM4909281 | Human | Breast | IDC | 4.45e-10 | 3.19e-01 | 0.21 |
| 29089 | UBE2T | GSM4909282 | Human | Breast | IDC | 6.28e-37 | 7.50e-01 | -0.0288 |
| 29089 | UBE2T | GSM4909285 | Human | Breast | IDC | 3.84e-36 | 6.10e-01 | 0.21 |
| 29089 | UBE2T | GSM4909287 | Human | Breast | IDC | 2.32e-17 | 5.08e-01 | 0.2057 |
| 29089 | UBE2T | GSM4909290 | Human | Breast | IDC | 4.69e-02 | 2.26e-01 | 0.2096 |
| 29089 | UBE2T | GSM4909291 | Human | Breast | IDC | 1.61e-03 | 3.18e-01 | 0.1753 |
| 29089 | UBE2T | GSM4909293 | Human | Breast | IDC | 1.85e-08 | 2.11e-01 | 0.1581 |
| 29089 | UBE2T | GSM4909301 | Human | Breast | IDC | 4.09e-02 | 1.72e-01 | 0.1577 |
| 29089 | UBE2T | GSM4909304 | Human | Breast | IDC | 1.01e-03 | 2.03e-01 | 0.1636 |
| 29089 | UBE2T | GSM4909319 | Human | Breast | IDC | 2.05e-03 | 1.47e-01 | 0.1563 |
| 29089 | UBE2T | M2 | Human | Breast | IDC | 1.01e-03 | 5.23e-01 | 0.21 |
| 29089 | UBE2T | NCCBC5 | Human | Breast | DCIS | 3.28e-03 | 3.11e-01 | 0.2046 |
| 29089 | UBE2T | P2 | Human | Breast | IDC | 1.18e-06 | 4.37e-01 | 0.21 |
| 29089 | UBE2T | LZE2T | Human | Esophagus | ESCC | 1.52e-08 | 8.05e-01 | 0.082 |
| 29089 | UBE2T | LZE7T | Human | Esophagus | ESCC | 3.01e-10 | 6.74e-01 | 0.0667 |
| 29089 | UBE2T | LZE20T | Human | Esophagus | ESCC | 4.98e-02 | 1.07e-01 | 0.0662 |
| 29089 | UBE2T | LZE22T | Human | Esophagus | ESCC | 1.54e-04 | 5.96e-01 | 0.068 |
| 29089 | UBE2T | LZE24T | Human | Esophagus | ESCC | 2.54e-14 | 3.37e-01 | 0.0596 |
| 29089 | UBE2T | LZE6T | Human | Esophagus | ESCC | 1.16e-11 | 3.85e-01 | 0.0845 |
| 29089 | UBE2T | P1T-E | Human | Esophagus | ESCC | 1.64e-05 | 3.19e-01 | 0.0875 |
| Page: 1 2 3 4 5 6 |
| Tissue | Expression Dynamics | Abbreviation |
| Breast | 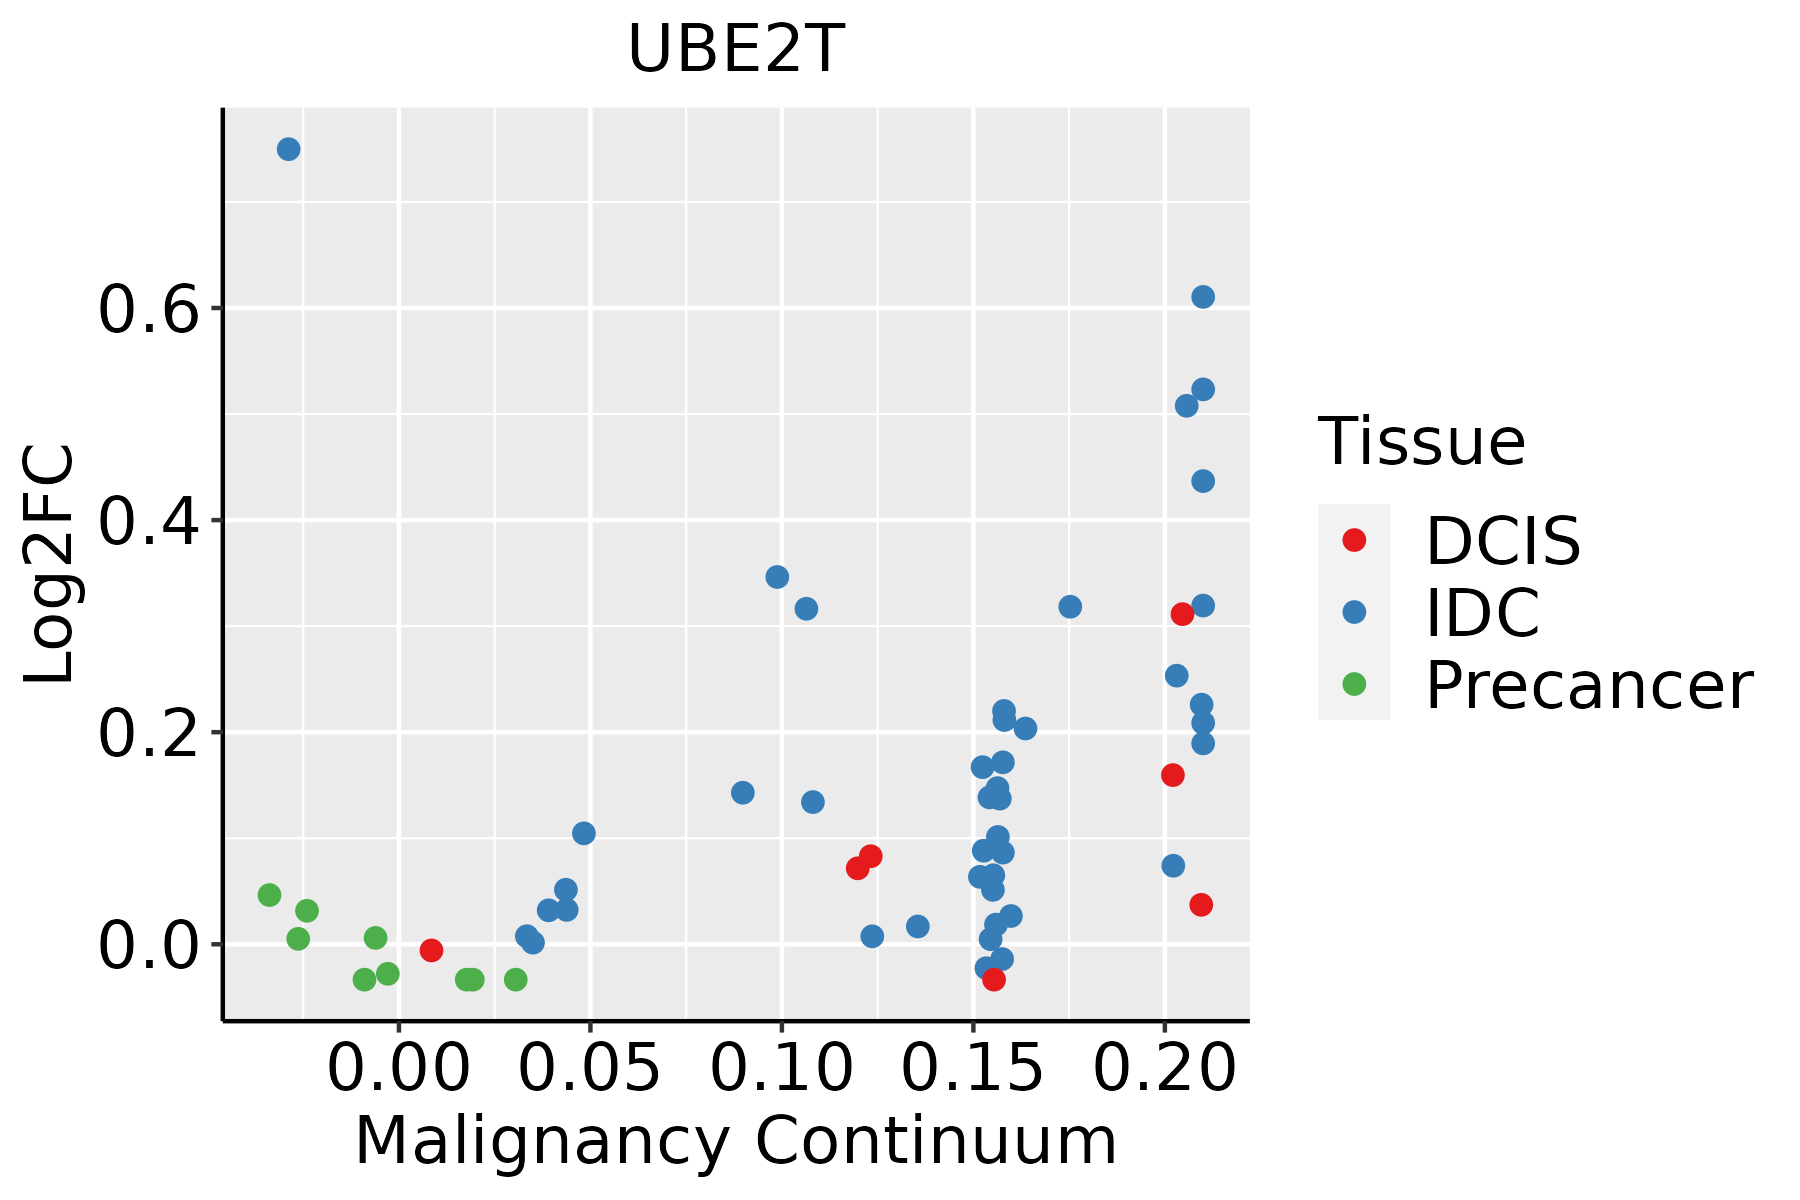 | IDC: Invasive ductal carcinoma |
| DCIS: Ductal carcinoma in situ | ||
| Precancer(BRCA1-mut): Precancerous lesion from BRCA1 mutation carriers | ||
| Esophagus |  | ESCC: Esophageal squamous cell carcinoma |
| HGIN: High-grade intraepithelial neoplasias | ||
| LGIN: Low-grade intraepithelial neoplasias | ||
| Liver | 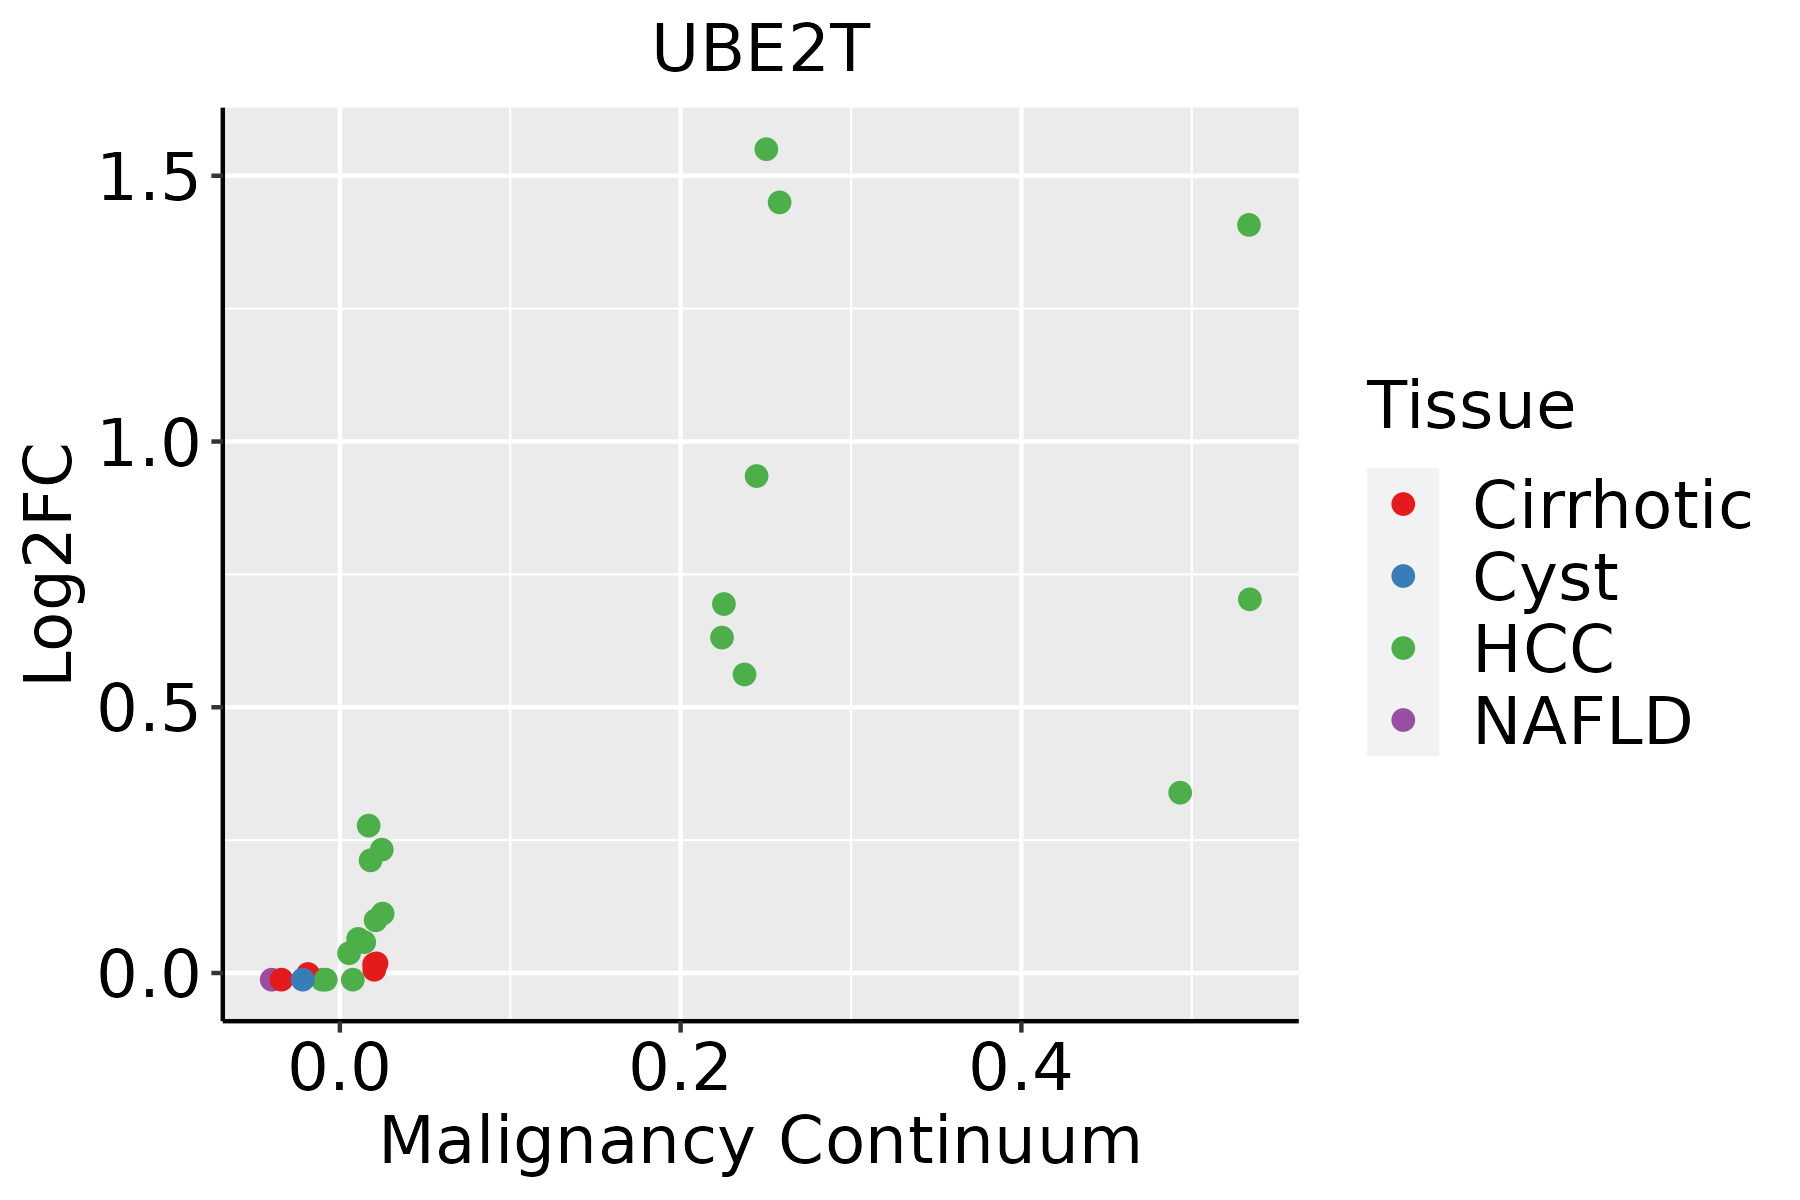 | HCC: Hepatocellular carcinoma |
| NAFLD: Non-alcoholic fatty liver disease | ||
| Oral Cavity | 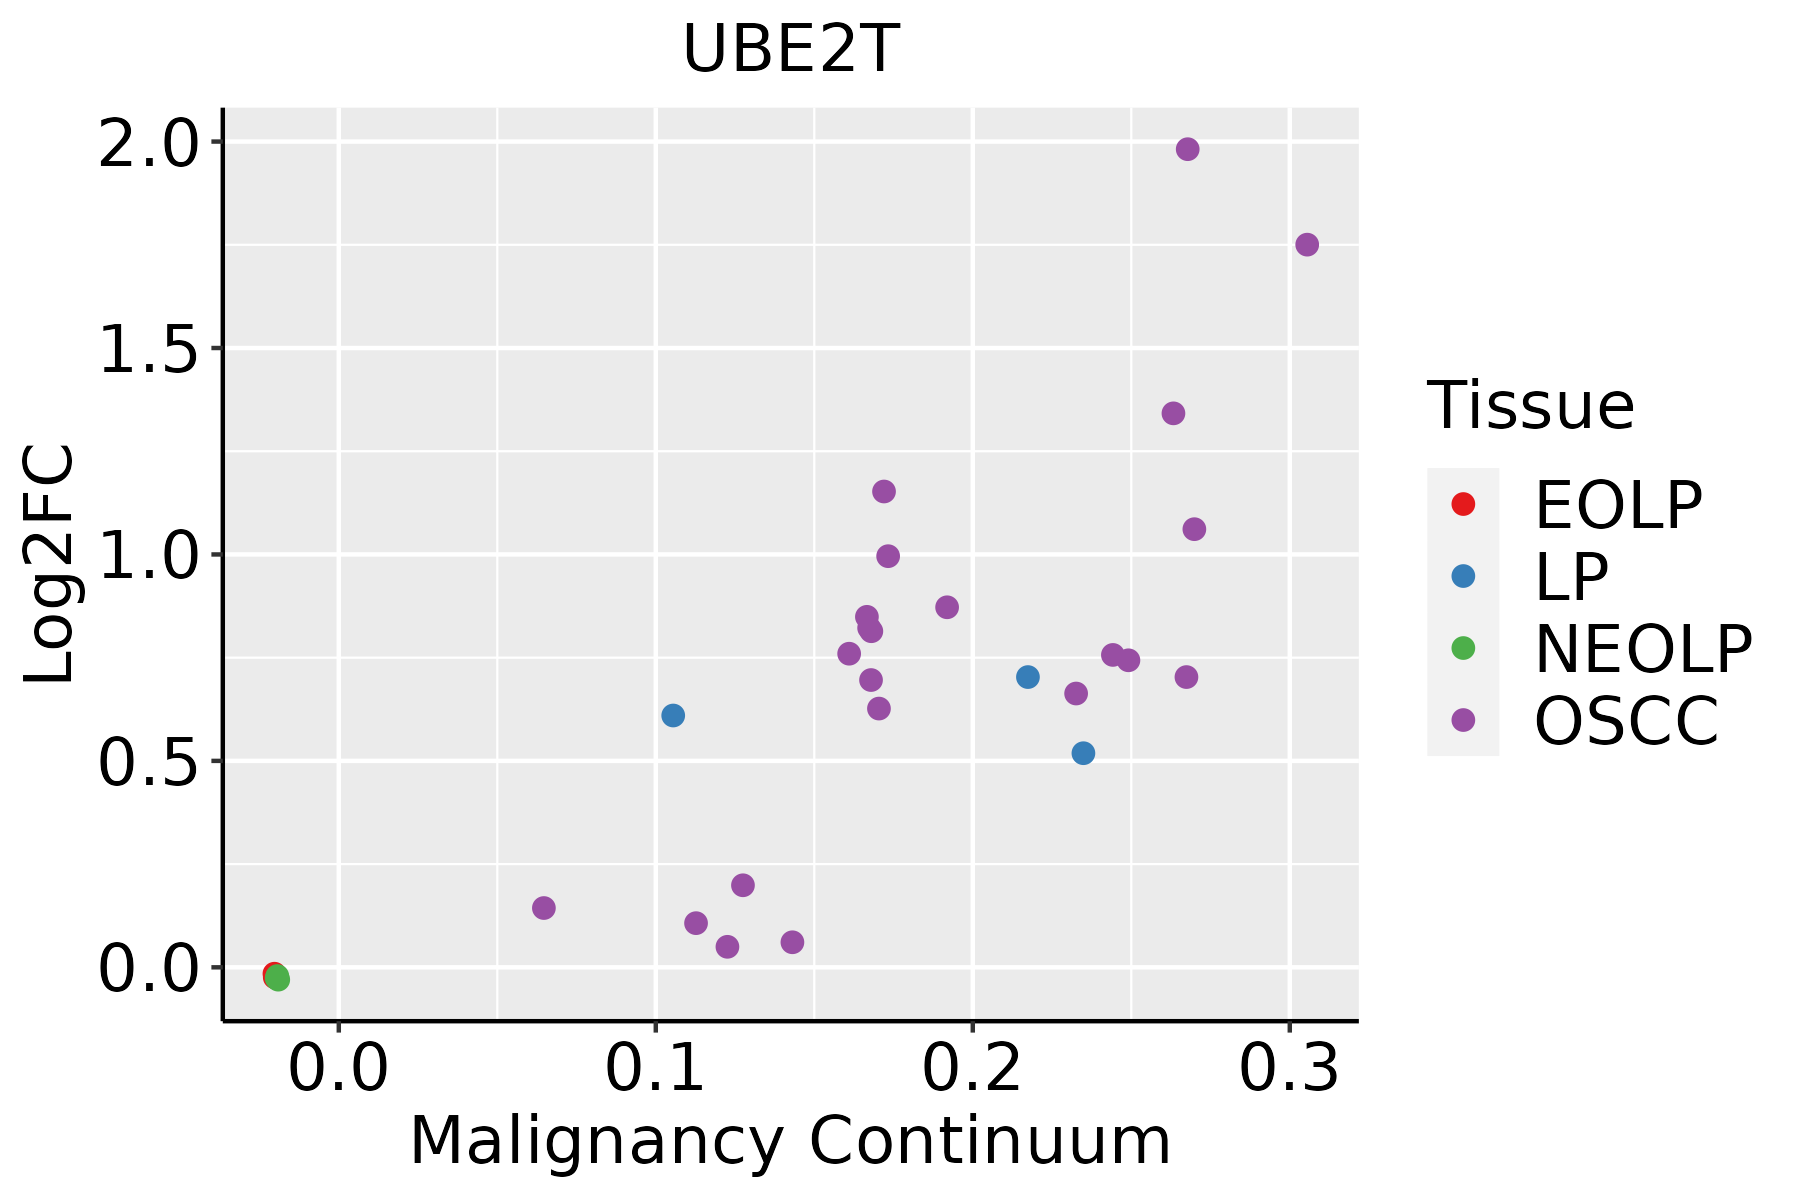 | EOLP: Erosive Oral lichen planus |
| LP: leukoplakia | ||
| NEOLP: Non-erosive oral lichen planus | ||
| OSCC: Oral squamous cell carcinoma | ||
| Skin |  | AK: Actinic keratosis |
| cSCC: Cutaneous squamous cell carcinoma | ||
| SCCIS:squamous cell carcinoma in situ | ||
| Thyroid |  | ATC: Anaplastic thyroid cancer |
| HT: Hashimoto's thyroiditis | ||
| PTC: Papillary thyroid cancer |
| ∗log2FC in expression of this searched gene in stem-like cells from each diseased tissue sample relative to stem-like cells in normal samples in each tissue plotted against the malignancy continuum. Samples are colored based on if they are from different disease stage. |
Top |
Malignant transformation related pathway analysis |
| Find out the enriched GO biological processes and KEGG pathways involved in transition from healthy to precancer to cancer |
| Tissue | Disease Stage | Enriched GO biological Processes |
| Colorectum | AD |  |
| Colorectum | SER |  |
| Colorectum | MSS |  |
| Colorectum | MSI-H |  |
| Colorectum | FAP |  |
| ∗Top 15 enriched GO BP terms are showed in the bar plot of each disease state in each tissue. Each row represents a significant GO biological process which is colored according to the -log10(p.adjust). |
| Page: 1 2 3 4 5 6 7 8 9 |
| GO ID | Tissue | Disease Stage | Description | Gene Ratio | Bg Ratio | pvalue | p.adjust | Count |
| GO:000020917 | Esophagus | ESCC | protein polyubiquitination | 170/8552 | 236/18723 | 1.40e-16 | 1.09e-14 | 170 |
| GO:007093617 | Esophagus | ESCC | protein K48-linked ubiquitination | 55/8552 | 65/18723 | 8.42e-11 | 2.58e-09 | 55 |
| GO:00065136 | Esophagus | ESCC | protein monoubiquitination | 53/8552 | 67/18723 | 2.11e-08 | 4.03e-07 | 53 |
| GO:007097912 | Esophagus | ESCC | protein K11-linked ubiquitination | 27/8552 | 29/18723 | 8.09e-08 | 1.39e-06 | 27 |
| GO:007053413 | Esophagus | ESCC | protein K63-linked ubiquitination | 44/8552 | 56/18723 | 4.84e-07 | 6.50e-06 | 44 |
| GO:00518658 | Esophagus | ESCC | protein autoubiquitination | 47/8552 | 73/18723 | 9.72e-04 | 4.93e-03 | 47 |
| GO:000020921 | Liver | HCC | protein polyubiquitination | 151/7958 | 236/18723 | 1.90e-11 | 7.59e-10 | 151 |
| GO:007093621 | Liver | HCC | protein K48-linked ubiquitination | 52/7958 | 65/18723 | 6.70e-10 | 2.11e-08 | 52 |
| GO:00709791 | Liver | HCC | protein K11-linked ubiquitination | 24/7958 | 29/18723 | 1.04e-05 | 1.20e-04 | 24 |
| GO:007053411 | Liver | HCC | protein K63-linked ubiquitination | 39/7958 | 56/18723 | 3.63e-05 | 3.61e-04 | 39 |
| GO:000651311 | Liver | HCC | protein monoubiquitination | 44/7958 | 67/18723 | 1.08e-04 | 9.22e-04 | 44 |
| GO:00518654 | Liver | HCC | protein autoubiquitination | 42/7958 | 73/18723 | 6.78e-03 | 2.73e-02 | 42 |
| GO:000020910 | Oral cavity | OSCC | protein polyubiquitination | 150/7305 | 236/18723 | 1.59e-14 | 9.27e-13 | 150 |
| GO:00709369 | Oral cavity | OSCC | protein K48-linked ubiquitination | 53/7305 | 65/18723 | 2.47e-12 | 1.02e-10 | 53 |
| GO:00709793 | Oral cavity | OSCC | protein K11-linked ubiquitination | 26/7305 | 29/18723 | 2.05e-08 | 4.01e-07 | 26 |
| GO:00065135 | Oral cavity | OSCC | protein monoubiquitination | 47/7305 | 67/18723 | 2.32e-07 | 3.68e-06 | 47 |
| GO:00705344 | Oral cavity | OSCC | protein K63-linked ubiquitination | 37/7305 | 56/18723 | 3.74e-05 | 3.32e-04 | 37 |
| GO:00518657 | Oral cavity | OSCC | protein autoubiquitination | 40/7305 | 73/18723 | 4.45e-03 | 1.79e-02 | 40 |
| GO:007093616 | Oral cavity | LP | protein K48-linked ubiquitination | 32/4623 | 65/18723 | 1.61e-05 | 2.81e-04 | 32 |
| GO:000020915 | Oral cavity | LP | protein polyubiquitination | 82/4623 | 236/18723 | 3.23e-04 | 3.26e-03 | 82 |
| Page: 1 2 |
| Pathway ID | Tissue | Disease Stage | Description | Gene Ratio | Bg Ratio | pvalue | p.adjust | qvalue | Count |
| Page: 1 |
Top |
Cell-cell communication analysis |
| Identification of potential cell-cell interactions between two cell types and their ligand-receptor pairs for different disease states |
| Ligand | Receptor | LRpair | Pathway | Tissue | Disease Stage |
| Page: 1 |
Top |
Single-cell gene regulatory network inference analysis |
| Find out the significant the regulons (TFs) and the target genes of each regulon across cell types for different disease states |
| TF | Cell Type | Tissue | Disease Stage | Target Gene | RSS | Regulon Activity |
| ∗The dot plots of a searched regulon are shown for all cell subpopulations in each disease state of each tissue based on the regulon specific score inferred using pySCENIC and by calculating the average expression. |
| Page: 1 |
Top |
Somatic mutation of malignant transformation related genes |
| Annotation of somatic variants for genes involved in malignant transformation |
| Hugo Symbol | Variant Class | Variant Classification | dbSNP RS | HGVSc | HGVSp | HGVSp Short | SWISSPROT | BIOTYPE | SIFT | PolyPhen | Tumor Sample Barcode | Tissue | Histology | Sex | Age | Stage | Therapy Types | Drugs | Outcome |
| UBE2T | SNV | Missense_Mutation | c.475G>A | p.Glu159Lys | p.E159K | Q9NPD8 | protein_coding | tolerated(0.54) | benign(0.038) | TCGA-D8-A1J8-01 | Breast | breast invasive carcinoma | Female | >=65 | I/II | Hormone Therapy | nolvadex | SD | |
| UBE2T | SNV | Missense_Mutation | c.104G>A | p.Arg35Gln | p.R35Q | Q9NPD8 | protein_coding | tolerated(0.27) | benign(0.014) | TCGA-D8-A1JG-01 | Breast | breast invasive carcinoma | Female | <65 | I/II | Chemotherapy | doxorubicin | SD | |
| UBE2T | SNV | Missense_Mutation | c.361N>A | p.Asp121Asn | p.D121N | Q9NPD8 | protein_coding | deleterious(0.02) | possibly_damaging(0.675) | TCGA-LP-A4AX-01 | Cervix | cervical & endocervical cancer | Female | <65 | I/II | Unknown | Unknown | SD | |
| UBE2T | deletion | Frame_Shift_Del | c.59delN | p.Pro20GlnfsTer20 | p.P20Qfs*20 | Q9NPD8 | protein_coding | TCGA-AA-3672-01 | Colorectum | colon adenocarcinoma | Female | >=65 | III/IV | Unknown | Unknown | SD | |||
| UBE2T | insertion | Frame_Shift_Ins | novel | c.183_184insAA | p.Pro62AsnfsTer48 | p.P62Nfs*48 | Q9NPD8 | protein_coding | TCGA-AM-5820-01 | Colorectum | colon adenocarcinoma | Female | <65 | I/II | Unknown | Unknown | SD | ||
| UBE2T | insertion | Nonsense_Mutation | novel | c.182_183insGAGT | p.Tyr61Ter | p.Y61* | Q9NPD8 | protein_coding | TCGA-AM-5820-01 | Colorectum | colon adenocarcinoma | Female | <65 | I/II | Unknown | Unknown | SD | ||
| UBE2T | SNV | Missense_Mutation | novel | c.337C>A | p.Leu113Met | p.L113M | Q9NPD8 | protein_coding | tolerated(0.07) | benign(0.28) | TCGA-B5-A11E-01 | Endometrium | uterine corpus endometrioid carcinoma | Female | <65 | I/II | Unknown | Unknown | SD |
| UBE2T | SNV | Missense_Mutation | novel | c.294N>T | p.Trp98Cys | p.W98C | Q9NPD8 | protein_coding | deleterious(0.02) | probably_damaging(0.982) | TCGA-EY-A215-01 | Endometrium | uterine corpus endometrioid carcinoma | Female | <65 | I/II | Unknown | Unknown | SD |
| UBE2T | deletion | Frame_Shift_Del | c.59delN | p.Pro20GlnfsTer20 | p.P20Qfs*20 | Q9NPD8 | protein_coding | TCGA-D1-A175-01 | Endometrium | uterine corpus endometrioid carcinoma | Female | <65 | I/II | Chemotherapy | paclitaxel | SD | |||
| UBE2T | deletion | Frame_Shift_Del | c.59delN | p.Pro20GlnfsTer20 | p.P20Qfs*20 | Q9NPD8 | protein_coding | TCGA-EY-A547-01 | Endometrium | uterine corpus endometrioid carcinoma | Female | >=65 | I/II | Unknown | Unknown | SD |
| Page: 1 2 |
Top |
Related drugs of malignant transformation related genes |
| Identification of chemicals and drugs interact with genes involved in malignant transfromation |
| (DGIdb 4.0) |
| Entrez ID | Symbol | Category | Interaction Types | Drug Claim Name | Drug Name | PMIDs |
| 29089 | UBE2T | ENZYME, DNA REPAIR, CLINICALLY ACTIONABLE | MK-2206 | MK-2206 |
| Page: 1 |

Copyright 2023-Present -The University of Texas Health Science Center at Houston |