
|
|||||
|
 | |
| |
| |
| |
| |
| |
|
Gene: UBE2R2 |
Gene summary for UBE2R2 |
| Gene information | Species | Human | Gene symbol | UBE2R2 | Gene ID | 54926 |
| Gene name | ubiquitin conjugating enzyme E2 R2 | |
| Gene Alias | CDC34B | |
| Cytomap | 9p13.3 | |
| Gene Type | protein-coding | GO ID | GO:0000209 | UniProtAcc | Q712K3 |
Top |
Malignant transformation analysis |
| Identification of the aberrant gene expression in precancerous and cancerous lesions by comparing the gene expression of stem-like cells in diseased tissues with normal stem cells |
| Entrez ID | Symbol | Replicates | Species | Organ | Tissue | Adj P-value | Log2FC | Malignancy |
| 54926 | UBE2R2 | CA_HPV_1 | Human | Cervix | CC | 4.71e-04 | -1.05e-01 | 0.0264 |
| 54926 | UBE2R2 | CCI_2 | Human | Cervix | CC | 5.73e-10 | 1.06e+00 | 0.5249 |
| 54926 | UBE2R2 | CCI_3 | Human | Cervix | CC | 1.08e-05 | 5.89e-01 | 0.516 |
| 54926 | UBE2R2 | HTA11_3410_2000001011 | Human | Colorectum | AD | 2.67e-02 | -1.76e-01 | 0.0155 |
| 54926 | UBE2R2 | HTA11_347_2000001011 | Human | Colorectum | AD | 4.91e-02 | 2.89e-01 | -0.1954 |
| 54926 | UBE2R2 | HTA11_99999965062_69753 | Human | Colorectum | MSI-H | 2.87e-07 | 1.22e+00 | 0.3487 |
| 54926 | UBE2R2 | HTA11_99999965104_69814 | Human | Colorectum | MSS | 1.79e-07 | 7.13e-01 | 0.281 |
| 54926 | UBE2R2 | HTA11_99999971662_82457 | Human | Colorectum | MSS | 7.80e-11 | 6.90e-01 | 0.3859 |
| 54926 | UBE2R2 | A001-C-207 | Human | Colorectum | FAP | 3.23e-03 | -2.34e-01 | 0.1278 |
| 54926 | UBE2R2 | A015-C-203 | Human | Colorectum | FAP | 6.64e-21 | -2.93e-01 | -0.1294 |
| 54926 | UBE2R2 | A015-C-204 | Human | Colorectum | FAP | 2.28e-05 | -2.31e-01 | -0.0228 |
| 54926 | UBE2R2 | A014-C-040 | Human | Colorectum | FAP | 1.46e-02 | -1.60e-01 | -0.1184 |
| 54926 | UBE2R2 | A002-C-201 | Human | Colorectum | FAP | 3.08e-08 | -1.33e-01 | 0.0324 |
| 54926 | UBE2R2 | A002-C-203 | Human | Colorectum | FAP | 8.34e-04 | -1.12e-01 | 0.2786 |
| 54926 | UBE2R2 | A001-C-119 | Human | Colorectum | FAP | 2.63e-05 | 9.32e-03 | -0.1557 |
| 54926 | UBE2R2 | A001-C-108 | Human | Colorectum | FAP | 1.06e-13 | -2.56e-01 | -0.0272 |
| 54926 | UBE2R2 | A002-C-205 | Human | Colorectum | FAP | 1.94e-18 | -1.94e-01 | -0.1236 |
| 54926 | UBE2R2 | A001-C-104 | Human | Colorectum | FAP | 4.05e-03 | -1.32e-01 | 0.0184 |
| 54926 | UBE2R2 | A015-C-005 | Human | Colorectum | FAP | 1.21e-04 | -2.51e-01 | -0.0336 |
| 54926 | UBE2R2 | A015-C-006 | Human | Colorectum | FAP | 1.84e-16 | -5.43e-01 | -0.0994 |
| Page: 1 2 3 4 5 6 7 8 9 |
| Tissue | Expression Dynamics | Abbreviation |
| Cervix |  | CC: Cervix cancer |
| HSIL_HPV: HPV-infected high-grade squamous intraepithelial lesions | ||
| N_HPV: HPV-infected normal cervix | ||
| Colorectum (GSE201348) |  | FAP: Familial adenomatous polyposis |
| CRC: Colorectal cancer | ||
| Colorectum (HTA11) |  | AD: Adenomas |
| SER: Sessile serrated lesions | ||
| MSI-H: Microsatellite-high colorectal cancer | ||
| MSS: Microsatellite stable colorectal cancer | ||
| Esophagus |  | ESCC: Esophageal squamous cell carcinoma |
| HGIN: High-grade intraepithelial neoplasias | ||
| LGIN: Low-grade intraepithelial neoplasias | ||
| Liver | 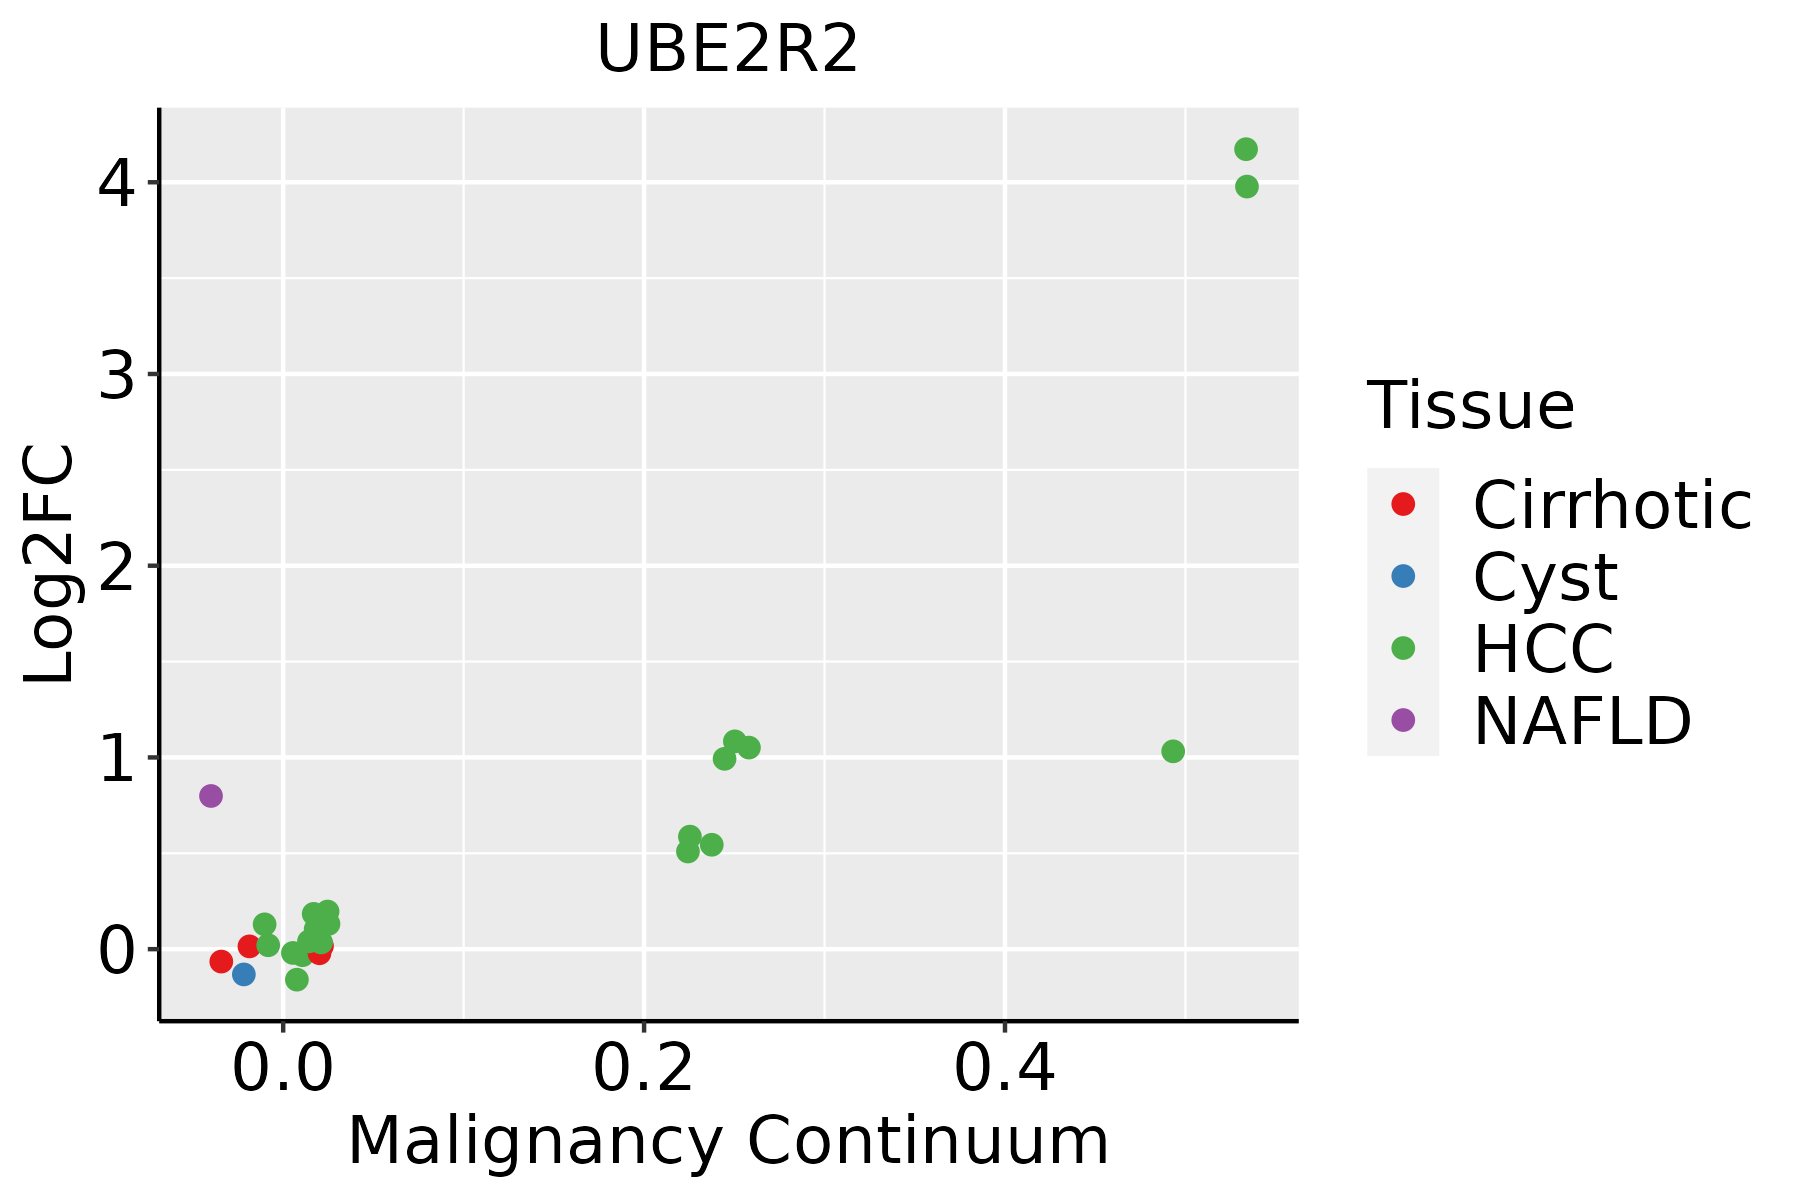 | HCC: Hepatocellular carcinoma |
| NAFLD: Non-alcoholic fatty liver disease | ||
| Oral Cavity | 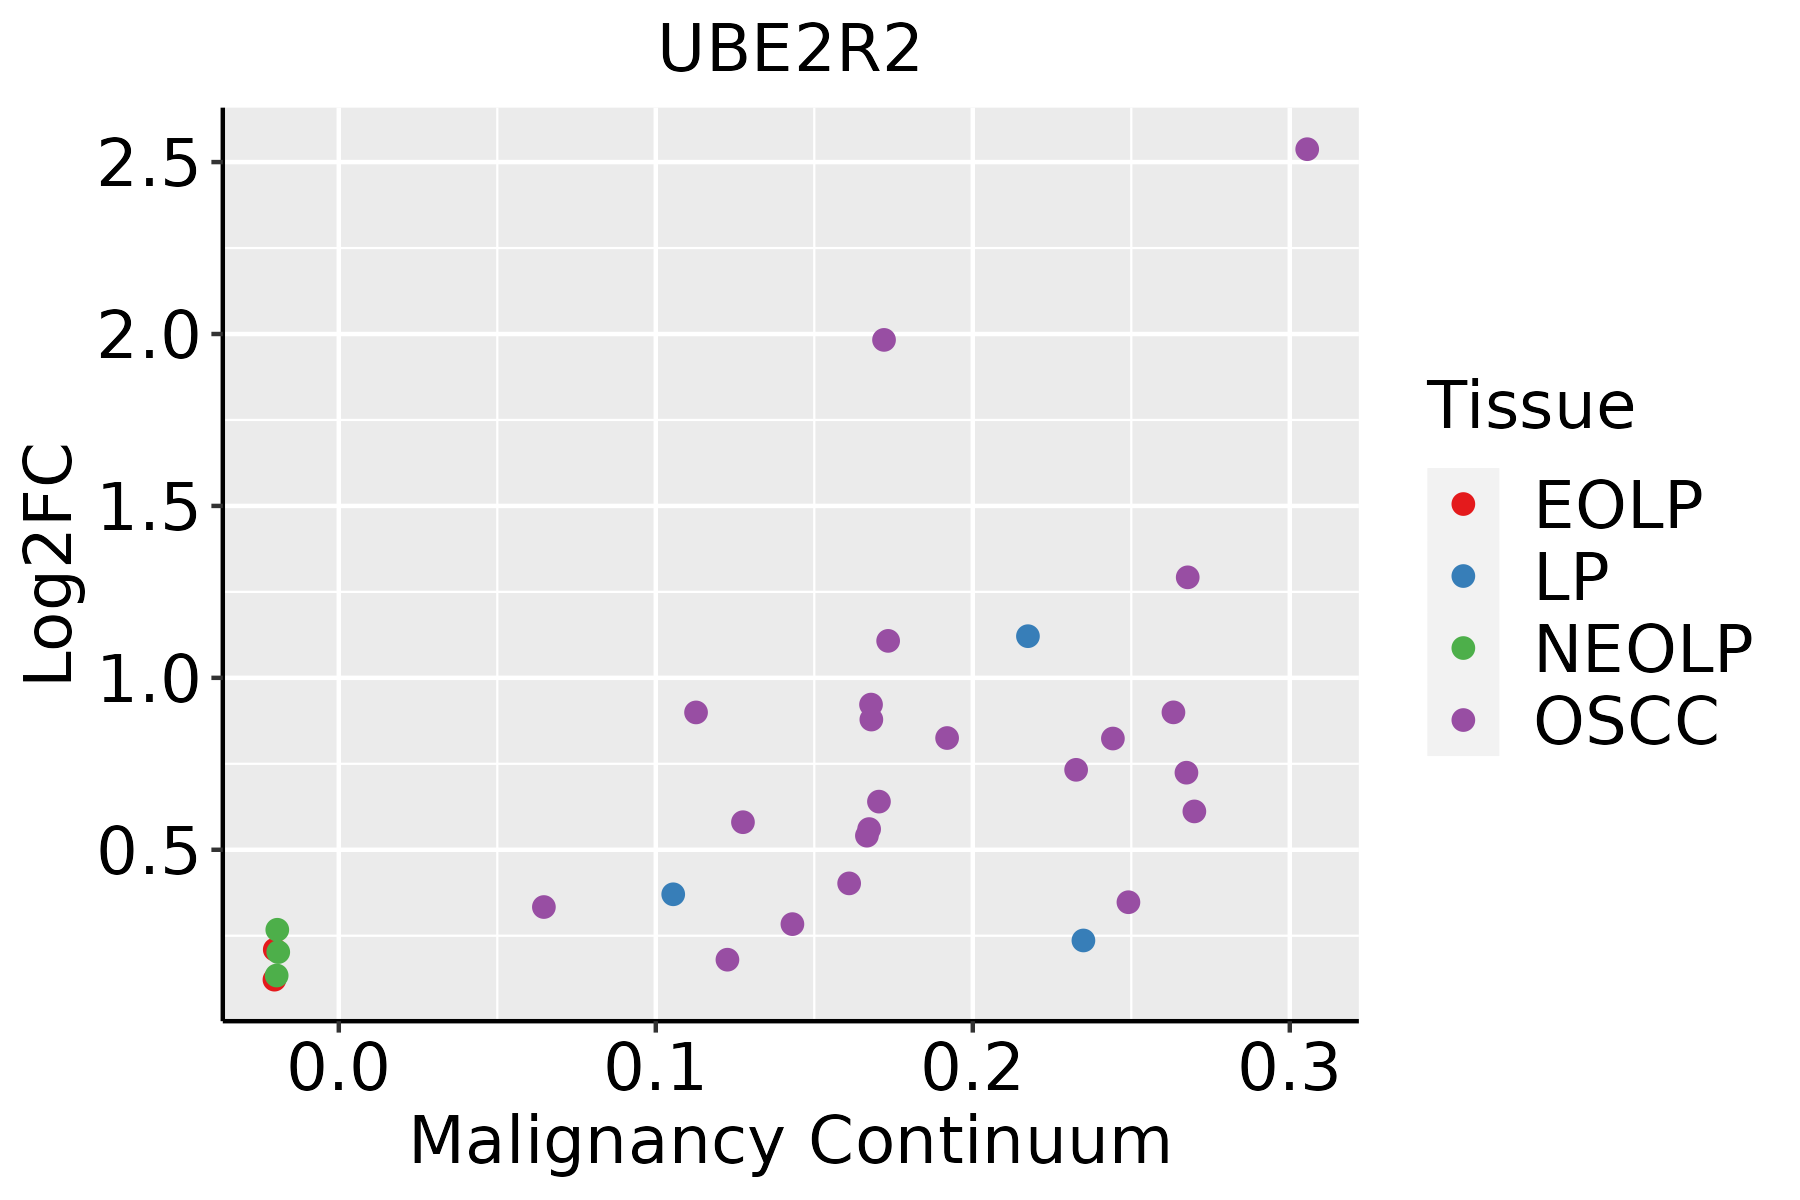 | EOLP: Erosive Oral lichen planus |
| LP: leukoplakia | ||
| NEOLP: Non-erosive oral lichen planus | ||
| OSCC: Oral squamous cell carcinoma | ||
| Prostate | 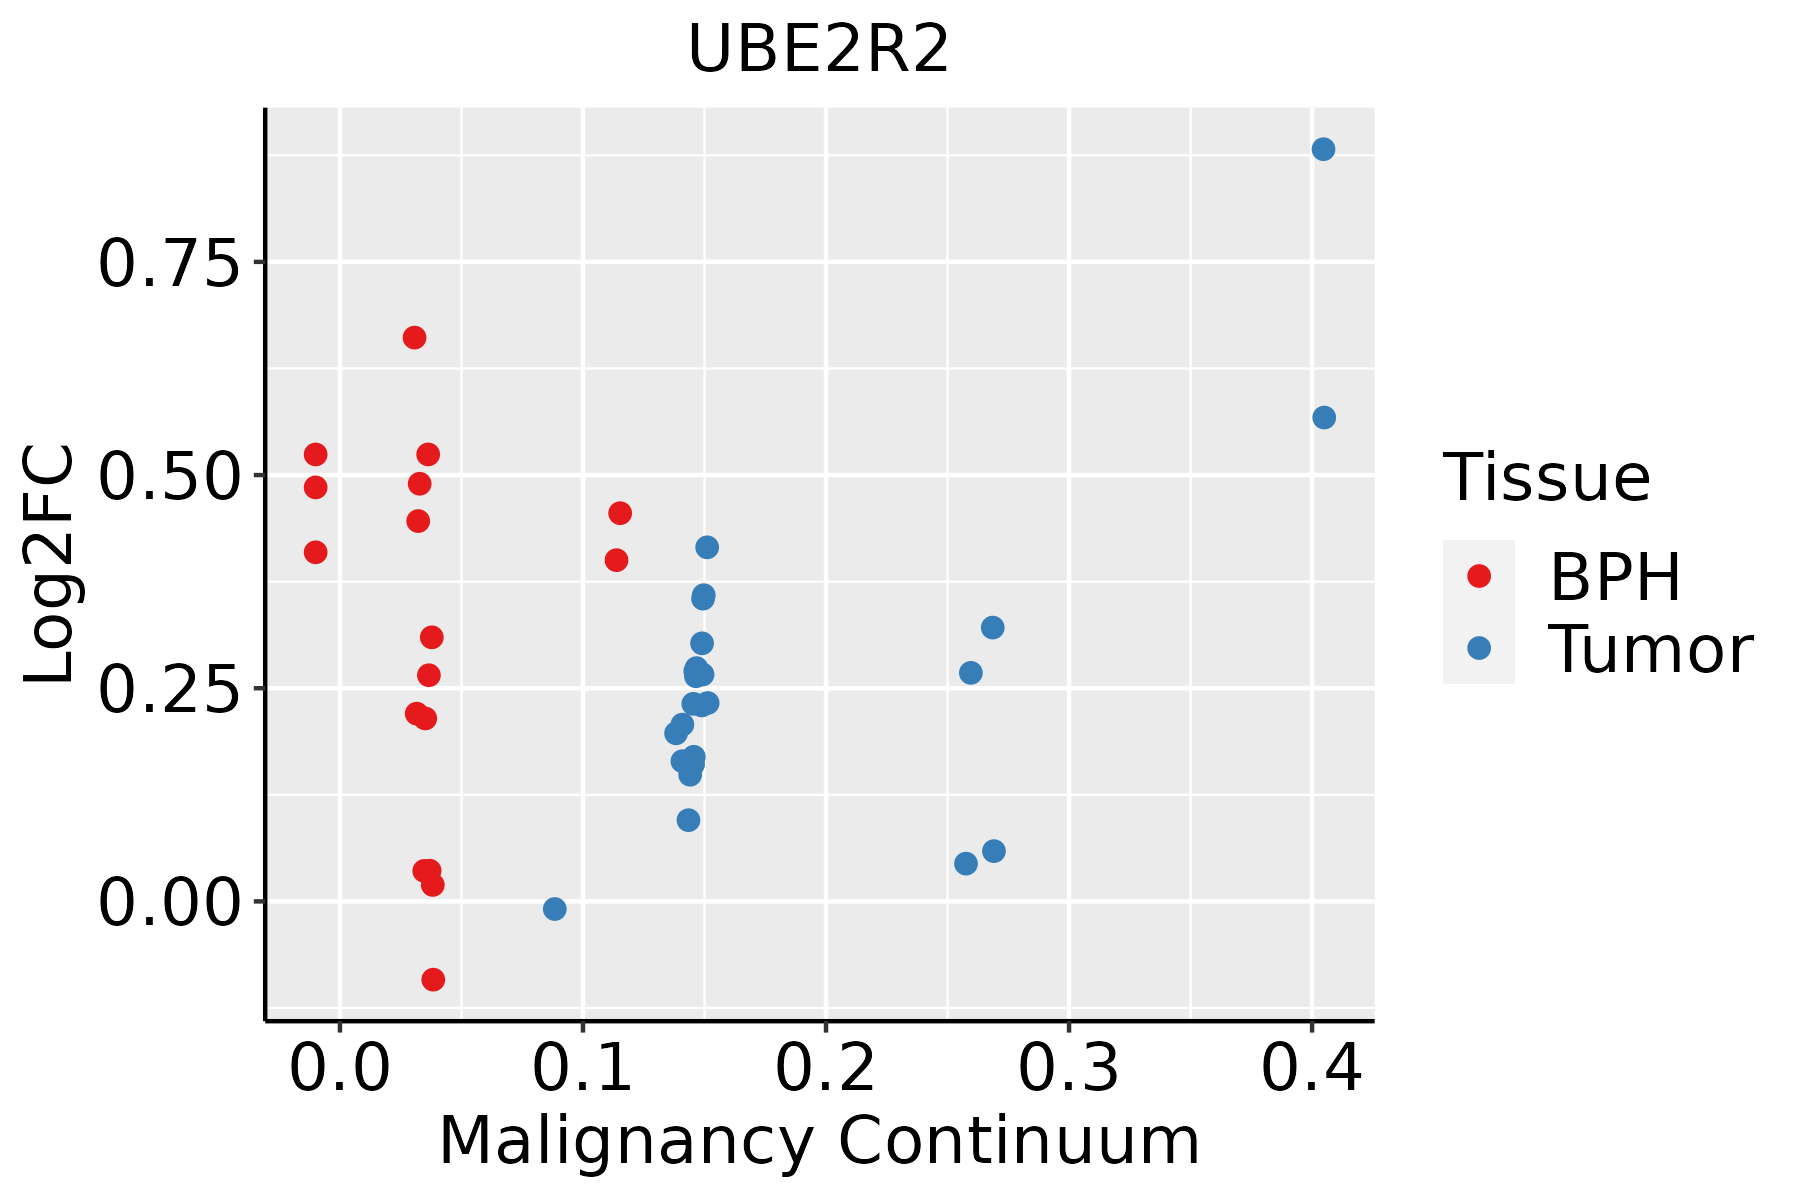 | BPH: Benign Prostatic Hyperplasia |
| Skin | 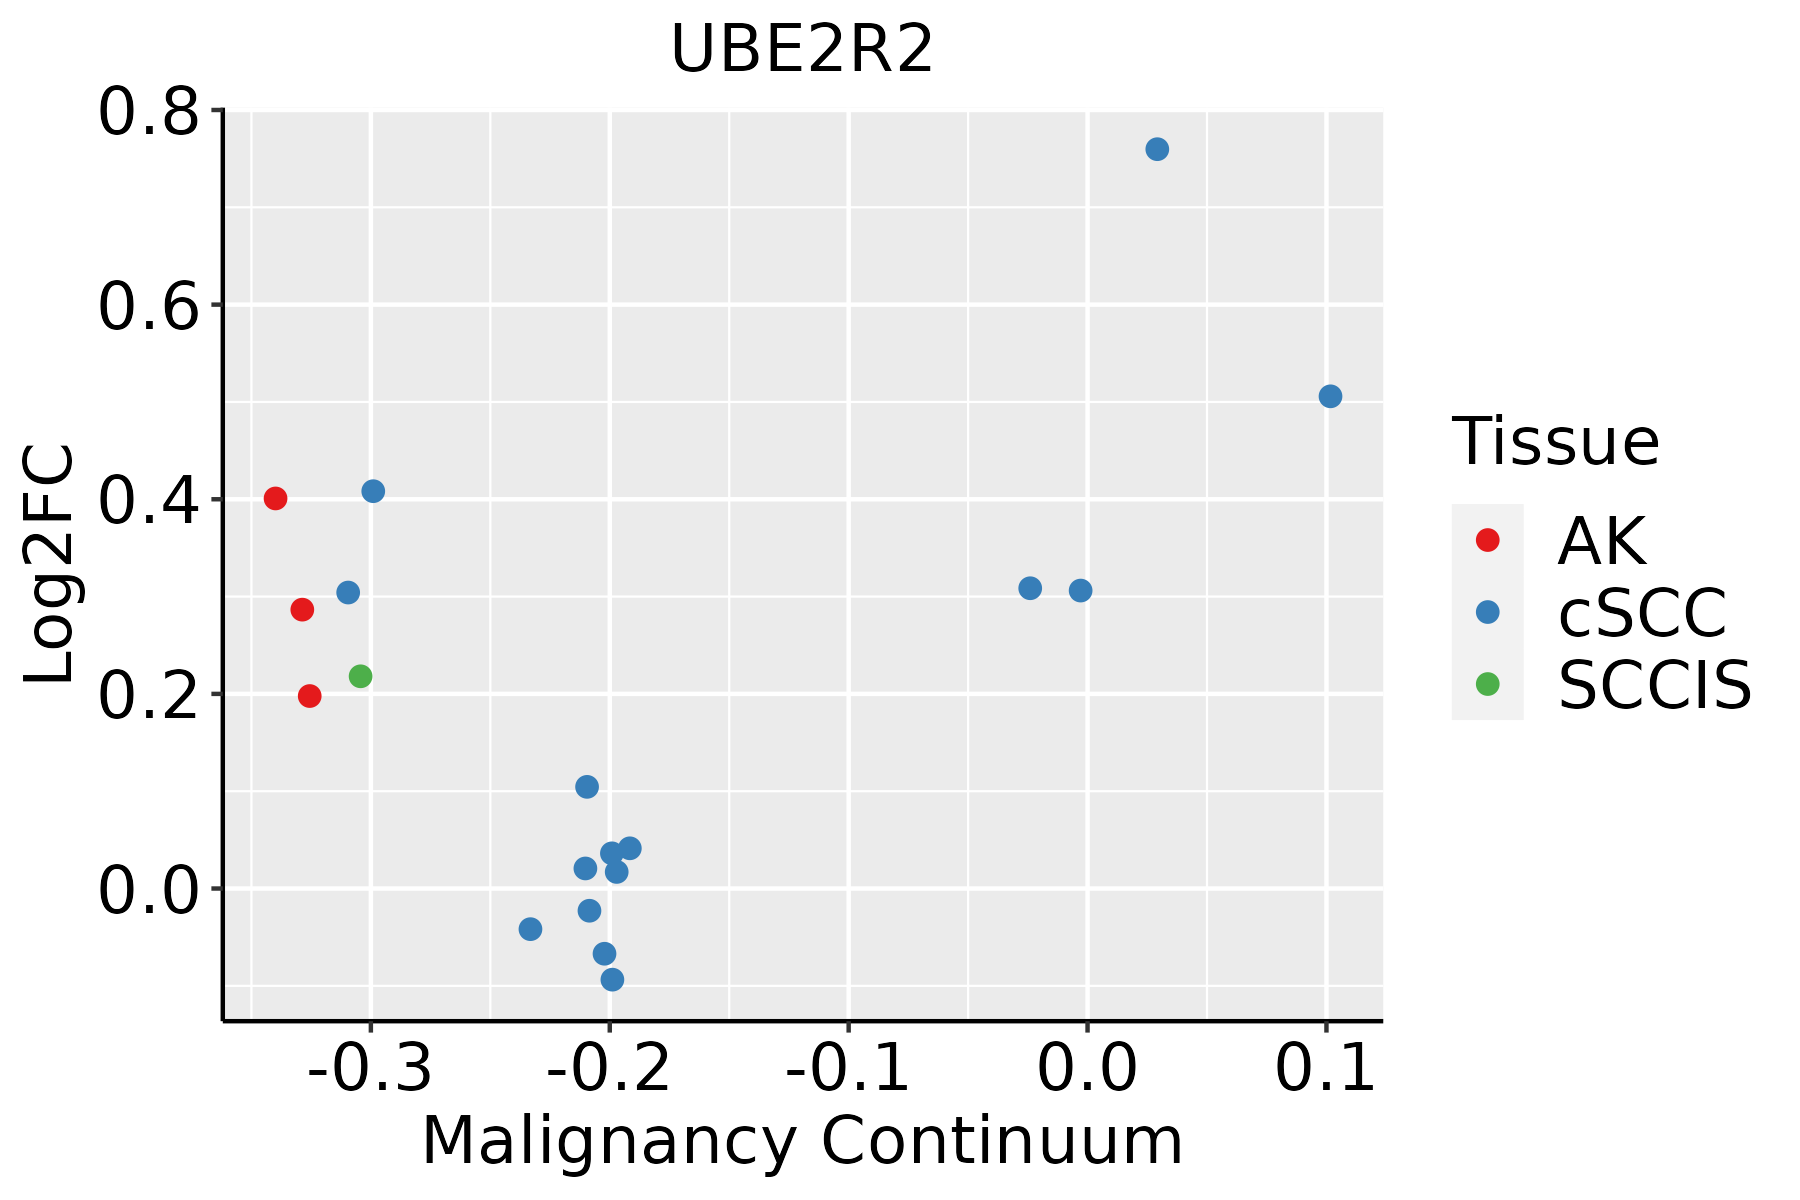 | AK: Actinic keratosis |
| cSCC: Cutaneous squamous cell carcinoma | ||
| SCCIS:squamous cell carcinoma in situ | ||
| Thyroid | 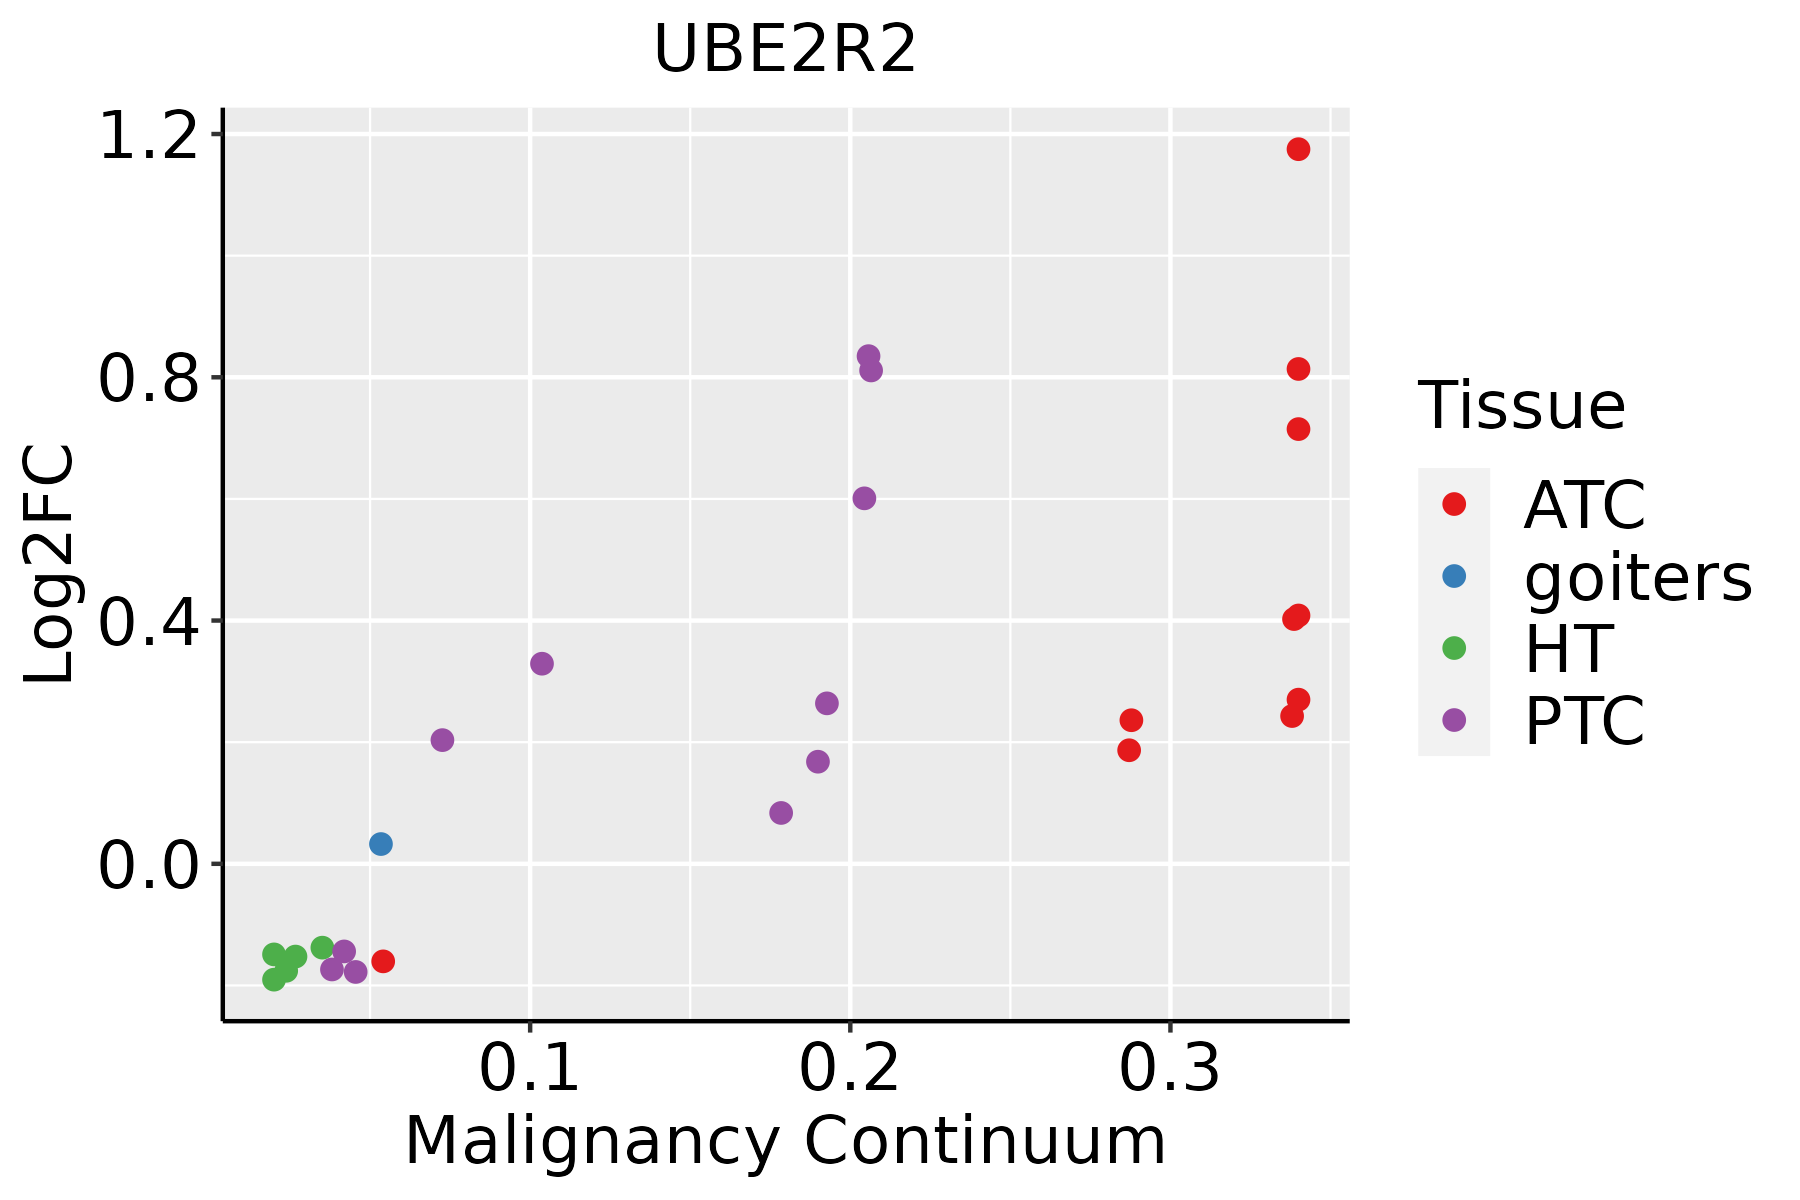 | ATC: Anaplastic thyroid cancer |
| HT: Hashimoto's thyroiditis | ||
| PTC: Papillary thyroid cancer |
| ∗log2FC in expression of this searched gene in stem-like cells from each diseased tissue sample relative to stem-like cells in normal samples in each tissue plotted against the malignancy continuum. Samples are colored based on if they are from different disease stage. |
Top |
Malignant transformation related pathway analysis |
| Find out the enriched GO biological processes and KEGG pathways involved in transition from healthy to precancer to cancer |
| Tissue | Disease Stage | Enriched GO biological Processes |
| Colorectum | AD |  |
| Colorectum | SER |  |
| Colorectum | MSS |  |
| Colorectum | MSI-H |  |
| Colorectum | FAP |  |
| ∗Top 15 enriched GO BP terms are showed in the bar plot of each disease state in each tissue. Each row represents a significant GO biological process which is colored according to the -log10(p.adjust). |
| Page: 1 2 3 4 5 6 7 8 9 |
| GO ID | Tissue | Disease Stage | Description | Gene Ratio | Bg Ratio | pvalue | p.adjust | Count |
| GO:00002097 | Cervix | CC | protein polyubiquitination | 58/2311 | 236/18723 | 1.57e-07 | 7.41e-06 | 58 |
| GO:00709366 | Cervix | CC | protein K48-linked ubiquitination | 22/2311 | 65/18723 | 5.56e-06 | 1.38e-04 | 22 |
| GO:0000209 | Colorectum | AD | protein polyubiquitination | 78/3918 | 236/18723 | 8.71e-06 | 2.06e-04 | 78 |
| GO:0070936 | Colorectum | AD | protein K48-linked ubiquitination | 27/3918 | 65/18723 | 1.31e-04 | 1.88e-03 | 27 |
| GO:0006513 | Colorectum | AD | protein monoubiquitination | 23/3918 | 67/18723 | 7.55e-03 | 4.58e-02 | 23 |
| GO:00002092 | Colorectum | MSS | protein polyubiquitination | 72/3467 | 236/18723 | 5.19e-06 | 1.42e-04 | 72 |
| GO:00709361 | Colorectum | MSS | protein K48-linked ubiquitination | 27/3467 | 65/18723 | 1.40e-05 | 3.18e-04 | 27 |
| GO:00065131 | Colorectum | MSS | protein monoubiquitination | 21/3467 | 67/18723 | 7.90e-03 | 4.84e-02 | 21 |
| GO:00709362 | Colorectum | FAP | protein K48-linked ubiquitination | 24/2622 | 65/18723 | 3.42e-06 | 1.23e-04 | 24 |
| GO:00002093 | Colorectum | FAP | protein polyubiquitination | 59/2622 | 236/18723 | 4.53e-06 | 1.52e-04 | 59 |
| GO:00065132 | Colorectum | FAP | protein monoubiquitination | 18/2622 | 67/18723 | 4.08e-03 | 2.81e-02 | 18 |
| GO:00709363 | Colorectum | CRC | protein K48-linked ubiquitination | 19/2078 | 65/18723 | 5.34e-05 | 1.22e-03 | 19 |
| GO:00002094 | Colorectum | CRC | protein polyubiquitination | 46/2078 | 236/18723 | 9.91e-05 | 1.98e-03 | 46 |
| GO:000020917 | Esophagus | ESCC | protein polyubiquitination | 170/8552 | 236/18723 | 1.40e-16 | 1.09e-14 | 170 |
| GO:007093617 | Esophagus | ESCC | protein K48-linked ubiquitination | 55/8552 | 65/18723 | 8.42e-11 | 2.58e-09 | 55 |
| GO:00065136 | Esophagus | ESCC | protein monoubiquitination | 53/8552 | 67/18723 | 2.11e-08 | 4.03e-07 | 53 |
| GO:00002095 | Liver | NAFLD | protein polyubiquitination | 51/1882 | 236/18723 | 1.04e-07 | 8.10e-06 | 51 |
| GO:00709364 | Liver | NAFLD | protein K48-linked ubiquitination | 19/1882 | 65/18723 | 1.33e-05 | 3.97e-04 | 19 |
| GO:007093611 | Liver | Cirrhotic | protein K48-linked ubiquitination | 36/4634 | 65/18723 | 1.23e-07 | 3.41e-06 | 36 |
| GO:000020911 | Liver | Cirrhotic | protein polyubiquitination | 89/4634 | 236/18723 | 6.09e-06 | 9.80e-05 | 89 |
| Page: 1 2 3 |
| Pathway ID | Tissue | Disease Stage | Description | Gene Ratio | Bg Ratio | pvalue | p.adjust | qvalue | Count |
| hsa0412014 | Cervix | CC | Ubiquitin mediated proteolysis | 49/1267 | 142/8465 | 4.26e-09 | 7.68e-08 | 4.54e-08 | 49 |
| hsa0412015 | Cervix | CC | Ubiquitin mediated proteolysis | 49/1267 | 142/8465 | 4.26e-09 | 7.68e-08 | 4.54e-08 | 49 |
| hsa04120 | Colorectum | AD | Ubiquitin mediated proteolysis | 58/2092 | 142/8465 | 1.46e-05 | 1.53e-04 | 9.76e-05 | 58 |
| hsa041201 | Colorectum | AD | Ubiquitin mediated proteolysis | 58/2092 | 142/8465 | 1.46e-05 | 1.53e-04 | 9.76e-05 | 58 |
| hsa041204 | Colorectum | MSS | Ubiquitin mediated proteolysis | 55/1875 | 142/8465 | 5.02e-06 | 6.00e-05 | 3.68e-05 | 55 |
| hsa041205 | Colorectum | MSS | Ubiquitin mediated proteolysis | 55/1875 | 142/8465 | 5.02e-06 | 6.00e-05 | 3.68e-05 | 55 |
| hsa041206 | Colorectum | FAP | Ubiquitin mediated proteolysis | 51/1404 | 142/8465 | 1.55e-08 | 5.84e-07 | 3.55e-07 | 51 |
| hsa041207 | Colorectum | FAP | Ubiquitin mediated proteolysis | 51/1404 | 142/8465 | 1.55e-08 | 5.84e-07 | 3.55e-07 | 51 |
| hsa041208 | Colorectum | CRC | Ubiquitin mediated proteolysis | 42/1091 | 142/8465 | 9.98e-08 | 6.67e-06 | 4.52e-06 | 42 |
| hsa041209 | Colorectum | CRC | Ubiquitin mediated proteolysis | 42/1091 | 142/8465 | 9.98e-08 | 6.67e-06 | 4.52e-06 | 42 |
| hsa0412027 | Esophagus | ESCC | Ubiquitin mediated proteolysis | 122/4205 | 142/8465 | 6.53e-20 | 7.29e-18 | 3.74e-18 | 122 |
| hsa0412036 | Esophagus | ESCC | Ubiquitin mediated proteolysis | 122/4205 | 142/8465 | 6.53e-20 | 7.29e-18 | 3.74e-18 | 122 |
| hsa0412010 | Liver | NAFLD | Ubiquitin mediated proteolysis | 44/1043 | 142/8465 | 2.59e-09 | 1.70e-07 | 1.37e-07 | 44 |
| hsa0412011 | Liver | NAFLD | Ubiquitin mediated proteolysis | 44/1043 | 142/8465 | 2.59e-09 | 1.70e-07 | 1.37e-07 | 44 |
| hsa0412021 | Liver | Cirrhotic | Ubiquitin mediated proteolysis | 72/2530 | 142/8465 | 1.32e-07 | 1.97e-06 | 1.21e-06 | 72 |
| hsa0412031 | Liver | Cirrhotic | Ubiquitin mediated proteolysis | 72/2530 | 142/8465 | 1.32e-07 | 1.97e-06 | 1.21e-06 | 72 |
| hsa0412041 | Liver | HCC | Ubiquitin mediated proteolysis | 110/4020 | 142/8465 | 1.67e-13 | 3.74e-12 | 2.08e-12 | 110 |
| hsa0412051 | Liver | HCC | Ubiquitin mediated proteolysis | 110/4020 | 142/8465 | 1.67e-13 | 3.74e-12 | 2.08e-12 | 110 |
| hsa0412020 | Oral cavity | OSCC | Ubiquitin mediated proteolysis | 105/3704 | 142/8465 | 1.83e-13 | 4.37e-12 | 2.23e-12 | 105 |
| hsa04120110 | Oral cavity | OSCC | Ubiquitin mediated proteolysis | 105/3704 | 142/8465 | 1.83e-13 | 4.37e-12 | 2.23e-12 | 105 |
| Page: 1 2 |
Top |
Cell-cell communication analysis |
| Identification of potential cell-cell interactions between two cell types and their ligand-receptor pairs for different disease states |
| Ligand | Receptor | LRpair | Pathway | Tissue | Disease Stage |
| Page: 1 |
Top |
Single-cell gene regulatory network inference analysis |
| Find out the significant the regulons (TFs) and the target genes of each regulon across cell types for different disease states |
| TF | Cell Type | Tissue | Disease Stage | Target Gene | RSS | Regulon Activity |
| ∗The dot plots of a searched regulon are shown for all cell subpopulations in each disease state of each tissue based on the regulon specific score inferred using pySCENIC and by calculating the average expression. |
| Page: 1 |
Top |
Somatic mutation of malignant transformation related genes |
| Annotation of somatic variants for genes involved in malignant transformation |
| Hugo Symbol | Variant Class | Variant Classification | dbSNP RS | HGVSc | HGVSp | HGVSp Short | SWISSPROT | BIOTYPE | SIFT | PolyPhen | Tumor Sample Barcode | Tissue | Histology | Sex | Age | Stage | Therapy Types | Drugs | Outcome |
| UBE2R2 | SNV | Missense_Mutation | rs372565481 | c.603N>G | p.Asn201Lys | p.N201K | Q712K3 | protein_coding | tolerated(0.22) | benign(0.01) | TCGA-AR-A0TU-01 | Breast | breast invasive carcinoma | Female | <65 | I/II | Unspecific | Doxorubicin | SD |
| UBE2R2 | SNV | Missense_Mutation | c.334N>A | p.Glu112Lys | p.E112K | Q712K3 | protein_coding | deleterious(0.02) | probably_damaging(1) | TCGA-AR-A256-01 | Breast | breast invasive carcinoma | Female | <65 | I/II | Chemotherapy | doxorubicin | PD | |
| UBE2R2 | SNV | Missense_Mutation | novel | c.548T>C | p.Val183Ala | p.V183A | Q712K3 | protein_coding | deleterious(0) | possibly_damaging(0.907) | TCGA-A6-2672-01 | Colorectum | colon adenocarcinoma | Female | >=65 | III/IV | Unknown | Unknown | SD |
| UBE2R2 | SNV | Missense_Mutation | c.622G>A | p.Asp208Asn | p.D208N | Q712K3 | protein_coding | tolerated(0.12) | probably_damaging(0.978) | TCGA-A6-3807-01 | Colorectum | colon adenocarcinoma | Female | <65 | III/IV | Ancillary | leucovorin | SD | |
| UBE2R2 | SNV | Missense_Mutation | novel | c.489N>C | p.Glu163Asp | p.E163D | Q712K3 | protein_coding | tolerated(0.87) | benign(0.006) | TCGA-AA-3977-01 | Colorectum | colon adenocarcinoma | Male | >=65 | I/II | Unknown | Unknown | SD |
| UBE2R2 | SNV | Missense_Mutation | c.169T>C | p.Tyr57His | p.Y57H | Q712K3 | protein_coding | deleterious(0) | probably_damaging(0.998) | TCGA-AA-A022-01 | Colorectum | colon adenocarcinoma | Female | >=65 | I/II | Unknown | Unknown | SD | |
| UBE2R2 | SNV | Missense_Mutation | novel | c.444N>A | p.Phe148Leu | p.F148L | Q712K3 | protein_coding | tolerated(0.1) | benign(0.309) | TCGA-D5-6537-01 | Colorectum | colon adenocarcinoma | Male | <65 | III/IV | Unknown | Unknown | PD |
| UBE2R2 | SNV | Missense_Mutation | c.616C>A | p.Leu206Ile | p.L206I | Q712K3 | protein_coding | tolerated(0.18) | benign(0.042) | TCGA-WS-AB45-01 | Colorectum | colon adenocarcinoma | Female | <65 | I/II | Unknown | Unknown | SD | |
| UBE2R2 | SNV | Missense_Mutation | c.284N>T | p.Ser95Leu | p.S95L | Q712K3 | protein_coding | deleterious(0) | probably_damaging(0.991) | TCGA-AJ-A3EL-01 | Endometrium | uterine corpus endometrioid carcinoma | Female | <65 | I/II | Unknown | Unknown | SD | |
| UBE2R2 | SNV | Missense_Mutation | novel | c.563N>T | p.Ala188Val | p.A188V | Q712K3 | protein_coding | tolerated(0.07) | benign(0.428) | TCGA-AP-A1DK-01 | Endometrium | uterine corpus endometrioid carcinoma | Female | <65 | I/II | Unknown | Unknown | SD |
| Page: 1 2 3 |
Top |
Related drugs of malignant transformation related genes |
| Identification of chemicals and drugs interact with genes involved in malignant transfromation |
| (DGIdb 4.0) |
| Entrez ID | Symbol | Category | Interaction Types | Drug Claim Name | Drug Name | PMIDs |
| Page: 1 |

Copyright 2023-Present -The University of Texas Health Science Center at Houston |