
|
|||||
|
 | |
| |
| |
| |
| |
| |
|
Gene: UBE2O |
Gene summary for UBE2O |
| Gene information | Species | Human | Gene symbol | UBE2O | Gene ID | 63893 |
| Gene name | ubiquitin conjugating enzyme E2 O | |
| Gene Alias | E2-230K | |
| Cytomap | 17q25.1 | |
| Gene Type | protein-coding | GO ID | GO:0000209 | UniProtAcc | Q9C0C9 |
Top |
Malignant transformation analysis |
| Identification of the aberrant gene expression in precancerous and cancerous lesions by comparing the gene expression of stem-like cells in diseased tissues with normal stem cells |
| Entrez ID | Symbol | Replicates | Species | Organ | Tissue | Adj P-value | Log2FC | Malignancy |
| 63893 | UBE2O | LZE24T | Human | Esophagus | ESCC | 1.88e-02 | 1.30e-01 | 0.0596 |
| 63893 | UBE2O | P2T-E | Human | Esophagus | ESCC | 6.64e-15 | 2.21e-01 | 0.1177 |
| 63893 | UBE2O | P4T-E | Human | Esophagus | ESCC | 1.34e-03 | 1.41e-01 | 0.1323 |
| 63893 | UBE2O | P5T-E | Human | Esophagus | ESCC | 4.15e-05 | 6.51e-02 | 0.1327 |
| 63893 | UBE2O | P8T-E | Human | Esophagus | ESCC | 5.88e-09 | 6.45e-02 | 0.0889 |
| 63893 | UBE2O | P9T-E | Human | Esophagus | ESCC | 2.00e-06 | 1.85e-01 | 0.1131 |
| 63893 | UBE2O | P10T-E | Human | Esophagus | ESCC | 2.28e-10 | 1.85e-01 | 0.116 |
| 63893 | UBE2O | P11T-E | Human | Esophagus | ESCC | 1.39e-05 | 2.53e-01 | 0.1426 |
| 63893 | UBE2O | P12T-E | Human | Esophagus | ESCC | 1.09e-06 | 1.33e-01 | 0.1122 |
| 63893 | UBE2O | P15T-E | Human | Esophagus | ESCC | 1.08e-17 | 4.30e-01 | 0.1149 |
| 63893 | UBE2O | P16T-E | Human | Esophagus | ESCC | 1.37e-08 | 1.13e-01 | 0.1153 |
| 63893 | UBE2O | P20T-E | Human | Esophagus | ESCC | 2.73e-17 | 4.33e-01 | 0.1124 |
| 63893 | UBE2O | P21T-E | Human | Esophagus | ESCC | 6.90e-08 | 1.35e-01 | 0.1617 |
| 63893 | UBE2O | P22T-E | Human | Esophagus | ESCC | 5.33e-12 | 8.95e-02 | 0.1236 |
| 63893 | UBE2O | P23T-E | Human | Esophagus | ESCC | 1.89e-04 | 1.52e-01 | 0.108 |
| 63893 | UBE2O | P24T-E | Human | Esophagus | ESCC | 4.73e-08 | 9.11e-02 | 0.1287 |
| 63893 | UBE2O | P26T-E | Human | Esophagus | ESCC | 1.28e-11 | 1.92e-01 | 0.1276 |
| 63893 | UBE2O | P27T-E | Human | Esophagus | ESCC | 1.35e-05 | 8.14e-02 | 0.1055 |
| 63893 | UBE2O | P28T-E | Human | Esophagus | ESCC | 1.38e-20 | 3.91e-01 | 0.1149 |
| 63893 | UBE2O | P30T-E | Human | Esophagus | ESCC | 1.01e-09 | 2.64e-01 | 0.137 |
| Page: 1 2 3 |
| Tissue | Expression Dynamics | Abbreviation |
| Esophagus | 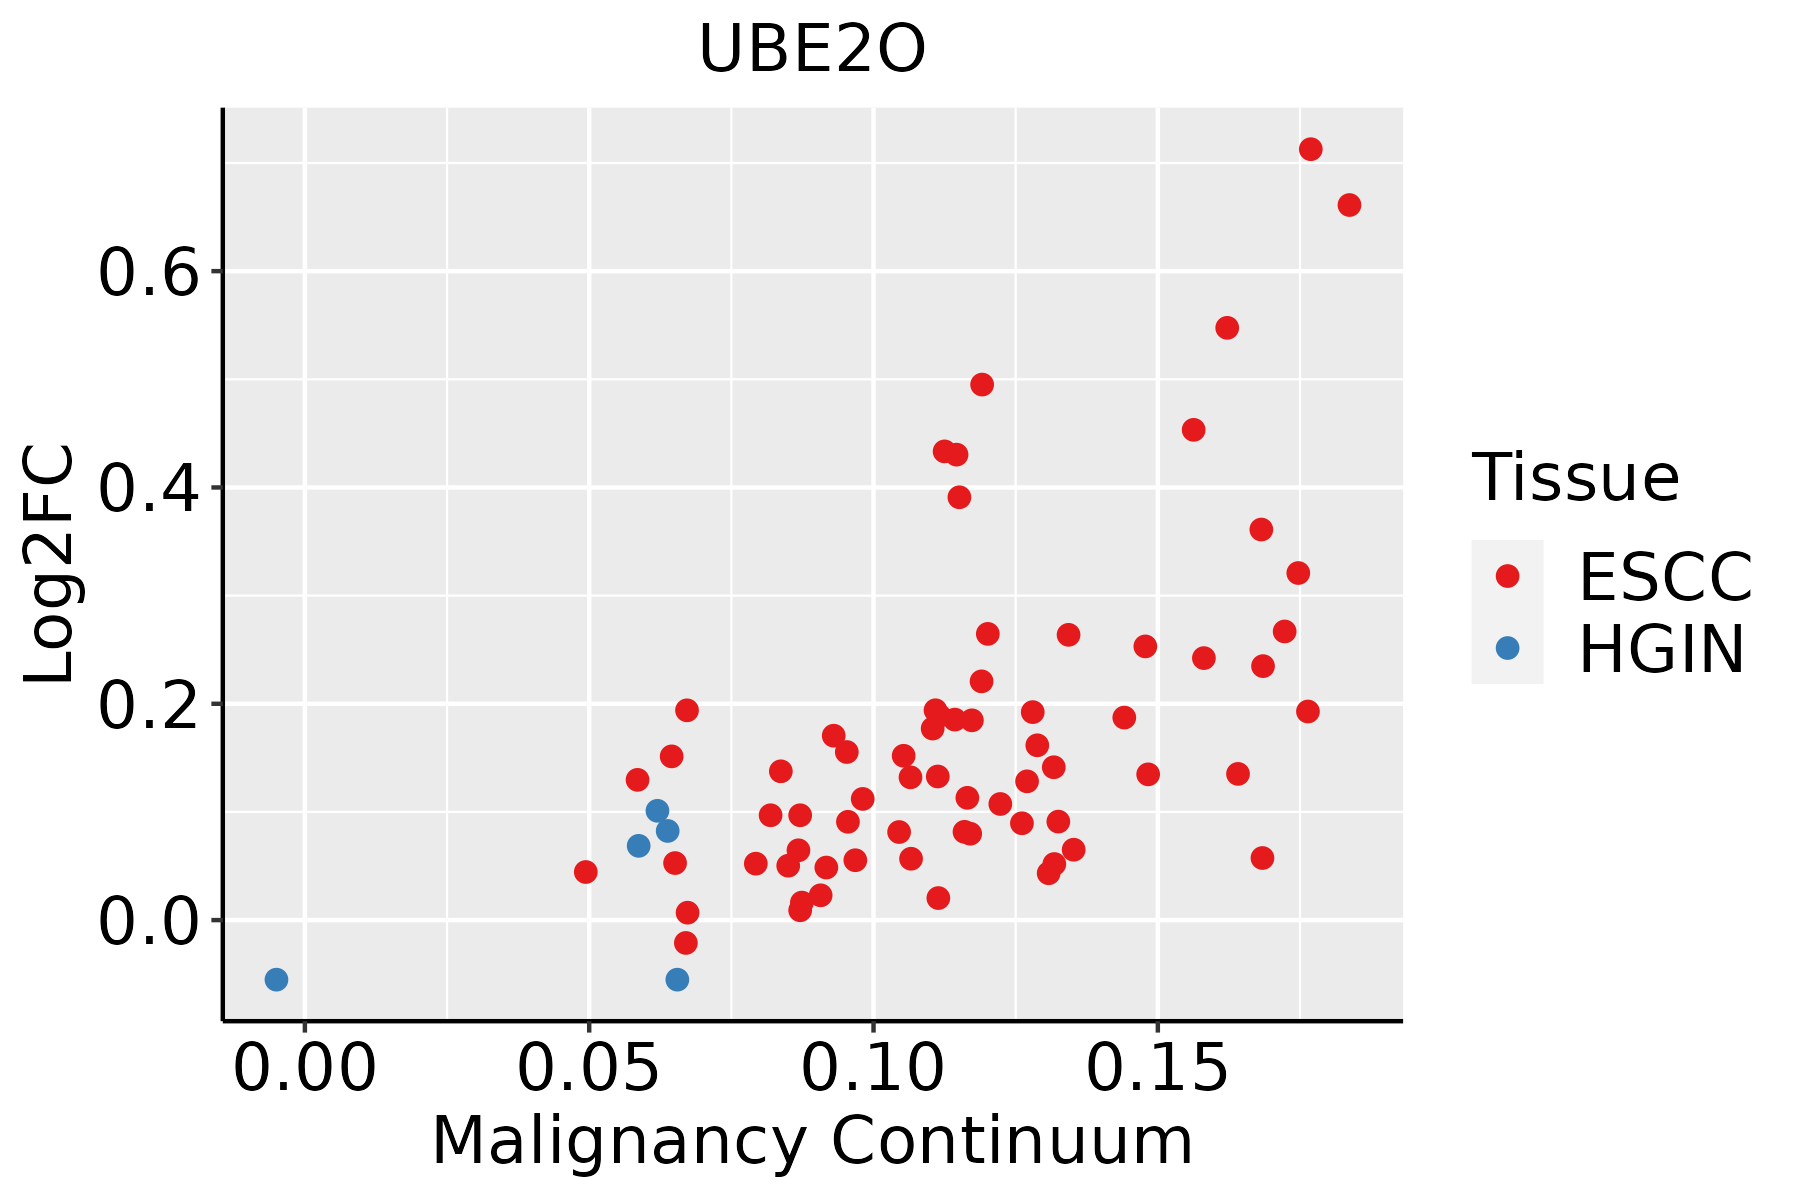 | ESCC: Esophageal squamous cell carcinoma |
| HGIN: High-grade intraepithelial neoplasias | ||
| LGIN: Low-grade intraepithelial neoplasias |
| ∗log2FC in expression of this searched gene in stem-like cells from each diseased tissue sample relative to stem-like cells in normal samples in each tissue plotted against the malignancy continuum. Samples are colored based on if they are from different disease stage. |
Top |
Malignant transformation related pathway analysis |
| Find out the enriched GO biological processes and KEGG pathways involved in transition from healthy to precancer to cancer |
| Tissue | Disease Stage | Enriched GO biological Processes |
| Colorectum | AD |  |
| Colorectum | SER |  |
| Colorectum | MSS |  |
| Colorectum | MSI-H |  |
| Colorectum | FAP |  |
| ∗Top 15 enriched GO BP terms are showed in the bar plot of each disease state in each tissue. Each row represents a significant GO biological process which is colored according to the -log10(p.adjust). |
| Page: 1 2 3 4 5 6 7 8 9 |
| GO ID | Tissue | Disease Stage | Description | Gene Ratio | Bg Ratio | pvalue | p.adjust | Count |
| GO:001619715 | Esophagus | ESCC | endosomal transport | 168/8552 | 230/18723 | 2.28e-17 | 1.93e-15 | 168 |
| GO:000020917 | Esophagus | ESCC | protein polyubiquitination | 170/8552 | 236/18723 | 1.40e-16 | 1.09e-14 | 170 |
| GO:001648210 | Esophagus | ESCC | cytosolic transport | 124/8552 | 168/18723 | 9.69e-14 | 4.69e-12 | 124 |
| GO:0052547111 | Esophagus | ESCC | regulation of peptidase activity | 275/8552 | 461/18723 | 7.54e-10 | 1.88e-08 | 275 |
| GO:00065136 | Esophagus | ESCC | protein monoubiquitination | 53/8552 | 67/18723 | 2.11e-08 | 4.03e-07 | 53 |
| GO:0052548111 | Esophagus | ESCC | regulation of endopeptidase activity | 253/8552 | 432/18723 | 3.68e-08 | 6.78e-07 | 253 |
| GO:007053413 | Esophagus | ESCC | protein K63-linked ubiquitination | 44/8552 | 56/18723 | 4.84e-07 | 6.50e-06 | 44 |
| GO:00421477 | Esophagus | ESCC | retrograde transport, endosome to Golgi | 63/8552 | 91/18723 | 4.58e-06 | 4.87e-05 | 63 |
| GO:0045861111 | Esophagus | ESCC | negative regulation of proteolysis | 195/8552 | 351/18723 | 1.13e-04 | 7.85e-04 | 195 |
| GO:0051346110 | Esophagus | ESCC | negative regulation of hydrolase activity | 208/8552 | 379/18723 | 1.76e-04 | 1.14e-03 | 208 |
| GO:000717810 | Esophagus | ESCC | transmembrane receptor protein serine/threonine kinase signaling pathway | 195/8552 | 355/18723 | 2.58e-04 | 1.58e-03 | 195 |
| GO:001046620 | Esophagus | ESCC | negative regulation of peptidase activity | 140/8552 | 262/18723 | 6.73e-03 | 2.46e-02 | 140 |
| GO:001095119 | Esophagus | ESCC | negative regulation of endopeptidase activity | 135/8552 | 252/18723 | 6.86e-03 | 2.51e-02 | 135 |
| Page: 1 |
| Pathway ID | Tissue | Disease Stage | Description | Gene Ratio | Bg Ratio | pvalue | p.adjust | qvalue | Count |
| Page: 1 |
Top |
Cell-cell communication analysis |
| Identification of potential cell-cell interactions between two cell types and their ligand-receptor pairs for different disease states |
| Ligand | Receptor | LRpair | Pathway | Tissue | Disease Stage |
| Page: 1 |
Top |
Single-cell gene regulatory network inference analysis |
| Find out the significant the regulons (TFs) and the target genes of each regulon across cell types for different disease states |
| TF | Cell Type | Tissue | Disease Stage | Target Gene | RSS | Regulon Activity |
| ∗The dot plots of a searched regulon are shown for all cell subpopulations in each disease state of each tissue based on the regulon specific score inferred using pySCENIC and by calculating the average expression. |
| Page: 1 |
Top |
Somatic mutation of malignant transformation related genes |
| Annotation of somatic variants for genes involved in malignant transformation |
| Hugo Symbol | Variant Class | Variant Classification | dbSNP RS | HGVSc | HGVSp | HGVSp Short | SWISSPROT | BIOTYPE | SIFT | PolyPhen | Tumor Sample Barcode | Tissue | Histology | Sex | Age | Stage | Therapy Types | Drugs | Outcome |
| UBE2O | SNV | Missense_Mutation | rs756925063 | c.3821N>T | p.Thr1274Met | p.T1274M | Q9C0C9 | protein_coding | tolerated_low_confidence(0.1) | benign(0) | TCGA-A8-A079-01 | Breast | breast invasive carcinoma | Female | >=65 | III/IV | Chemotherapy | 5-fluorouracil | SD |
| UBE2O | SNV | Missense_Mutation | novel | c.985N>C | p.Thr329Pro | p.T329P | Q9C0C9 | protein_coding | tolerated(0.09) | benign(0.001) | TCGA-AR-A0TY-01 | Breast | breast invasive carcinoma | Female | <65 | I/II | Unspecific | Paclitaxel | PD |
| UBE2O | SNV | Missense_Mutation | c.955N>A | p.Asp319Asn | p.D319N | Q9C0C9 | protein_coding | tolerated(0.11) | probably_damaging(0.977) | TCGA-BH-A18G-01 | Breast | breast invasive carcinoma | Female | >=65 | I/II | Unknown | Unknown | SD | |
| UBE2O | SNV | Missense_Mutation | c.2535G>C | p.Glu845Asp | p.E845D | Q9C0C9 | protein_coding | tolerated(0.07) | probably_damaging(0.935) | TCGA-D8-A27G-01 | Breast | breast invasive carcinoma | Female | >=65 | I/II | Unknown | Unknown | SD | |
| UBE2O | SNV | Missense_Mutation | novel | c.3041N>T | p.Ala1014Val | p.A1014V | Q9C0C9 | protein_coding | tolerated(0.07) | possibly_damaging(0.881) | TCGA-LD-A66U-01 | Breast | breast invasive carcinoma | Female | <65 | I/II | Chemotherapy | adriamycin | SD |
| UBE2O | SNV | Missense_Mutation | novel | c.3040N>T | p.Ala1014Ser | p.A1014S | Q9C0C9 | protein_coding | tolerated(0.34) | benign(0.303) | TCGA-LD-A66U-01 | Breast | breast invasive carcinoma | Female | <65 | I/II | Chemotherapy | adriamycin | SD |
| UBE2O | insertion | Frame_Shift_Ins | novel | c.1833_1834insGGGCTCTCCTTCCCTC | p.His612GlyfsTer41 | p.H612Gfs*41 | Q9C0C9 | protein_coding | TCGA-AN-A04A-01 | Breast | breast invasive carcinoma | Female | <65 | III/IV | Unknown | Unknown | SD | ||
| UBE2O | insertion | Frame_Shift_Ins | novel | c.1831_1832insCTAC | p.Asp611AlafsTer38 | p.D611Afs*38 | Q9C0C9 | protein_coding | TCGA-AN-A04A-01 | Breast | breast invasive carcinoma | Female | <65 | III/IV | Unknown | Unknown | SD | ||
| UBE2O | insertion | In_Frame_Ins | novel | c.601_602insCGCCCAGGGGGA | p.Gly201delinsAlaProArgGlyArg | p.G201delinsAPRGR | Q9C0C9 | protein_coding | TCGA-AO-A0JJ-01 | Breast | breast invasive carcinoma | Female | <65 | I/II | Chemotherapy | cyclophospamide | SD | ||
| UBE2O | insertion | Nonsense_Mutation | novel | c.599_600insAGATTGCCTGGGAATGTCCAGAAAAAAAC | p.Tyr200Ter | p.Y200* | Q9C0C9 | protein_coding | TCGA-AO-A0JJ-01 | Breast | breast invasive carcinoma | Female | <65 | I/II | Chemotherapy | cyclophospamide | SD |
| Page: 1 2 3 4 5 6 7 8 9 10 11 |
Top |
Related drugs of malignant transformation related genes |
| Identification of chemicals and drugs interact with genes involved in malignant transfromation |
| (DGIdb 4.0) |
| Entrez ID | Symbol | Category | Interaction Types | Drug Claim Name | Drug Name | PMIDs |
| Page: 1 |

Copyright 2023-Present -The University of Texas Health Science Center at Houston |