| Tissue | Expression Dynamics | Abbreviation |
| Breast | 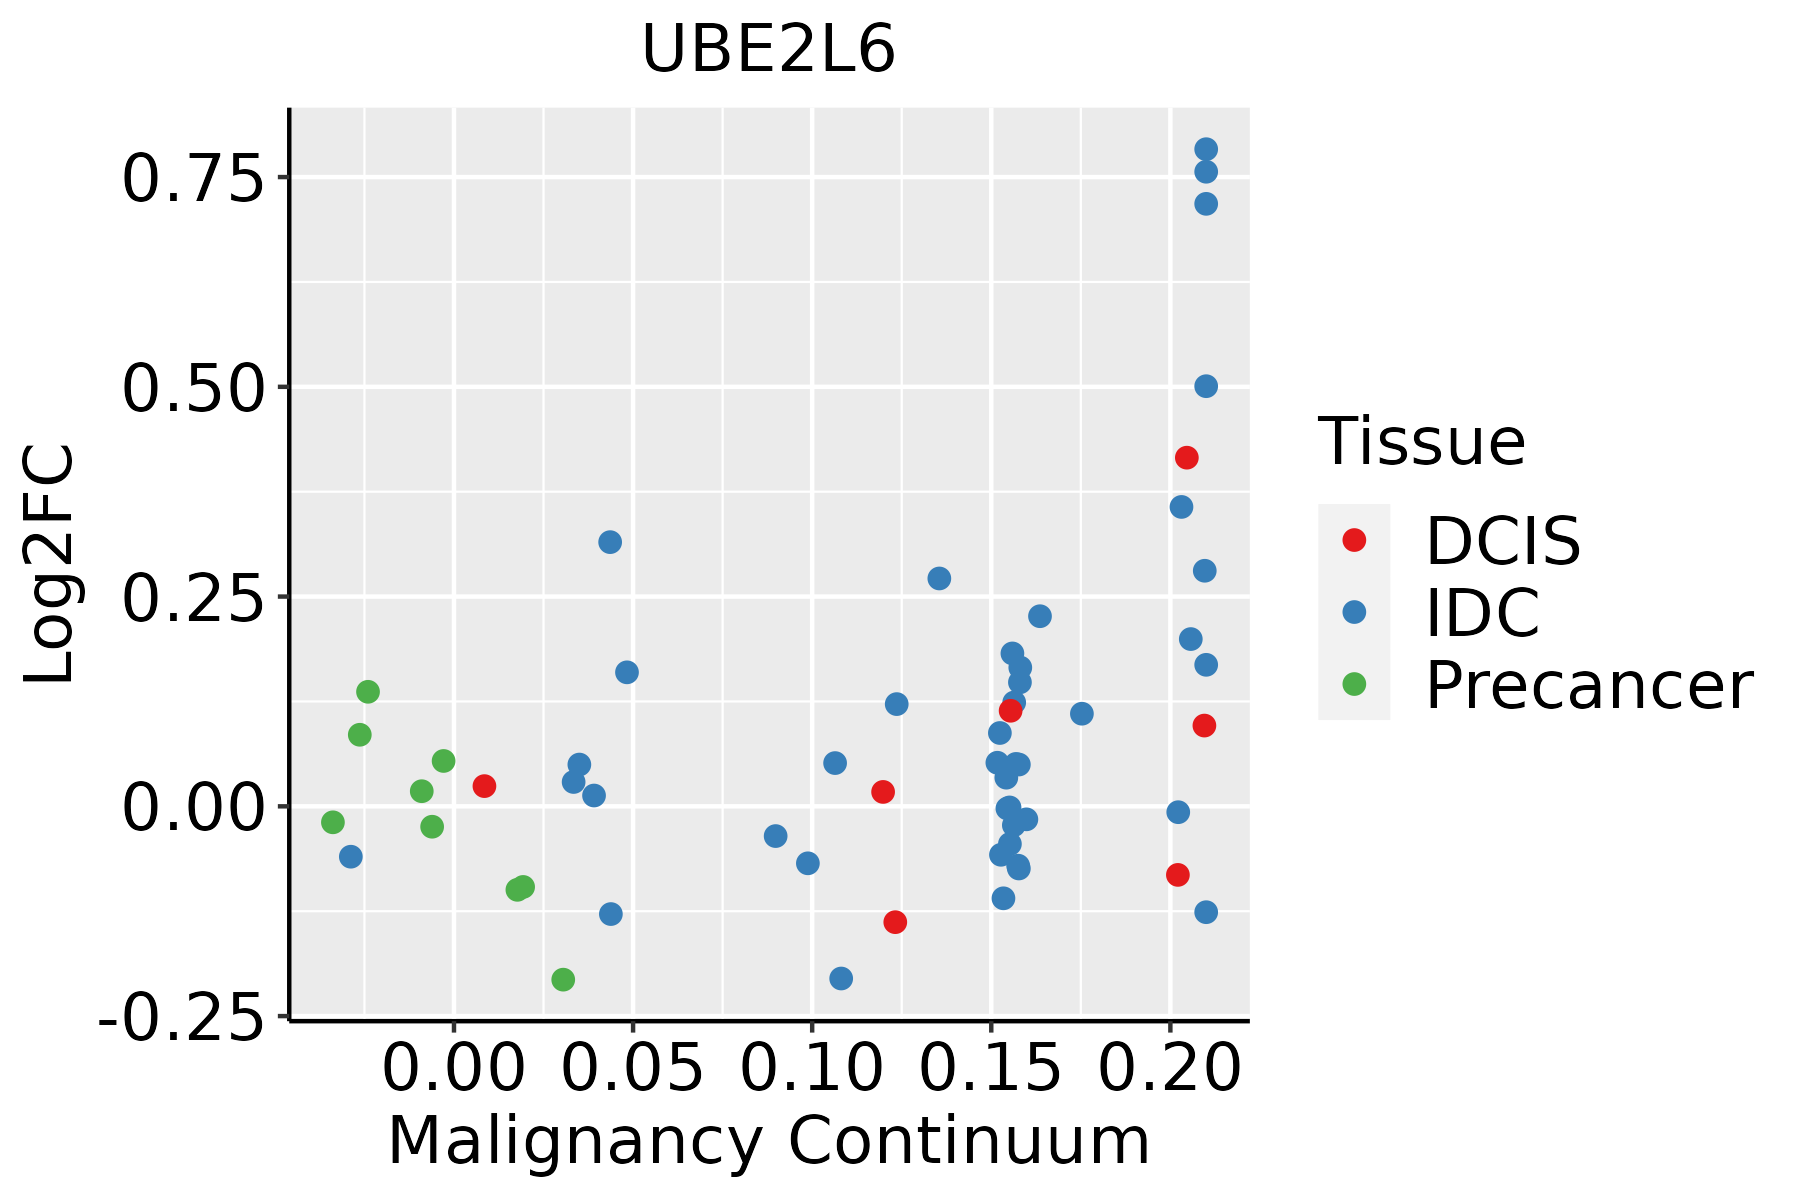 | IDC: Invasive ductal carcinoma |
| DCIS: Ductal carcinoma in situ |
| Precancer(BRCA1-mut): Precancerous lesion from BRCA1 mutation carriers |
| Cervix | 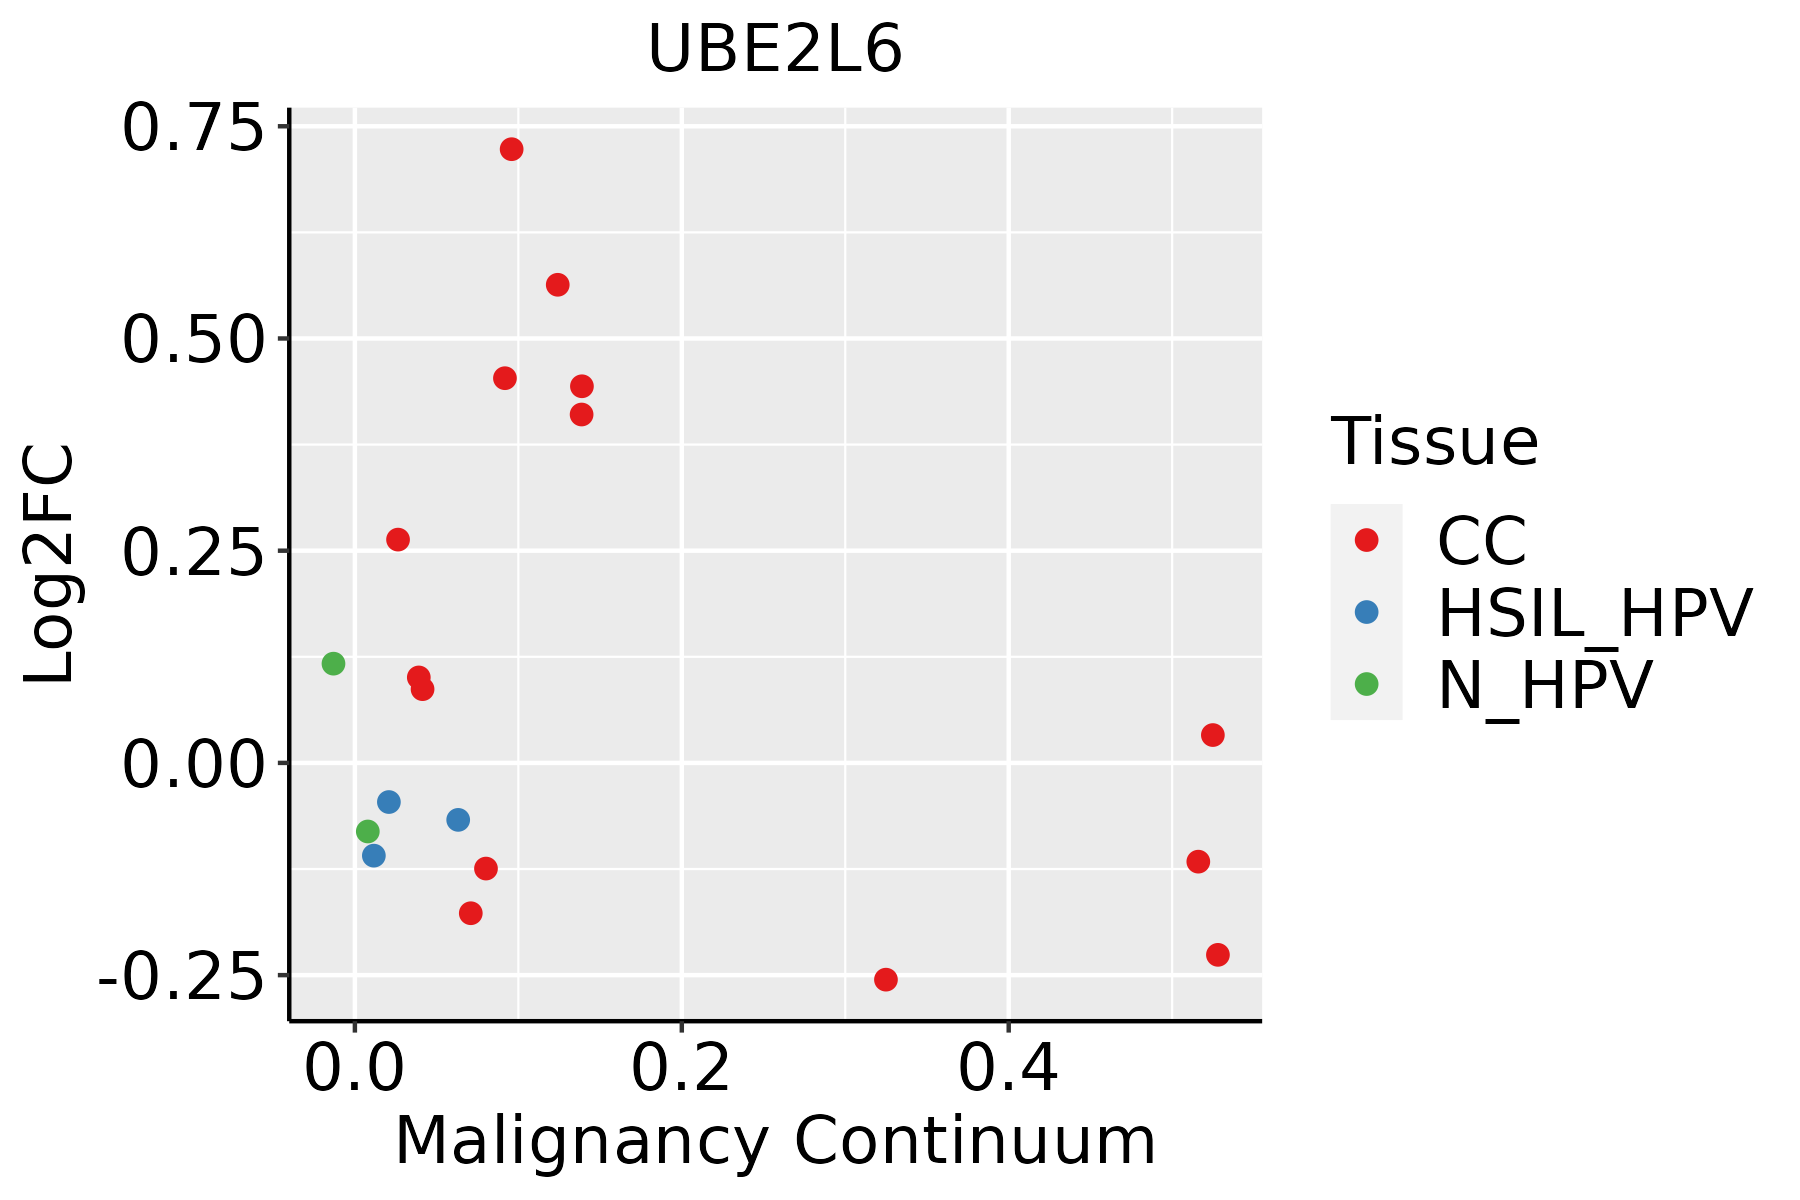 | CC: Cervix cancer |
| HSIL_HPV: HPV-infected high-grade squamous intraepithelial lesions |
| N_HPV: HPV-infected normal cervix |
| Esophagus | 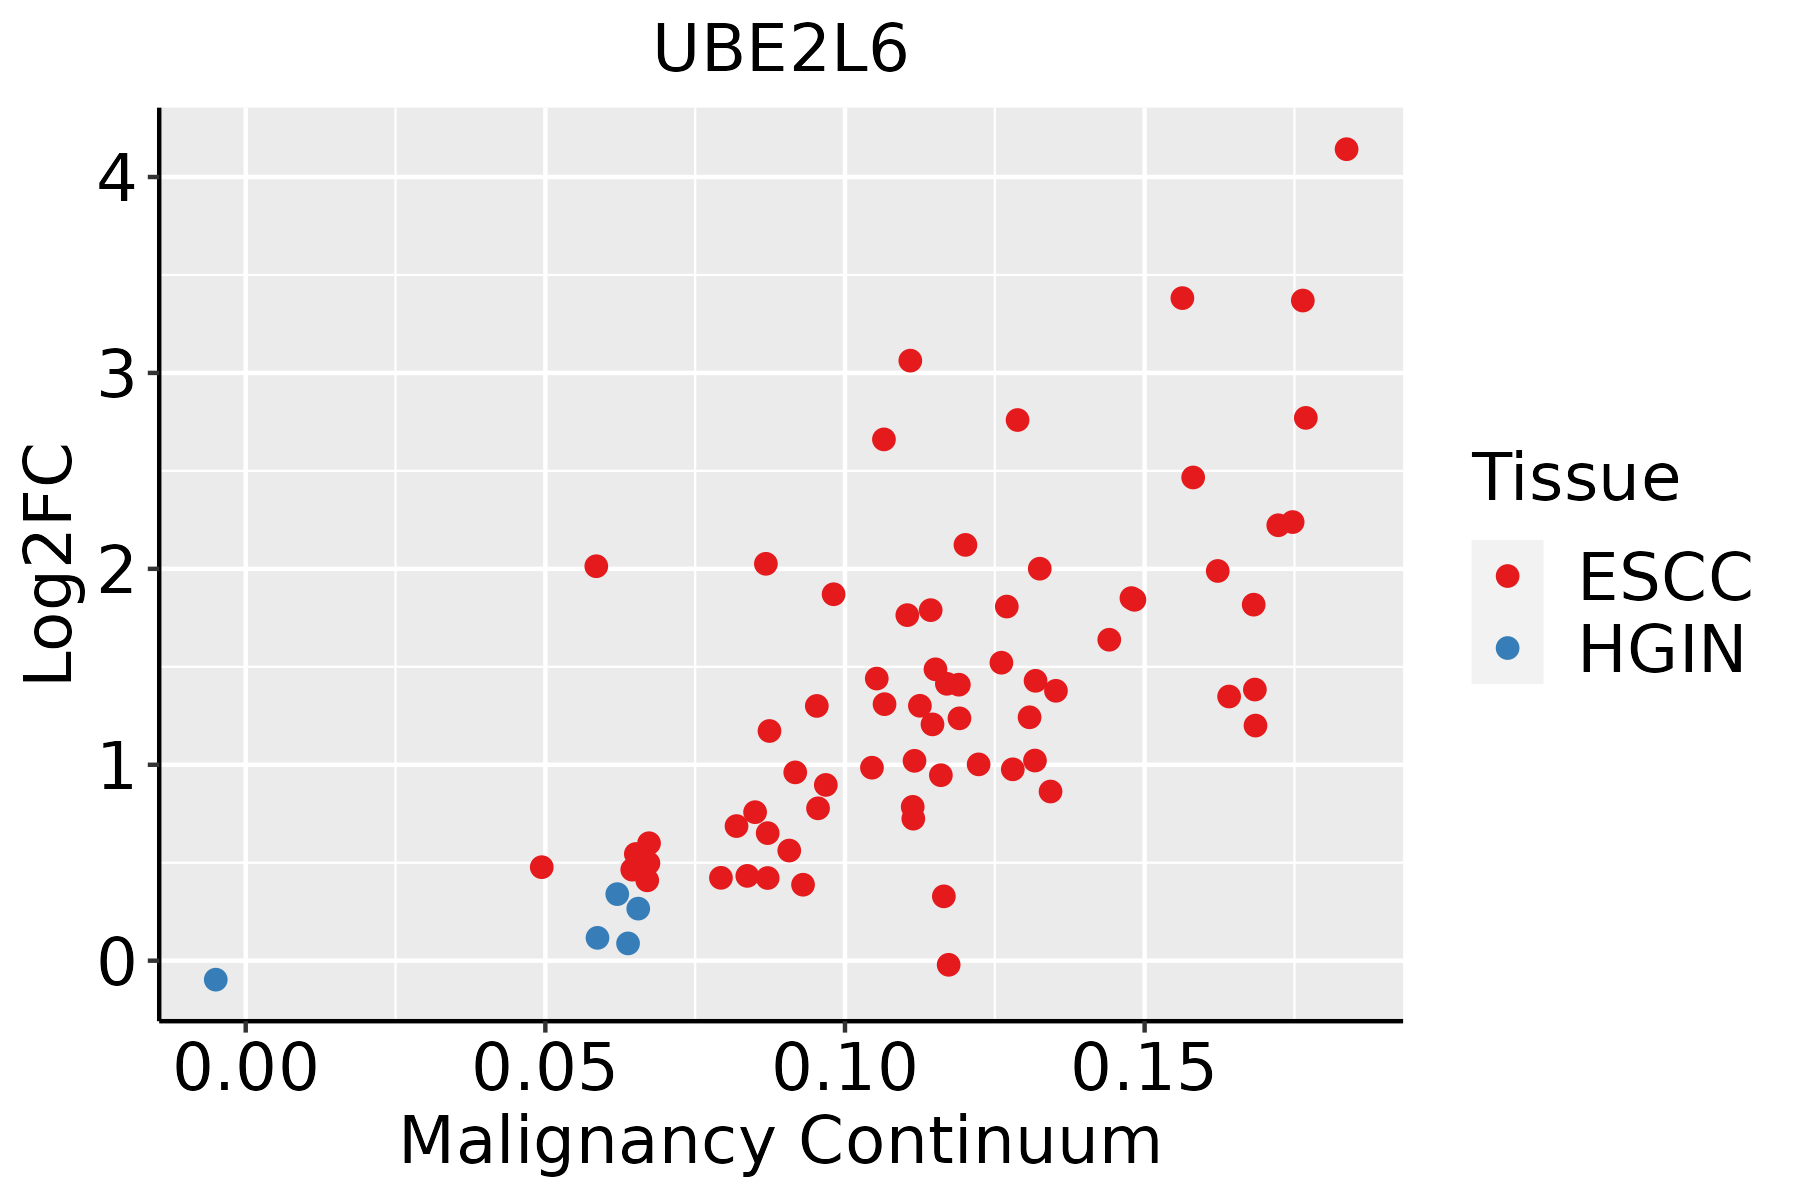 | ESCC: Esophageal squamous cell carcinoma |
| HGIN: High-grade intraepithelial neoplasias |
| LGIN: Low-grade intraepithelial neoplasias |
| Liver | 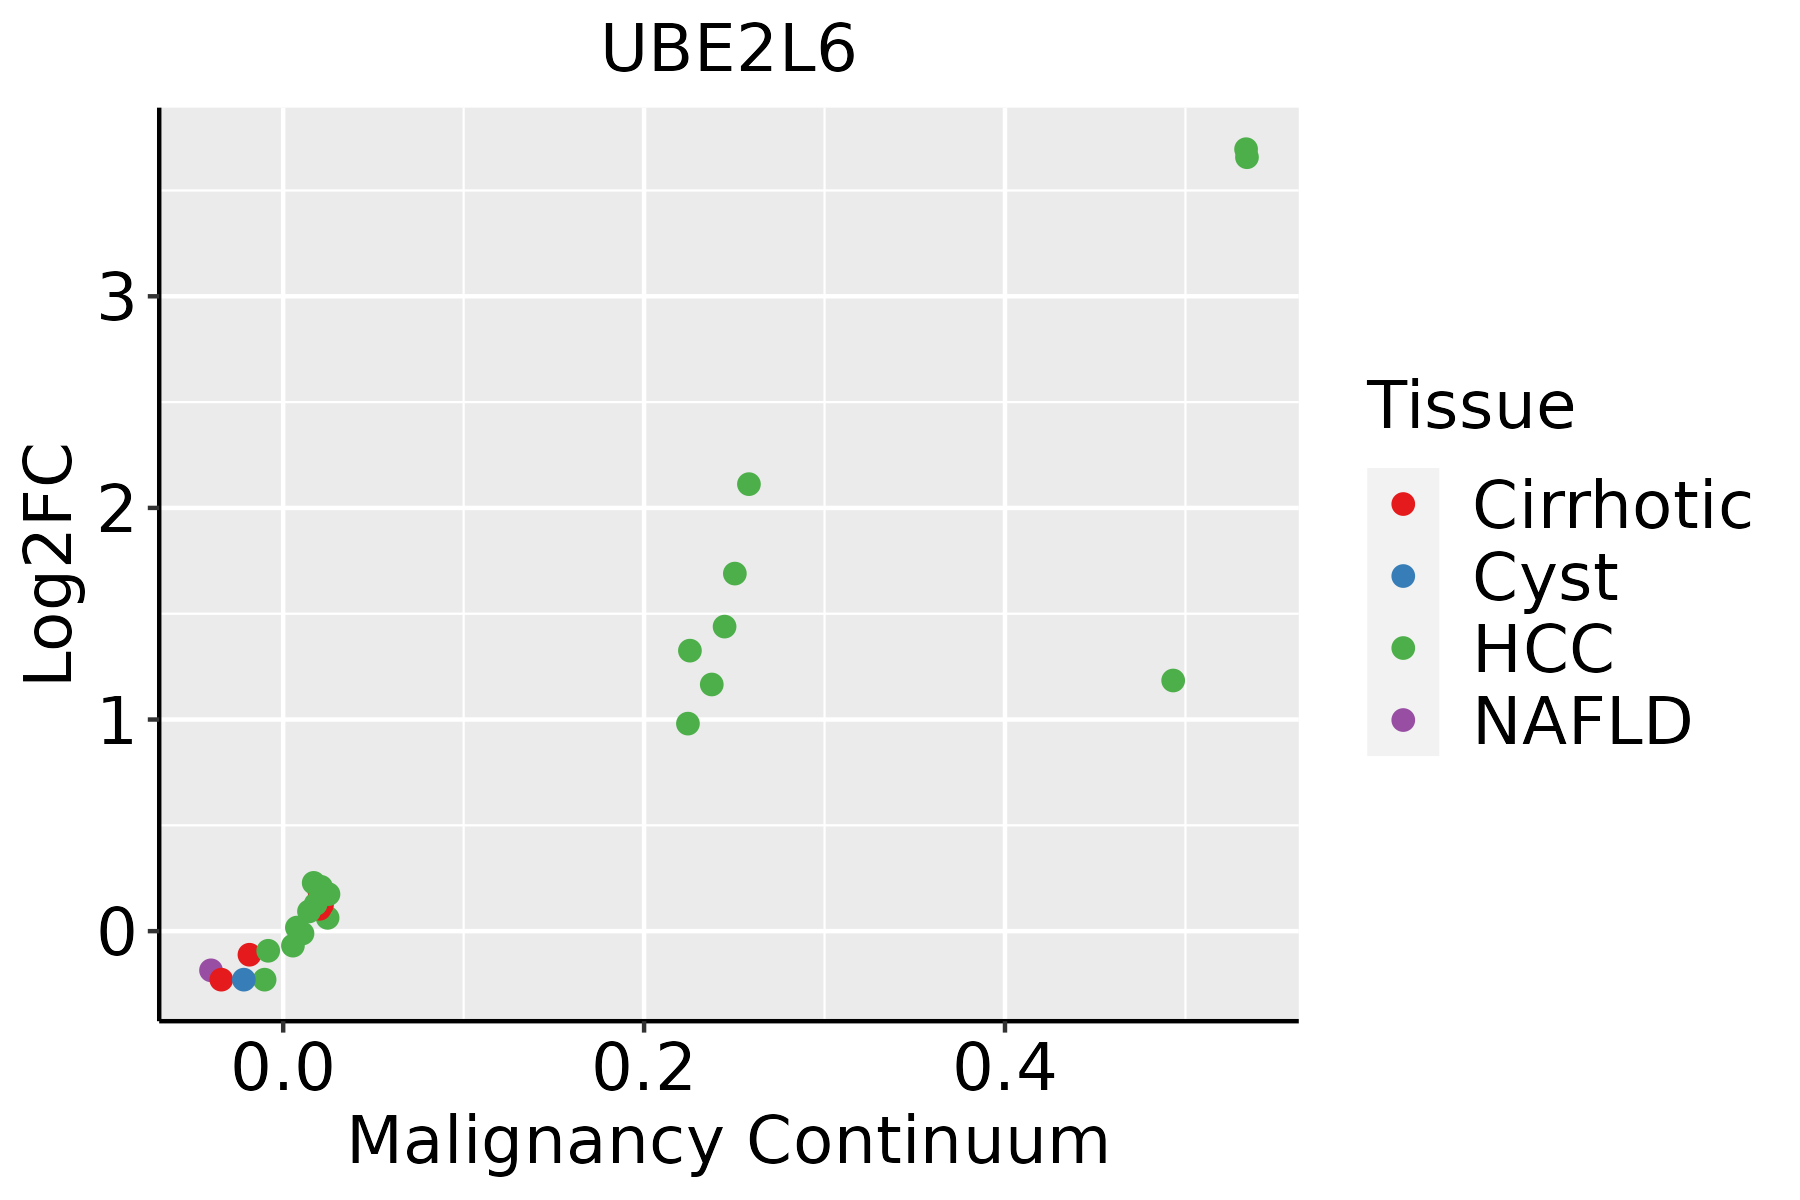 | HCC: Hepatocellular carcinoma |
| NAFLD: Non-alcoholic fatty liver disease |
| Oral Cavity |  | EOLP: Erosive Oral lichen planus |
| LP: leukoplakia |
| NEOLP: Non-erosive oral lichen planus |
| OSCC: Oral squamous cell carcinoma |
| Skin |  | AK: Actinic keratosis |
| cSCC: Cutaneous squamous cell carcinoma |
| SCCIS:squamous cell carcinoma in situ |
| Thyroid |  | ATC: Anaplastic thyroid cancer |
| HT: Hashimoto's thyroiditis |
| PTC: Papillary thyroid cancer |
| GO ID | Tissue | Disease Stage | Description | Gene Ratio | Bg Ratio | pvalue | p.adjust | Count |
| GO:00002097 | Cervix | CC | protein polyubiquitination | 58/2311 | 236/18723 | 1.57e-07 | 7.41e-06 | 58 |
| GO:000020916 | Esophagus | HGIN | protein polyubiquitination | 58/2587 | 236/18723 | 6.29e-06 | 1.97e-04 | 58 |
| GO:000020917 | Esophagus | ESCC | protein polyubiquitination | 170/8552 | 236/18723 | 1.40e-16 | 1.09e-14 | 170 |
| GO:000020911 | Liver | Cirrhotic | protein polyubiquitination | 89/4634 | 236/18723 | 6.09e-06 | 9.80e-05 | 89 |
| GO:000020921 | Liver | HCC | protein polyubiquitination | 151/7958 | 236/18723 | 1.90e-11 | 7.59e-10 | 151 |
| GO:000020910 | Oral cavity | OSCC | protein polyubiquitination | 150/7305 | 236/18723 | 1.59e-14 | 9.27e-13 | 150 |
| GO:000020915 | Oral cavity | LP | protein polyubiquitination | 82/4623 | 236/18723 | 3.23e-04 | 3.26e-03 | 82 |
| GO:000020924 | Skin | cSCC | protein polyubiquitination | 103/4864 | 236/18723 | 2.57e-09 | 9.09e-08 | 103 |
| GO:000020920 | Thyroid | PTC | protein polyubiquitination | 128/5968 | 236/18723 | 7.81e-13 | 3.65e-11 | 128 |
| GO:0000209110 | Thyroid | ATC | protein polyubiquitination | 134/6293 | 236/18723 | 1.86e-13 | 9.20e-12 | 134 |
| Pathway ID | Tissue | Disease Stage | Description | Gene Ratio | Bg Ratio | pvalue | p.adjust | qvalue | Count |
| hsa0501224 | Breast | IDC | Parkinson disease | 107/867 | 266/8465 | 2.57e-39 | 8.36e-37 | 6.26e-37 | 107 |
| hsa0502223 | Breast | IDC | Pathways of neurodegeneration - multiple diseases | 116/867 | 476/8465 | 3.63e-20 | 1.18e-18 | 8.82e-19 | 116 |
| hsa0501234 | Breast | IDC | Parkinson disease | 107/867 | 266/8465 | 2.57e-39 | 8.36e-37 | 6.26e-37 | 107 |
| hsa0502233 | Breast | IDC | Pathways of neurodegeneration - multiple diseases | 116/867 | 476/8465 | 3.63e-20 | 1.18e-18 | 8.82e-19 | 116 |
| hsa0501243 | Breast | DCIS | Parkinson disease | 106/846 | 266/8465 | 1.64e-39 | 5.29e-37 | 3.90e-37 | 106 |
| hsa0502243 | Breast | DCIS | Pathways of neurodegeneration - multiple diseases | 114/846 | 476/8465 | 4.74e-20 | 1.53e-18 | 1.13e-18 | 114 |
| hsa0501253 | Breast | DCIS | Parkinson disease | 106/846 | 266/8465 | 1.64e-39 | 5.29e-37 | 3.90e-37 | 106 |
| hsa0502253 | Breast | DCIS | Pathways of neurodegeneration - multiple diseases | 114/846 | 476/8465 | 4.74e-20 | 1.53e-18 | 1.13e-18 | 114 |
| hsa0501220 | Cervix | CC | Parkinson disease | 102/1267 | 266/8465 | 1.81e-21 | 1.47e-19 | 8.66e-20 | 102 |
| hsa0502218 | Cervix | CC | Pathways of neurodegeneration - multiple diseases | 128/1267 | 476/8465 | 2.87e-12 | 9.29e-11 | 5.50e-11 | 128 |
| hsa0412014 | Cervix | CC | Ubiquitin mediated proteolysis | 49/1267 | 142/8465 | 4.26e-09 | 7.68e-08 | 4.54e-08 | 49 |
| hsa05012110 | Cervix | CC | Parkinson disease | 102/1267 | 266/8465 | 1.81e-21 | 1.47e-19 | 8.66e-20 | 102 |
| hsa0502219 | Cervix | CC | Pathways of neurodegeneration - multiple diseases | 128/1267 | 476/8465 | 2.87e-12 | 9.29e-11 | 5.50e-11 | 128 |
| hsa0412015 | Cervix | CC | Ubiquitin mediated proteolysis | 49/1267 | 142/8465 | 4.26e-09 | 7.68e-08 | 4.54e-08 | 49 |
| hsa0501239 | Esophagus | HGIN | Parkinson disease | 124/1383 | 266/8465 | 5.95e-32 | 9.70e-30 | 7.70e-30 | 124 |
| hsa0502230 | Esophagus | HGIN | Pathways of neurodegeneration - multiple diseases | 153/1383 | 476/8465 | 1.22e-18 | 4.41e-17 | 3.50e-17 | 153 |
| hsa0412026 | Esophagus | HGIN | Ubiquitin mediated proteolysis | 49/1383 | 142/8465 | 7.78e-08 | 1.33e-06 | 1.06e-06 | 49 |
| hsa05012114 | Esophagus | HGIN | Parkinson disease | 124/1383 | 266/8465 | 5.95e-32 | 9.70e-30 | 7.70e-30 | 124 |
| hsa05022113 | Esophagus | HGIN | Pathways of neurodegeneration - multiple diseases | 153/1383 | 476/8465 | 1.22e-18 | 4.41e-17 | 3.50e-17 | 153 |
| hsa04120111 | Esophagus | HGIN | Ubiquitin mediated proteolysis | 49/1383 | 142/8465 | 7.78e-08 | 1.33e-06 | 1.06e-06 | 49 |
| Hugo Symbol | Variant Class | Variant Classification | dbSNP RS | HGVSc | HGVSp | HGVSp Short | SWISSPROT | BIOTYPE | SIFT | PolyPhen | Tumor Sample Barcode | Tissue | Histology | Sex | Age | Stage | Therapy Types | Drugs | Outcome |
| UBE2L6 | SNV | Missense_Mutation | | c.277G>C | p.Glu93Gln | p.E93Q | O14933 | protein_coding | tolerated(0.06) | benign(0.026) | TCGA-AC-A23H-01 | Breast | breast invasive carcinoma | Female | >=65 | I/II | Unknown | Unknown | PD |
| UBE2L6 | SNV | Missense_Mutation | | c.133N>G | p.Pro45Ala | p.P45A | O14933 | protein_coding | deleterious(0) | probably_damaging(0.999) | TCGA-E9-A22E-01 | Breast | breast invasive carcinoma | Female | <65 | III/IV | Chemotherapy | cyclophosphane | SD |
| UBE2L6 | SNV | Missense_Mutation | rs770937454 | c.437G>A | p.Arg146Gln | p.R146Q | O14933 | protein_coding | tolerated(0.24) | benign(0) | TCGA-AJ-A5DW-01 | Endometrium | uterine corpus endometrioid carcinoma | Female | <65 | I/II | Unknown | Unknown | SD |
| UBE2L6 | SNV | Missense_Mutation | | c.310N>T | p.Val104Phe | p.V104F | O14933 | protein_coding | deleterious(0) | probably_damaging(0.98) | TCGA-AP-A051-01 | Endometrium | uterine corpus endometrioid carcinoma | Female | >=65 | I/II | Unknown | Unknown | SD |
| UBE2L6 | SNV | Missense_Mutation | | c.154A>G | p.Asn52Asp | p.N52D | O14933 | protein_coding | deleterious(0.02) | benign(0.055) | TCGA-AX-A0J0-01 | Endometrium | uterine corpus endometrioid carcinoma | Female | <65 | I/II | Unknown | Unknown | SD |
| UBE2L6 | SNV | Missense_Mutation | novel | c.289N>T | p.Pro97Ser | p.P97S | O14933 | protein_coding | deleterious(0) | possibly_damaging(0.682) | TCGA-B5-A3FC-01 | Endometrium | uterine corpus endometrioid carcinoma | Female | <65 | I/II | Unknown | Unknown | SD |
| UBE2L6 | SNV | Missense_Mutation | rs868642148 | c.398N>T | p.Pro133Leu | p.P133L | O14933 | protein_coding | tolerated(0.47) | benign(0.058) | TCGA-BG-A0VW-01 | Endometrium | uterine corpus endometrioid carcinoma | Female | >=65 | I/II | Unknown | Unknown | SD |
| UBE2L6 | SNV | Missense_Mutation | | c.48N>T | p.Lys16Asn | p.K16N | O14933 | protein_coding | tolerated(0.18) | benign(0.007) | TCGA-BS-A0UF-01 | Endometrium | uterine corpus endometrioid carcinoma | Female | >=65 | I/II | Unknown | Unknown | SD |
| UBE2L6 | SNV | Missense_Mutation | novel | c.210N>A | p.Phe70Leu | p.F70L | O14933 | protein_coding | deleterious(0.02) | probably_damaging(0.998) | TCGA-EO-A22R-01 | Endometrium | uterine corpus endometrioid carcinoma | Female | <65 | I/II | Unknown | Unknown | SD |
| UBE2L6 | SNV | Missense_Mutation | rs199916226 | c.148N>A | p.Ala50Thr | p.A50T | O14933 | protein_coding | deleterious(0) | probably_damaging(1) | TCGA-EO-A22X-01 | Endometrium | uterine corpus endometrioid carcinoma | Female | <65 | III/IV | Unspecific | Carboplatin | Complete Response |


