| Tissue | Expression Dynamics | Abbreviation |
| Colorectum (GSE201348) |  | FAP: Familial adenomatous polyposis |
| CRC: Colorectal cancer |
| Colorectum (HTA11) |  | AD: Adenomas |
| SER: Sessile serrated lesions |
| MSI-H: Microsatellite-high colorectal cancer |
| MSS: Microsatellite stable colorectal cancer |
| Esophagus | 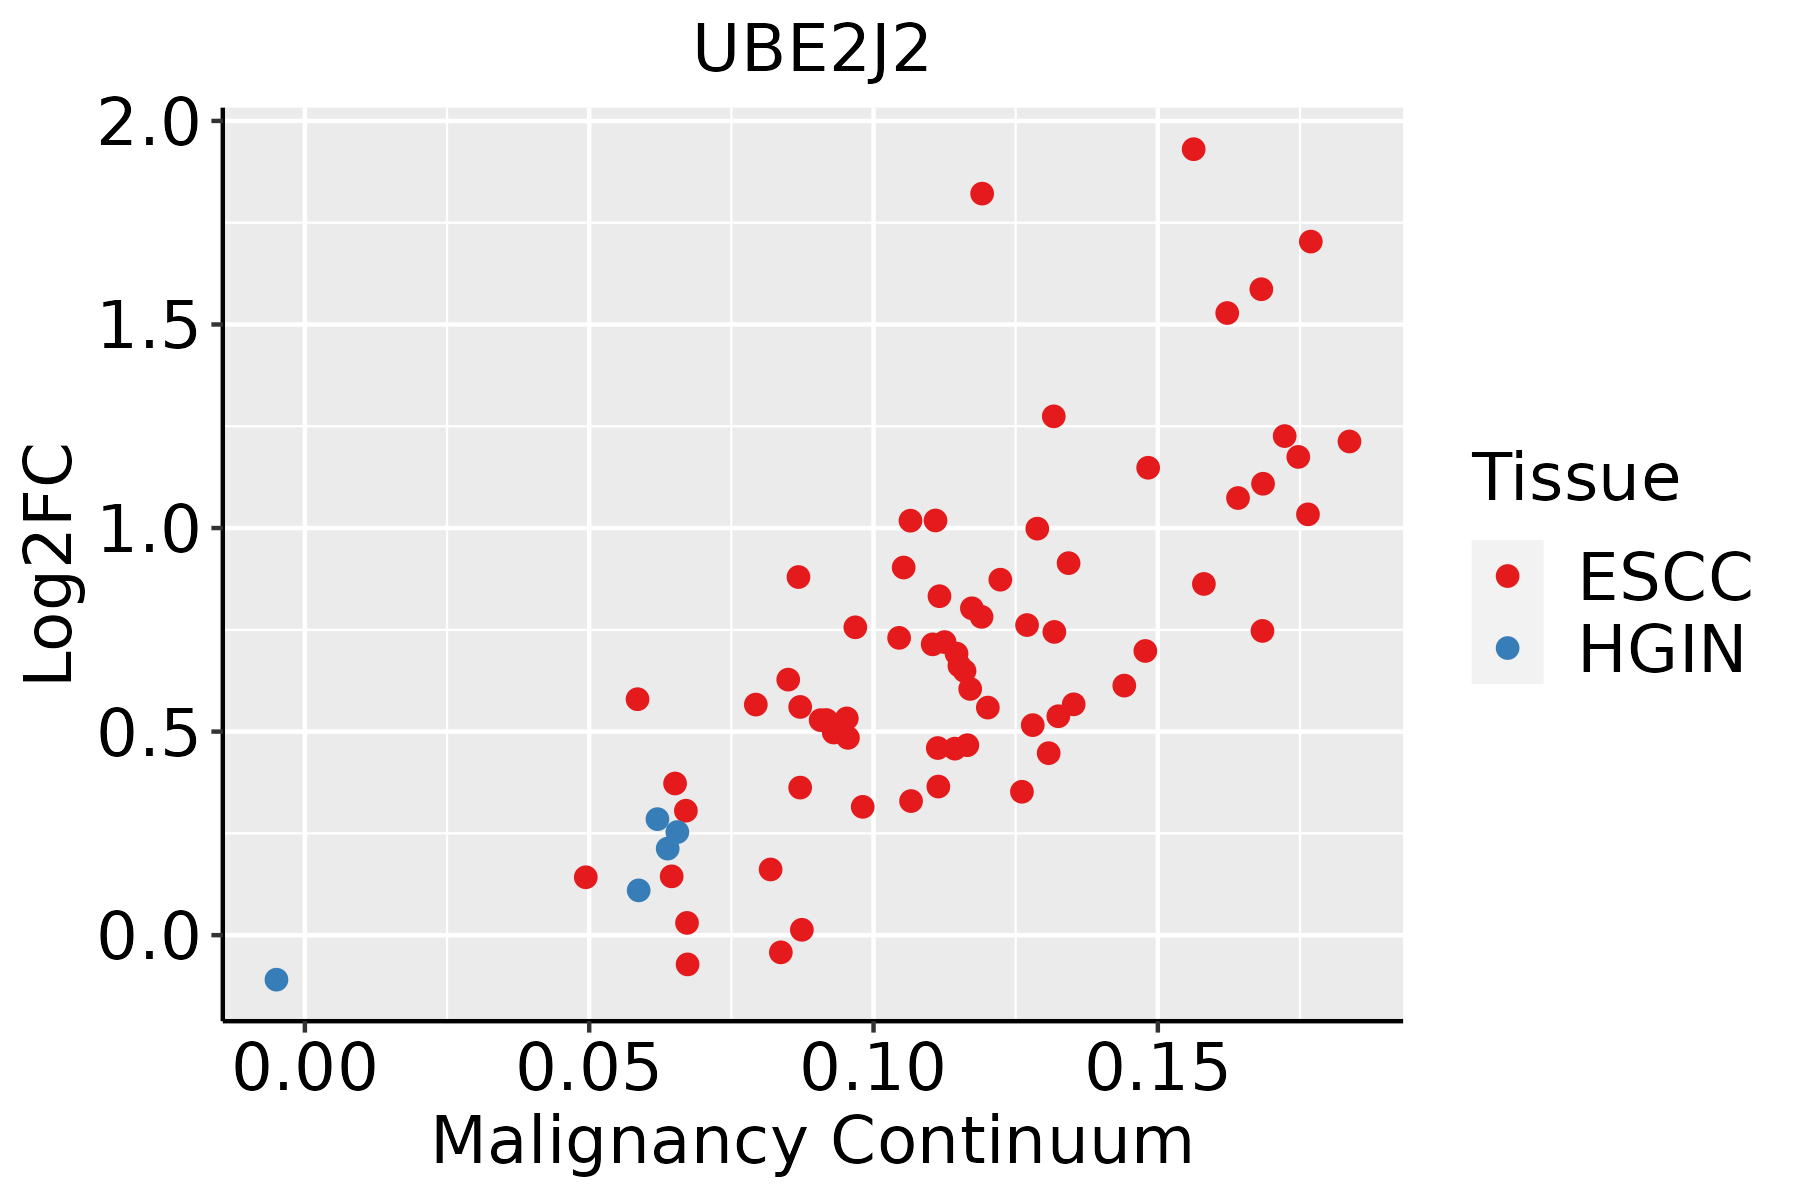 | ESCC: Esophageal squamous cell carcinoma |
| HGIN: High-grade intraepithelial neoplasias |
| LGIN: Low-grade intraepithelial neoplasias |
| Liver |  | HCC: Hepatocellular carcinoma |
| NAFLD: Non-alcoholic fatty liver disease |
| Oral Cavity | 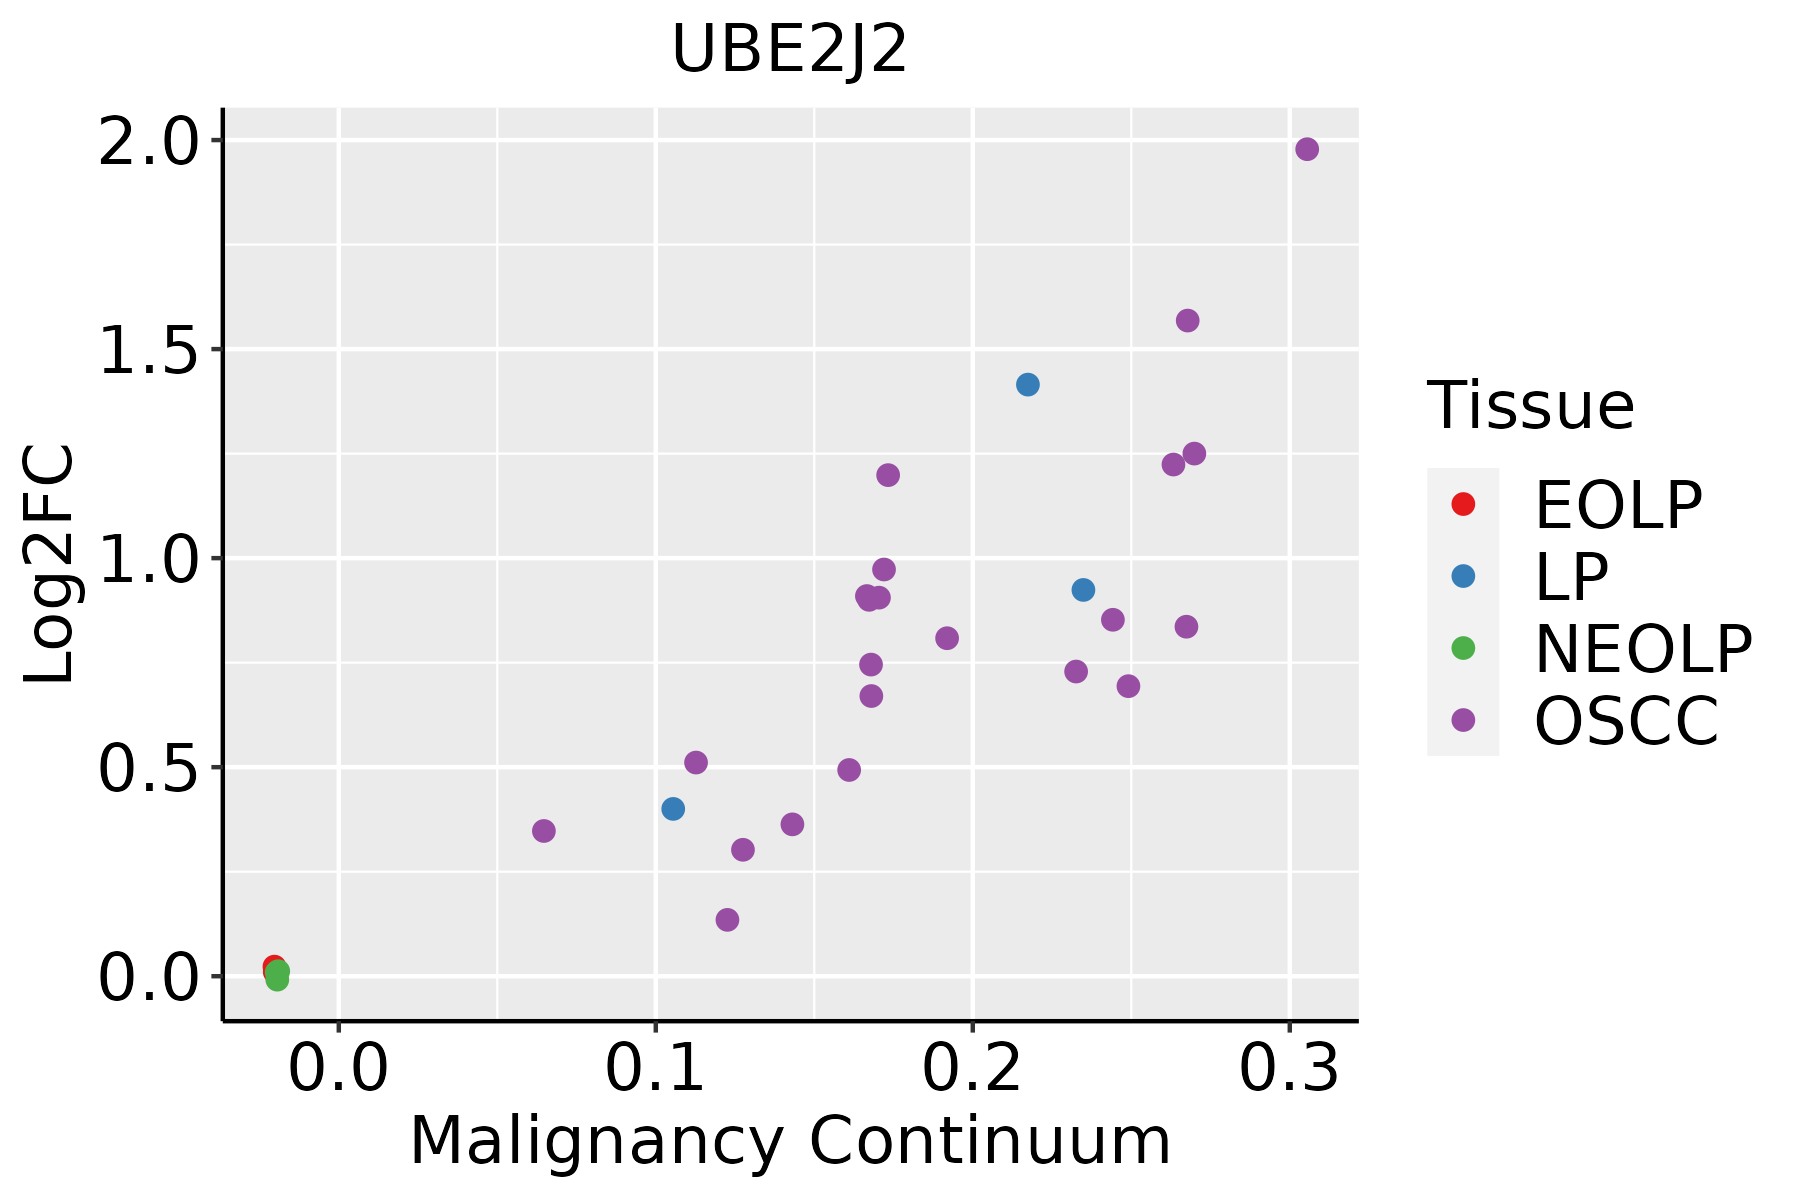 | EOLP: Erosive Oral lichen planus |
| LP: leukoplakia |
| NEOLP: Non-erosive oral lichen planus |
| OSCC: Oral squamous cell carcinoma |
| Skin | 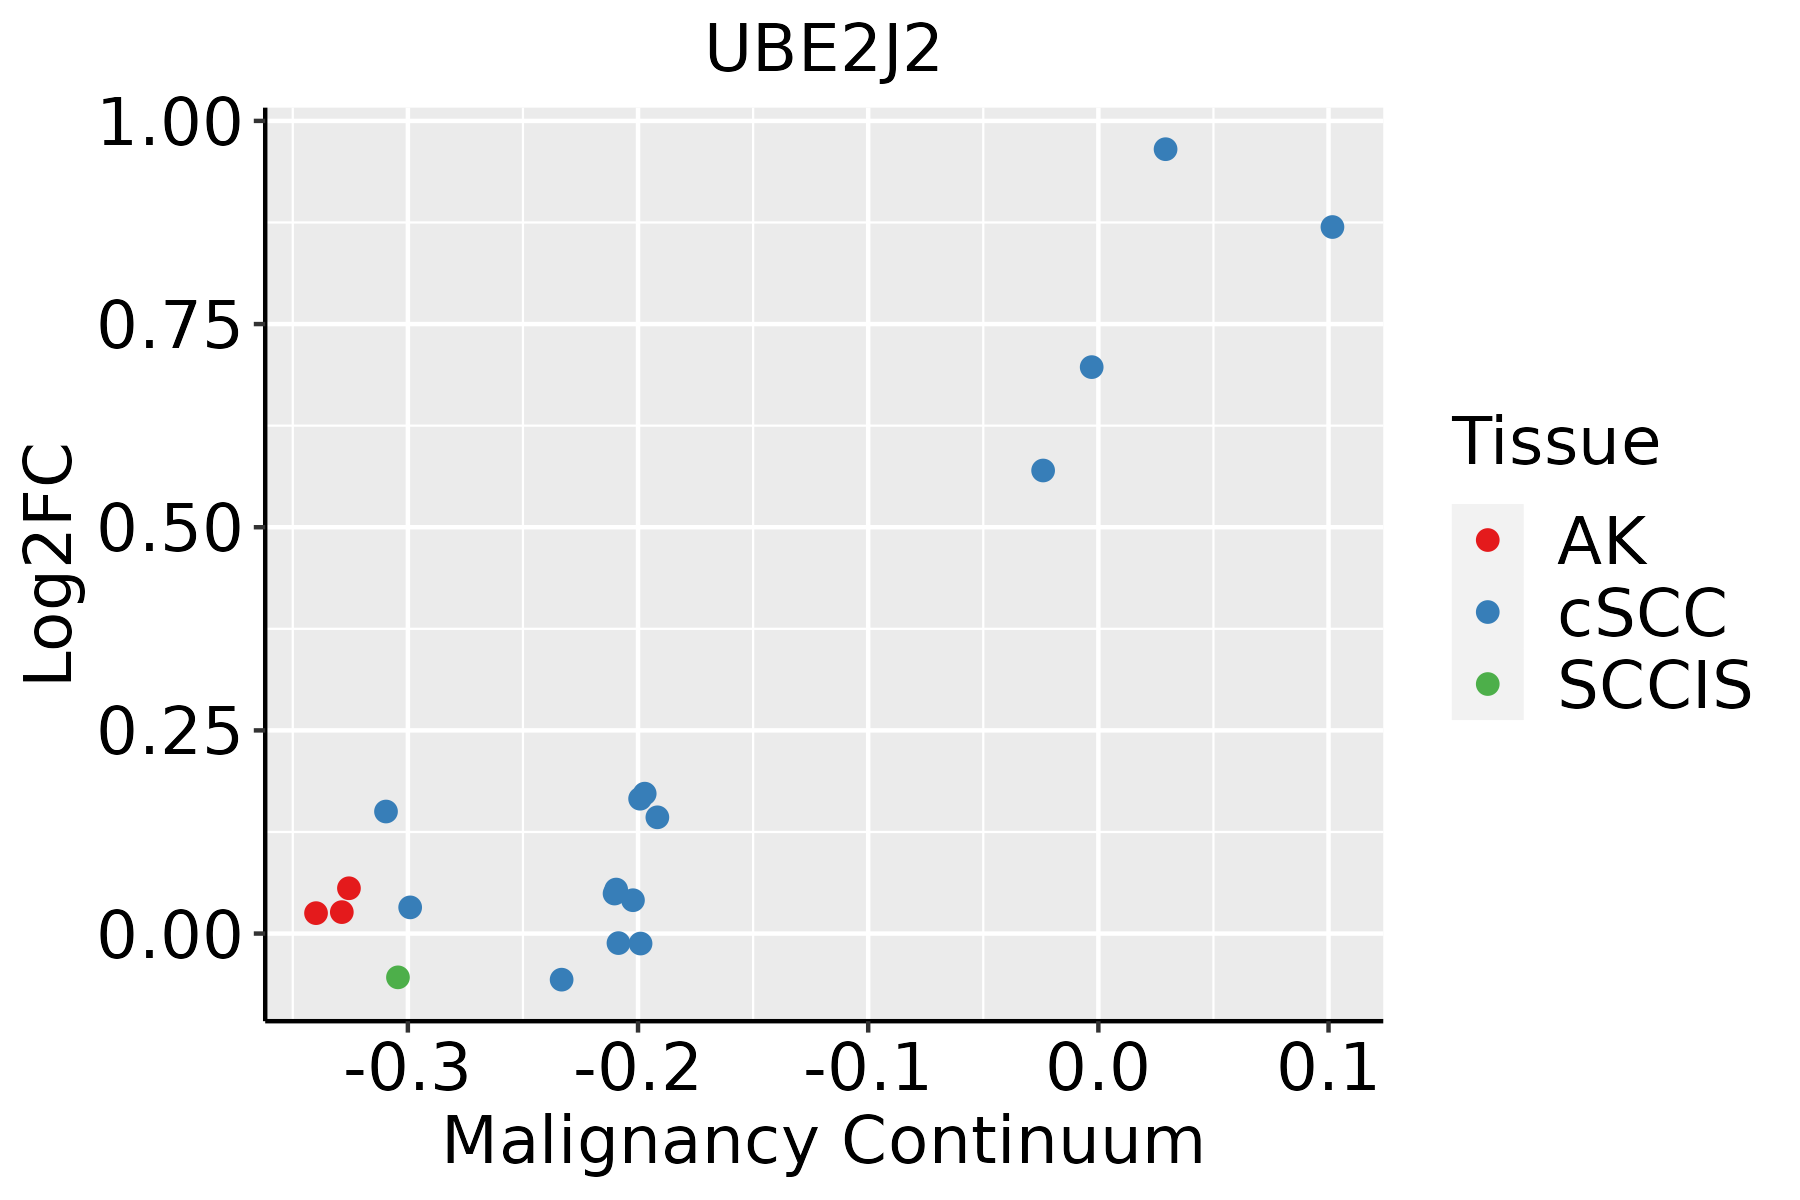 | AK: Actinic keratosis |
| cSCC: Cutaneous squamous cell carcinoma |
| SCCIS:squamous cell carcinoma in situ |
| Thyroid | 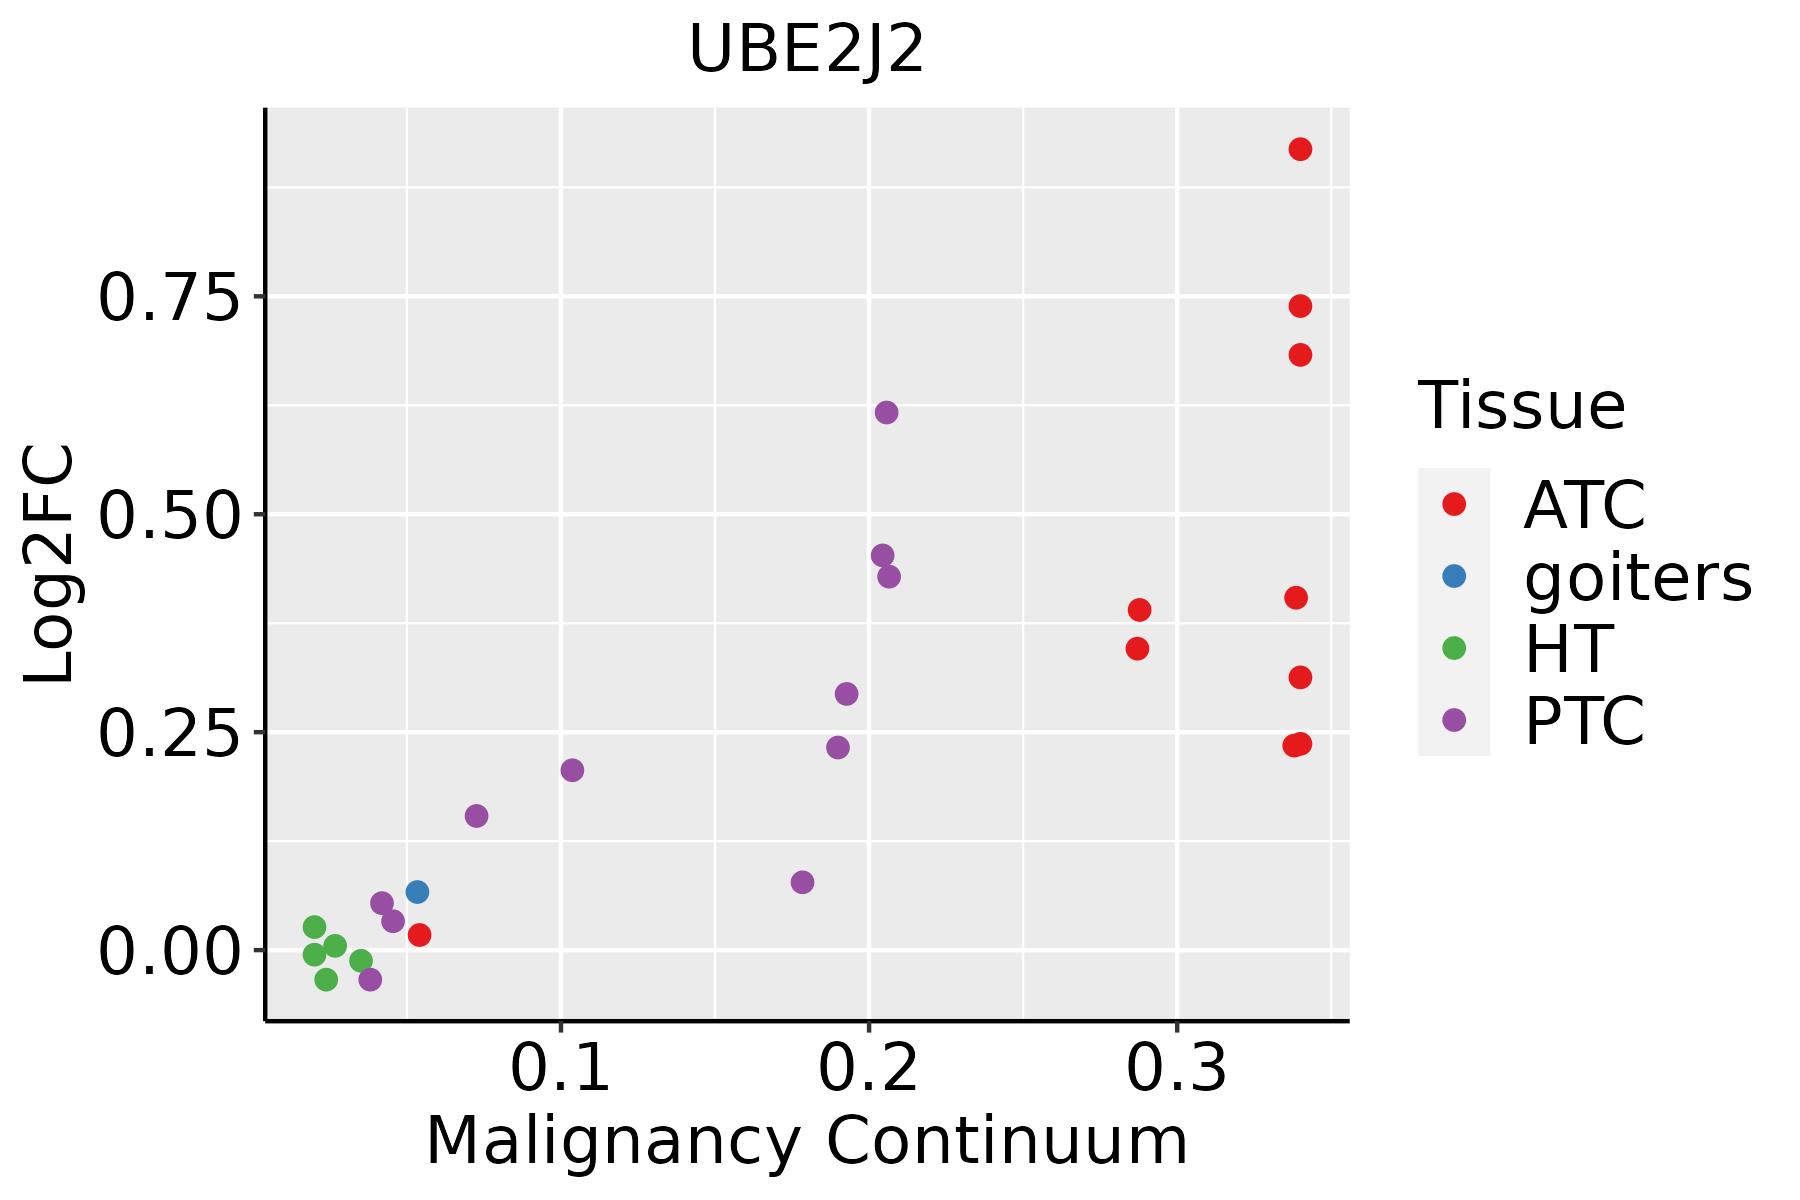 | ATC: Anaplastic thyroid cancer |
| HT: Hashimoto's thyroiditis |
| PTC: Papillary thyroid cancer |
| GO ID | Tissue | Disease Stage | Description | Gene Ratio | Bg Ratio | pvalue | p.adjust | Count |
| GO:0010498 | Colorectum | AD | proteasomal protein catabolic process | 174/3918 | 490/18723 | 3.18e-14 | 7.66e-12 | 174 |
| GO:1903829 | Colorectum | AD | positive regulation of cellular protein localization | 110/3918 | 276/18723 | 4.58e-13 | 8.44e-11 | 110 |
| GO:0006839 | Colorectum | AD | mitochondrial transport | 102/3918 | 254/18723 | 1.87e-12 | 3.08e-10 | 102 |
| GO:0072594 | Colorectum | AD | establishment of protein localization to organelle | 148/3918 | 422/18723 | 7.95e-12 | 1.04e-09 | 148 |
| GO:0043161 | Colorectum | AD | proteasome-mediated ubiquitin-dependent protein catabolic process | 141/3918 | 412/18723 | 1.77e-10 | 1.68e-08 | 141 |
| GO:1904951 | Colorectum | AD | positive regulation of establishment of protein localization | 112/3918 | 319/18723 | 2.55e-09 | 1.80e-07 | 112 |
| GO:0051222 | Colorectum | AD | positive regulation of protein transport | 106/3918 | 303/18723 | 8.45e-09 | 5.08e-07 | 106 |
| GO:0034976 | Colorectum | AD | response to endoplasmic reticulum stress | 90/3918 | 256/18723 | 8.48e-08 | 4.28e-06 | 90 |
| GO:0006605 | Colorectum | AD | protein targeting | 105/3918 | 314/18723 | 1.39e-07 | 6.44e-06 | 105 |
| GO:0090316 | Colorectum | AD | positive regulation of intracellular protein transport | 62/3918 | 160/18723 | 1.82e-07 | 7.79e-06 | 62 |
| GO:0032388 | Colorectum | AD | positive regulation of intracellular transport | 74/3918 | 202/18723 | 1.83e-07 | 7.80e-06 | 74 |
| GO:0070585 | Colorectum | AD | protein localization to mitochondrion | 51/3918 | 125/18723 | 3.40e-07 | 1.33e-05 | 51 |
| GO:0032386 | Colorectum | AD | regulation of intracellular transport | 109/3918 | 337/18723 | 5.33e-07 | 1.95e-05 | 109 |
| GO:0033157 | Colorectum | AD | regulation of intracellular protein transport | 80/3918 | 229/18723 | 5.81e-07 | 2.09e-05 | 80 |
| GO:0072655 | Colorectum | AD | establishment of protein localization to mitochondrion | 47/3918 | 120/18723 | 3.76e-06 | 1.04e-04 | 47 |
| GO:0000209 | Colorectum | AD | protein polyubiquitination | 78/3918 | 236/18723 | 8.71e-06 | 2.06e-04 | 78 |
| GO:0035966 | Colorectum | AD | response to topologically incorrect protein | 54/3918 | 159/18723 | 8.85e-05 | 1.36e-03 | 54 |
| GO:0006626 | Colorectum | AD | protein targeting to mitochondrion | 37/3918 | 100/18723 | 1.58e-04 | 2.20e-03 | 37 |
| GO:1903533 | Colorectum | AD | regulation of protein targeting | 31/3918 | 81/18723 | 2.61e-04 | 3.25e-03 | 31 |
| GO:1903747 | Colorectum | AD | regulation of establishment of protein localization to mitochondrion | 21/3918 | 50/18723 | 5.97e-04 | 6.31e-03 | 21 |
| Pathway ID | Tissue | Disease Stage | Description | Gene Ratio | Bg Ratio | pvalue | p.adjust | qvalue | Count |
| hsa05012 | Colorectum | AD | Parkinson disease | 147/2092 | 266/8465 | 2.53e-27 | 8.48e-25 | 5.41e-25 | 147 |
| hsa05022 | Colorectum | AD | Pathways of neurodegeneration - multiple diseases | 201/2092 | 476/8465 | 4.54e-18 | 1.27e-16 | 8.09e-17 | 201 |
| hsa04141 | Colorectum | AD | Protein processing in endoplasmic reticulum | 80/2092 | 174/8465 | 5.96e-10 | 1.25e-08 | 7.96e-09 | 80 |
| hsa04120 | Colorectum | AD | Ubiquitin mediated proteolysis | 58/2092 | 142/8465 | 1.46e-05 | 1.53e-04 | 9.76e-05 | 58 |
| hsa050121 | Colorectum | AD | Parkinson disease | 147/2092 | 266/8465 | 2.53e-27 | 8.48e-25 | 5.41e-25 | 147 |
| hsa050221 | Colorectum | AD | Pathways of neurodegeneration - multiple diseases | 201/2092 | 476/8465 | 4.54e-18 | 1.27e-16 | 8.09e-17 | 201 |
| hsa041411 | Colorectum | AD | Protein processing in endoplasmic reticulum | 80/2092 | 174/8465 | 5.96e-10 | 1.25e-08 | 7.96e-09 | 80 |
| hsa041201 | Colorectum | AD | Ubiquitin mediated proteolysis | 58/2092 | 142/8465 | 1.46e-05 | 1.53e-04 | 9.76e-05 | 58 |
| hsa050122 | Colorectum | SER | Parkinson disease | 132/1580 | 266/8465 | 2.72e-31 | 9.03e-29 | 6.55e-29 | 132 |
| hsa050222 | Colorectum | SER | Pathways of neurodegeneration - multiple diseases | 168/1580 | 476/8465 | 6.23e-19 | 2.07e-17 | 1.50e-17 | 168 |
| hsa041412 | Colorectum | SER | Protein processing in endoplasmic reticulum | 60/1580 | 174/8465 | 4.20e-07 | 7.33e-06 | 5.32e-06 | 60 |
| hsa041202 | Colorectum | SER | Ubiquitin mediated proteolysis | 39/1580 | 142/8465 | 6.18e-03 | 3.66e-02 | 2.66e-02 | 39 |
| hsa050123 | Colorectum | SER | Parkinson disease | 132/1580 | 266/8465 | 2.72e-31 | 9.03e-29 | 6.55e-29 | 132 |
| hsa050223 | Colorectum | SER | Pathways of neurodegeneration - multiple diseases | 168/1580 | 476/8465 | 6.23e-19 | 2.07e-17 | 1.50e-17 | 168 |
| hsa041413 | Colorectum | SER | Protein processing in endoplasmic reticulum | 60/1580 | 174/8465 | 4.20e-07 | 7.33e-06 | 5.32e-06 | 60 |
| hsa041203 | Colorectum | SER | Ubiquitin mediated proteolysis | 39/1580 | 142/8465 | 6.18e-03 | 3.66e-02 | 2.66e-02 | 39 |
| hsa050124 | Colorectum | MSS | Parkinson disease | 140/1875 | 266/8465 | 2.32e-28 | 7.79e-26 | 4.77e-26 | 140 |
| hsa050224 | Colorectum | MSS | Pathways of neurodegeneration - multiple diseases | 192/1875 | 476/8465 | 2.79e-20 | 1.04e-18 | 6.36e-19 | 192 |
| hsa041414 | Colorectum | MSS | Protein processing in endoplasmic reticulum | 75/1875 | 174/8465 | 3.78e-10 | 8.44e-09 | 5.17e-09 | 75 |
| hsa041204 | Colorectum | MSS | Ubiquitin mediated proteolysis | 55/1875 | 142/8465 | 5.02e-06 | 6.00e-05 | 3.68e-05 | 55 |
| Hugo Symbol | Variant Class | Variant Classification | dbSNP RS | HGVSc | HGVSp | HGVSp Short | SWISSPROT | BIOTYPE | SIFT | PolyPhen | Tumor Sample Barcode | Tissue | Histology | Sex | Age | Stage | Therapy Types | Drugs | Outcome |
| UBE2J2 | SNV | Missense_Mutation | | c.785N>T | p.Ala262Val | p.A262V | Q8N2K1 | protein_coding | deleterious(0.03) | probably_damaging(0.998) | TCGA-A2-A04P-01 | Breast | breast invasive carcinoma | Female | <65 | III/IV | Chemotherapy | taxol | PD |
| UBE2J2 | SNV | Missense_Mutation | | c.689N>A | p.Pro230Gln | p.P230Q | Q8N2K1 | protein_coding | tolerated(0.28) | benign(0.189) | TCGA-C8-A274-01 | Breast | breast invasive carcinoma | Female | <65 | I/II | Hormone Therapy | tamoxiphen | SD |
| UBE2J2 | insertion | In_Frame_Ins | novel | c.191_192insACTCAGGAGGCTGAGGCAGGAGAATCGCTTGAA | p.Val64_Arg65insLeuArgArgLeuArgGlnGluAsnArgLeuAsn | p.V64_R65insLRRLRQENRLN | Q8N2K1 | protein_coding | | | TCGA-A8-A09E-01 | Breast | breast invasive carcinoma | Female | >=65 | III/IV | Hormone Therapy | anastrozole | SD |
| UBE2J2 | deletion | Frame_Shift_Del | novel | c.670delC | p.His224MetfsTer31 | p.H224Mfs*31 | Q8N2K1 | protein_coding | | | TCGA-EW-A2FV-01 | Breast | breast invasive carcinoma | Female | <65 | III/IV | Chemotherapy | docetaxel | SD |
| UBE2J2 | SNV | Missense_Mutation | rs146718362 | c.581G>A | p.Ser194Asn | p.S194N | Q8N2K1 | protein_coding | tolerated(0.3) | benign(0) | TCGA-DS-A1OB-01 | Cervix | cervical & endocervical cancer | Female | <65 | I/II | Chemotherapy | carboplatin | PD |
| UBE2J2 | SNV | Missense_Mutation | | c.83C>T | p.Pro28Leu | p.P28L | Q8N2K1 | protein_coding | deleterious(0.03) | probably_damaging(0.934) | TCGA-IR-A3LL-01 | Cervix | cervical & endocervical cancer | Female | <65 | I/II | Chemotherapy | cisplatin | CR |
| UBE2J2 | insertion | Frame_Shift_Ins | novel | c.348_349insATCGCAGGGGCTCTGGACCCCAGCTGCCCACAGTT | p.His117IlefsTer27 | p.H117Ifs*27 | Q8N2K1 | protein_coding | | | TCGA-IR-A3LB-01 | Cervix | cervical & endocervical cancer | Female | <65 | I/II | Chemotherapy | cisplatin | PD |
| UBE2J2 | SNV | Missense_Mutation | | c.610N>T | p.Asp204Tyr | p.D204Y | Q8N2K1 | protein_coding | deleterious(0) | possibly_damaging(0.659) | TCGA-AA-3672-01 | Colorectum | colon adenocarcinoma | Female | >=65 | III/IV | Unknown | Unknown | SD |
| UBE2J2 | SNV | Missense_Mutation | | c.364A>G | p.Asn122Asp | p.N122D | Q8N2K1 | protein_coding | deleterious(0.02) | benign(0.378) | TCGA-AA-A02R-01 | Colorectum | colon adenocarcinoma | Female | >=65 | I/II | Unknown | Unknown | PD |
| UBE2J2 | SNV | Missense_Mutation | | c.287N>C | p.Met96Thr | p.M96T | Q8N2K1 | protein_coding | tolerated(0.05) | benign(0.248) | TCGA-D5-6540-01 | Colorectum | colon adenocarcinoma | Male | >=65 | I/II | Unknown | Unknown | SD |


