
|
|||||
|
 | |
| |
| |
| |
| |
| |
|
Gene: UBE2G1 |
Gene summary for UBE2G1 |
| Gene information | Species | Human | Gene symbol | UBE2G1 | Gene ID | 7326 |
| Gene name | ubiquitin conjugating enzyme E2 G1 | |
| Gene Alias | E217K | |
| Cytomap | 17p13.2 | |
| Gene Type | protein-coding | GO ID | GO:0000209 | UniProtAcc | P62253 |
Top |
Malignant transformation analysis |
| Identification of the aberrant gene expression in precancerous and cancerous lesions by comparing the gene expression of stem-like cells in diseased tissues with normal stem cells |
| Entrez ID | Symbol | Replicates | Species | Organ | Tissue | Adj P-value | Log2FC | Malignancy |
| 7326 | UBE2G1 | HTA11_3410_2000001011 | Human | Colorectum | AD | 6.69e-09 | -4.76e-01 | 0.0155 |
| 7326 | UBE2G1 | HTA11_696_2000001011 | Human | Colorectum | AD | 1.36e-03 | -2.57e-01 | -0.1464 |
| 7326 | UBE2G1 | HTA11_866_2000001011 | Human | Colorectum | AD | 1.02e-04 | -3.03e-01 | -0.1001 |
| 7326 | UBE2G1 | HTA11_866_3004761011 | Human | Colorectum | AD | 2.18e-02 | -4.35e-01 | 0.096 |
| 7326 | UBE2G1 | HTA11_7696_3000711011 | Human | Colorectum | AD | 2.43e-03 | -2.98e-01 | 0.0674 |
| 7326 | UBE2G1 | HTA11_99999970781_79442 | Human | Colorectum | MSS | 5.13e-07 | -3.06e-01 | 0.294 |
| 7326 | UBE2G1 | HTA11_99999971662_82457 | Human | Colorectum | MSS | 5.72e-05 | -3.79e-01 | 0.3859 |
| 7326 | UBE2G1 | HTA11_99999974143_84620 | Human | Colorectum | MSS | 1.06e-11 | -4.21e-01 | 0.3005 |
| 7326 | UBE2G1 | A002-C-010 | Human | Colorectum | FAP | 1.58e-02 | -2.52e-01 | 0.242 |
| 7326 | UBE2G1 | A001-C-207 | Human | Colorectum | FAP | 9.21e-06 | -4.30e-01 | 0.1278 |
| 7326 | UBE2G1 | A015-C-203 | Human | Colorectum | FAP | 7.30e-27 | -4.59e-01 | -0.1294 |
| 7326 | UBE2G1 | A015-C-204 | Human | Colorectum | FAP | 6.33e-07 | -4.23e-01 | -0.0228 |
| 7326 | UBE2G1 | A014-C-040 | Human | Colorectum | FAP | 1.77e-03 | -5.36e-01 | -0.1184 |
| 7326 | UBE2G1 | A002-C-201 | Human | Colorectum | FAP | 4.76e-14 | -4.87e-01 | 0.0324 |
| 7326 | UBE2G1 | A002-C-203 | Human | Colorectum | FAP | 4.03e-05 | -2.91e-01 | 0.2786 |
| 7326 | UBE2G1 | A001-C-119 | Human | Colorectum | FAP | 5.40e-03 | -3.07e-01 | -0.1557 |
| 7326 | UBE2G1 | A001-C-108 | Human | Colorectum | FAP | 4.66e-17 | -4.36e-01 | -0.0272 |
| 7326 | UBE2G1 | A002-C-205 | Human | Colorectum | FAP | 4.32e-18 | -4.86e-01 | -0.1236 |
| 7326 | UBE2G1 | A001-C-104 | Human | Colorectum | FAP | 1.55e-09 | -4.35e-01 | 0.0184 |
| 7326 | UBE2G1 | A015-C-005 | Human | Colorectum | FAP | 3.44e-02 | -3.19e-01 | -0.0336 |
| Page: 1 2 3 4 5 6 7 8 |
| Tissue | Expression Dynamics | Abbreviation |
| Colorectum (GSE201348) |  | FAP: Familial adenomatous polyposis |
| CRC: Colorectal cancer | ||
| Colorectum (HTA11) |  | AD: Adenomas |
| SER: Sessile serrated lesions | ||
| MSI-H: Microsatellite-high colorectal cancer | ||
| MSS: Microsatellite stable colorectal cancer | ||
| Endometrium | 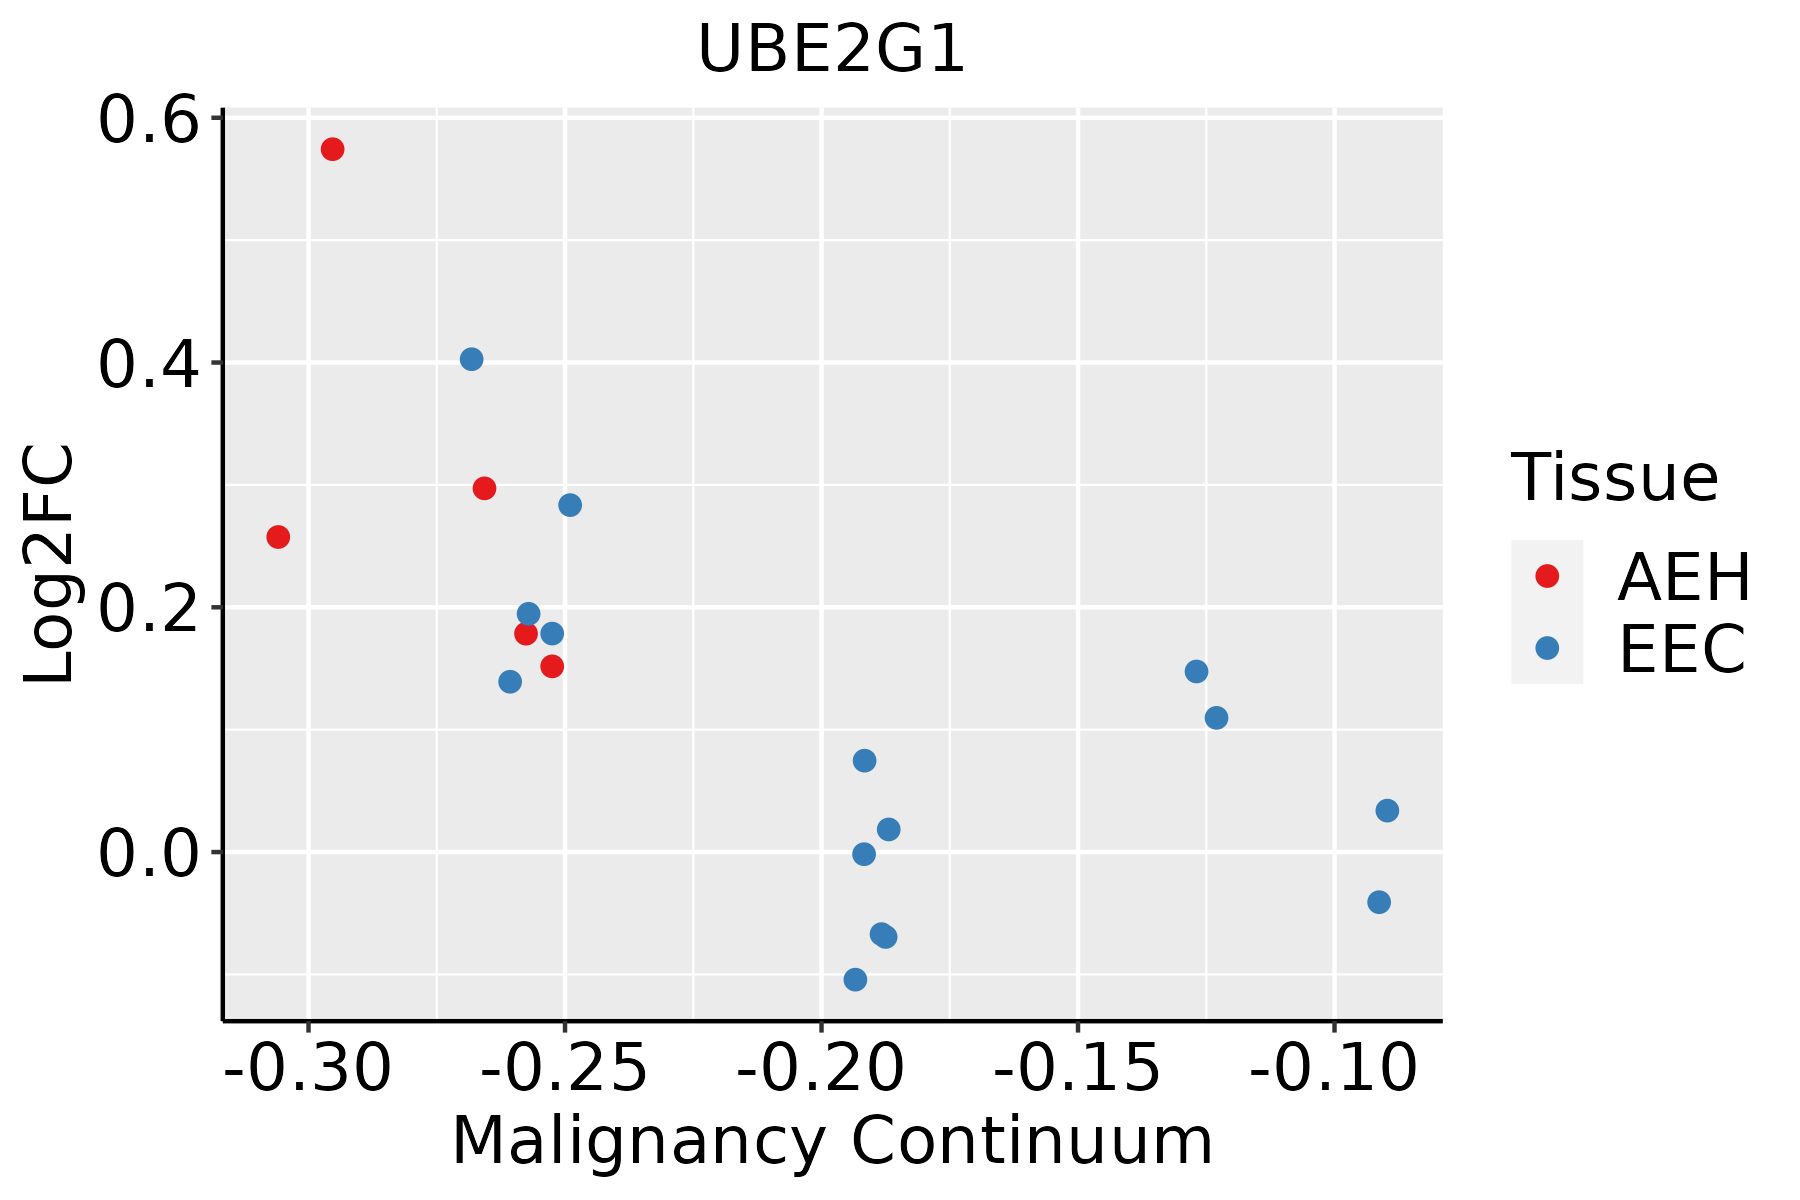 | AEH: Atypical endometrial hyperplasia |
| EEC: Endometrioid Cancer | ||
| Esophagus | 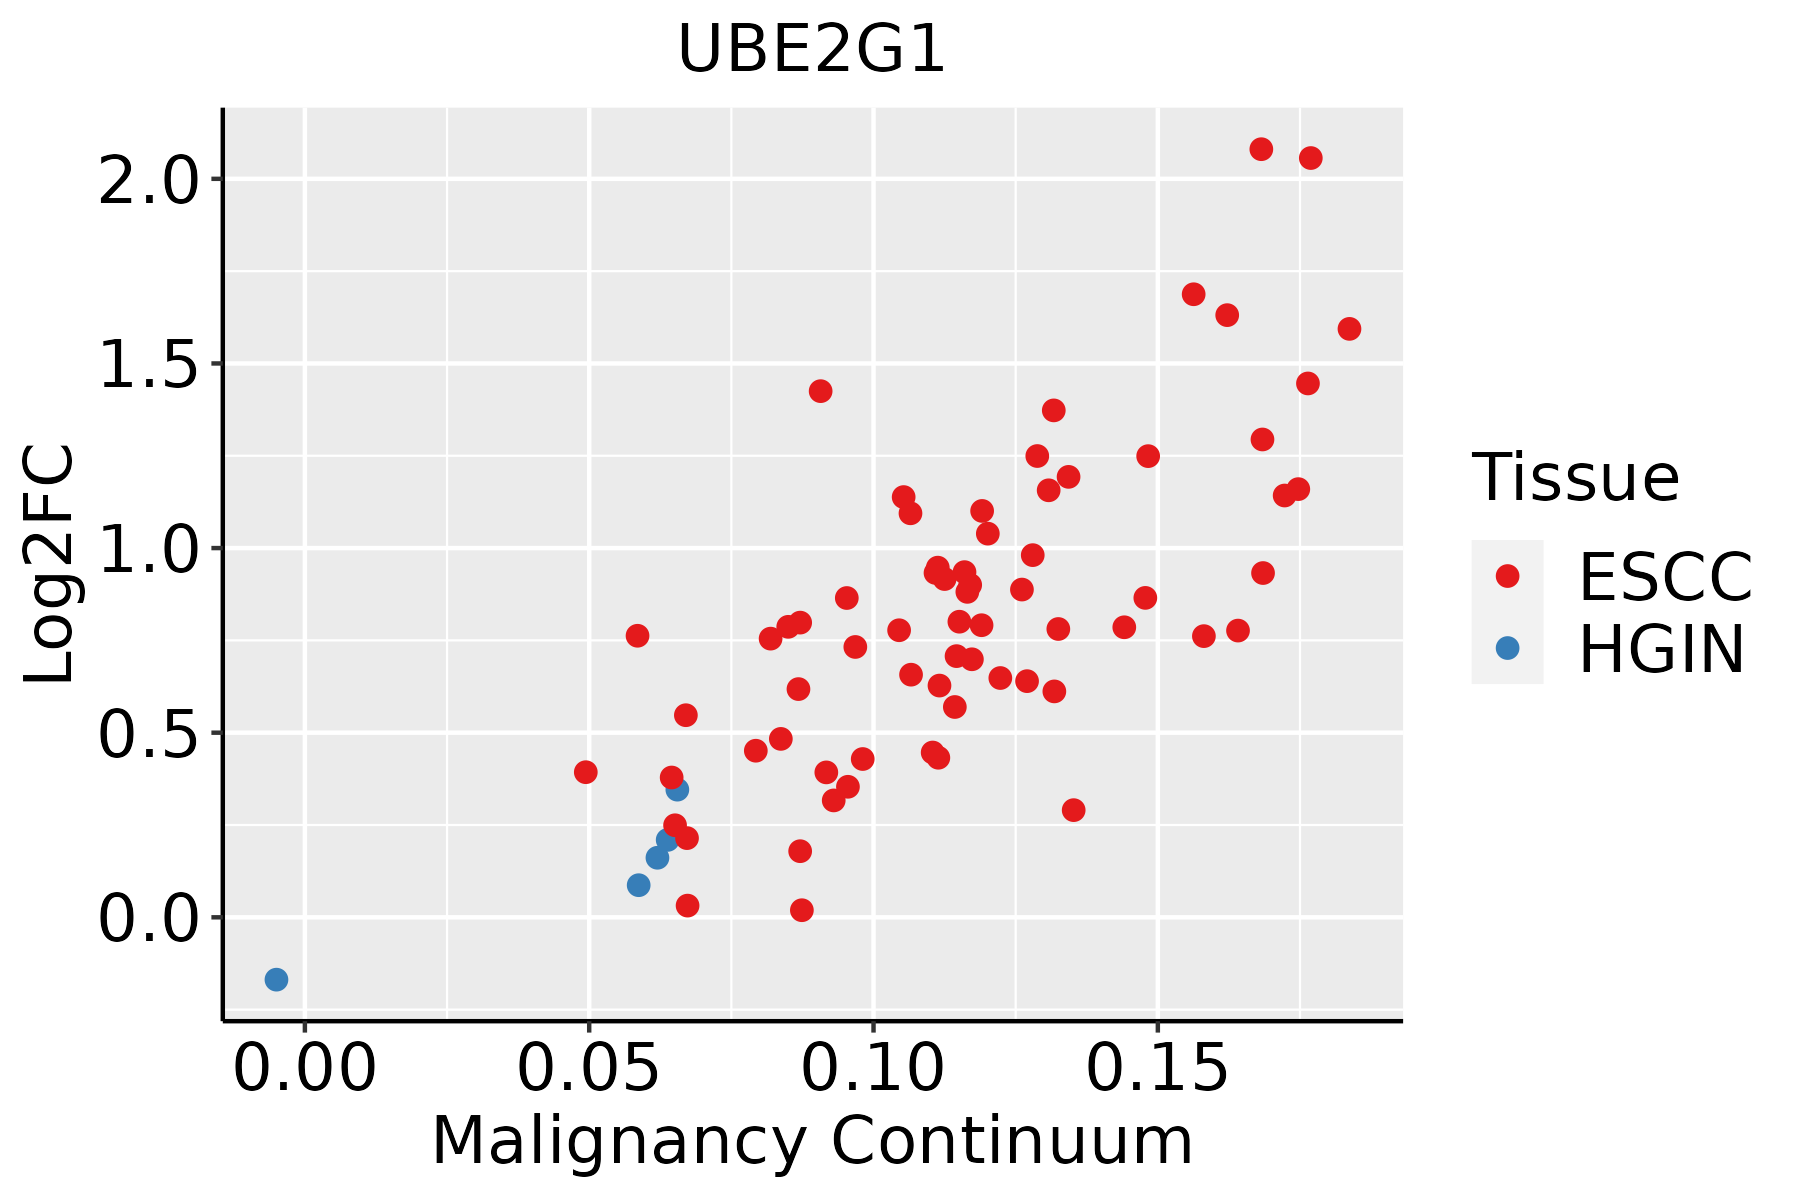 | ESCC: Esophageal squamous cell carcinoma |
| HGIN: High-grade intraepithelial neoplasias | ||
| LGIN: Low-grade intraepithelial neoplasias | ||
| Liver |  | HCC: Hepatocellular carcinoma |
| NAFLD: Non-alcoholic fatty liver disease | ||
| Oral Cavity |  | EOLP: Erosive Oral lichen planus |
| LP: leukoplakia | ||
| NEOLP: Non-erosive oral lichen planus | ||
| OSCC: Oral squamous cell carcinoma | ||
| Prostate | 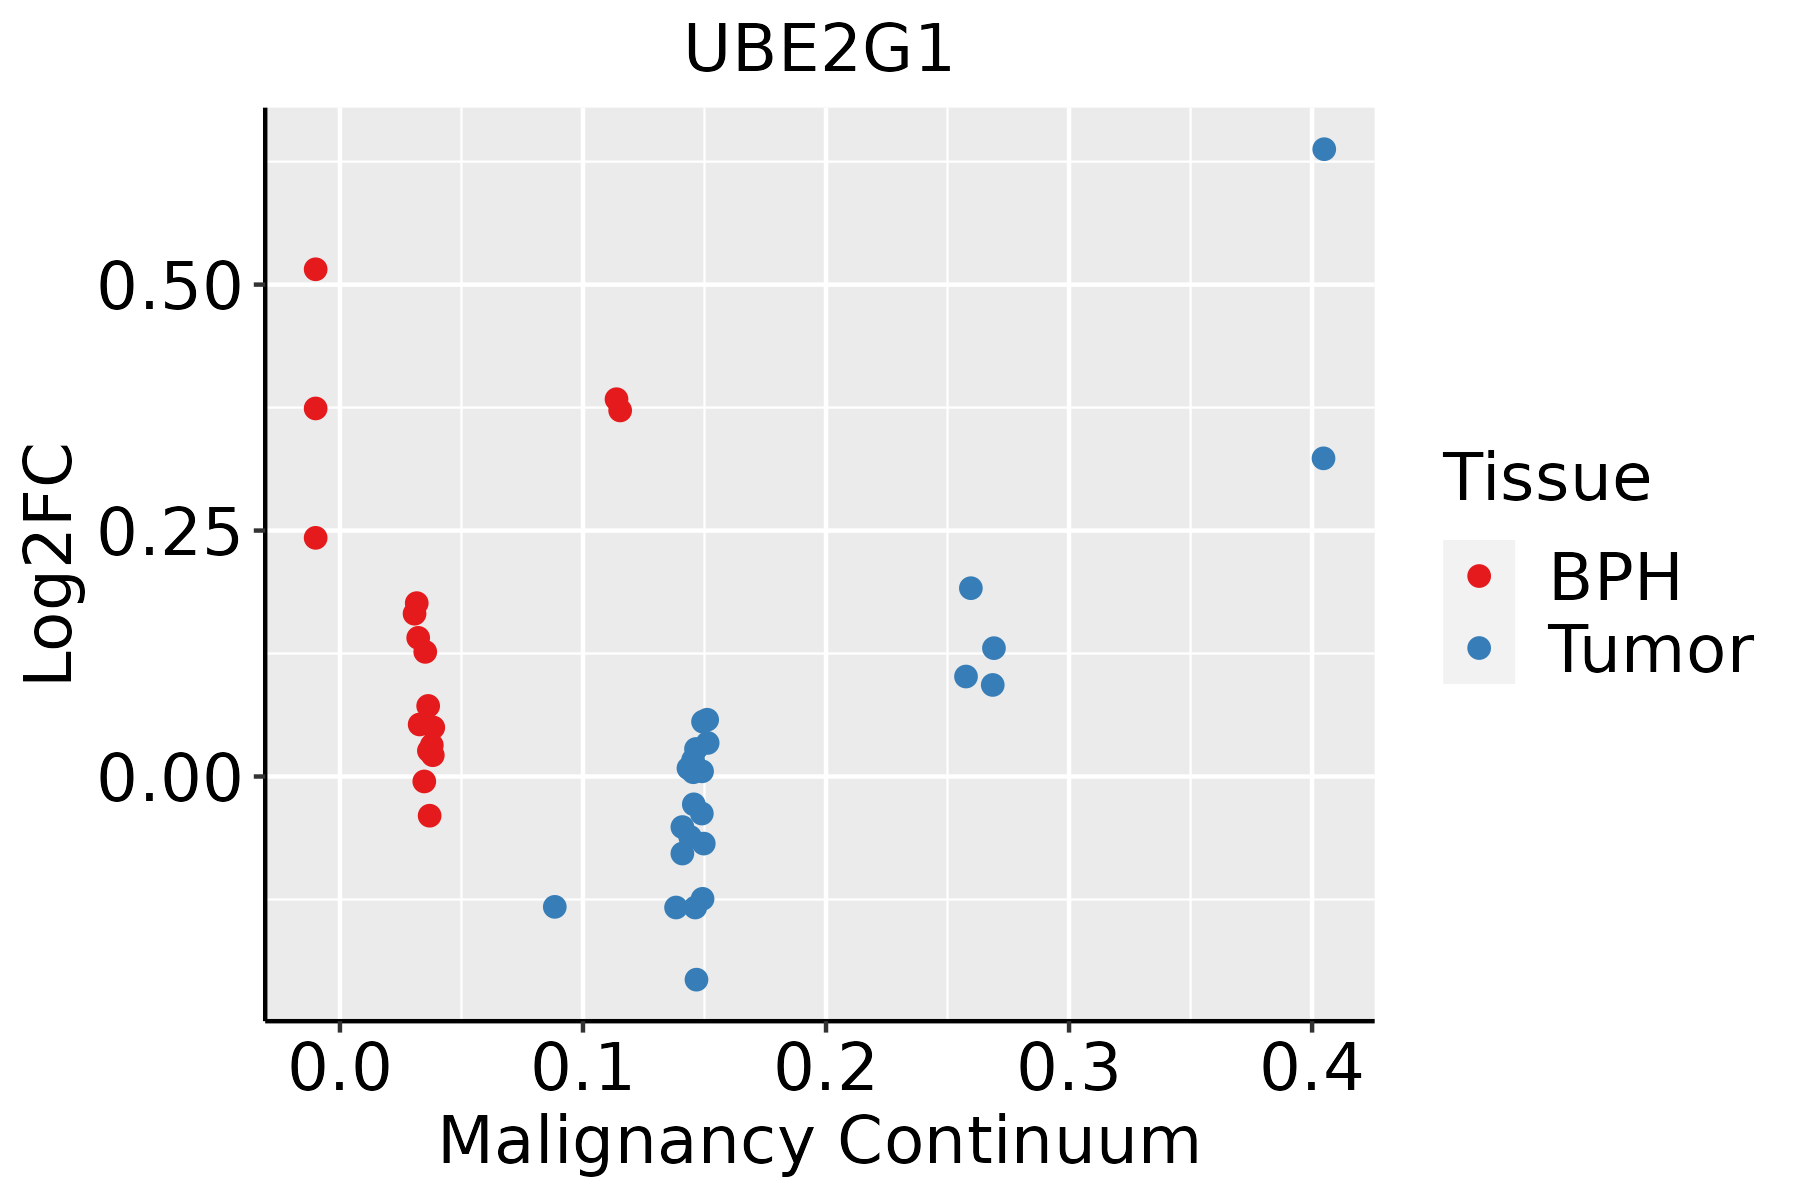 | BPH: Benign Prostatic Hyperplasia |
| Skin |  | AK: Actinic keratosis |
| cSCC: Cutaneous squamous cell carcinoma | ||
| SCCIS:squamous cell carcinoma in situ | ||
| Thyroid | 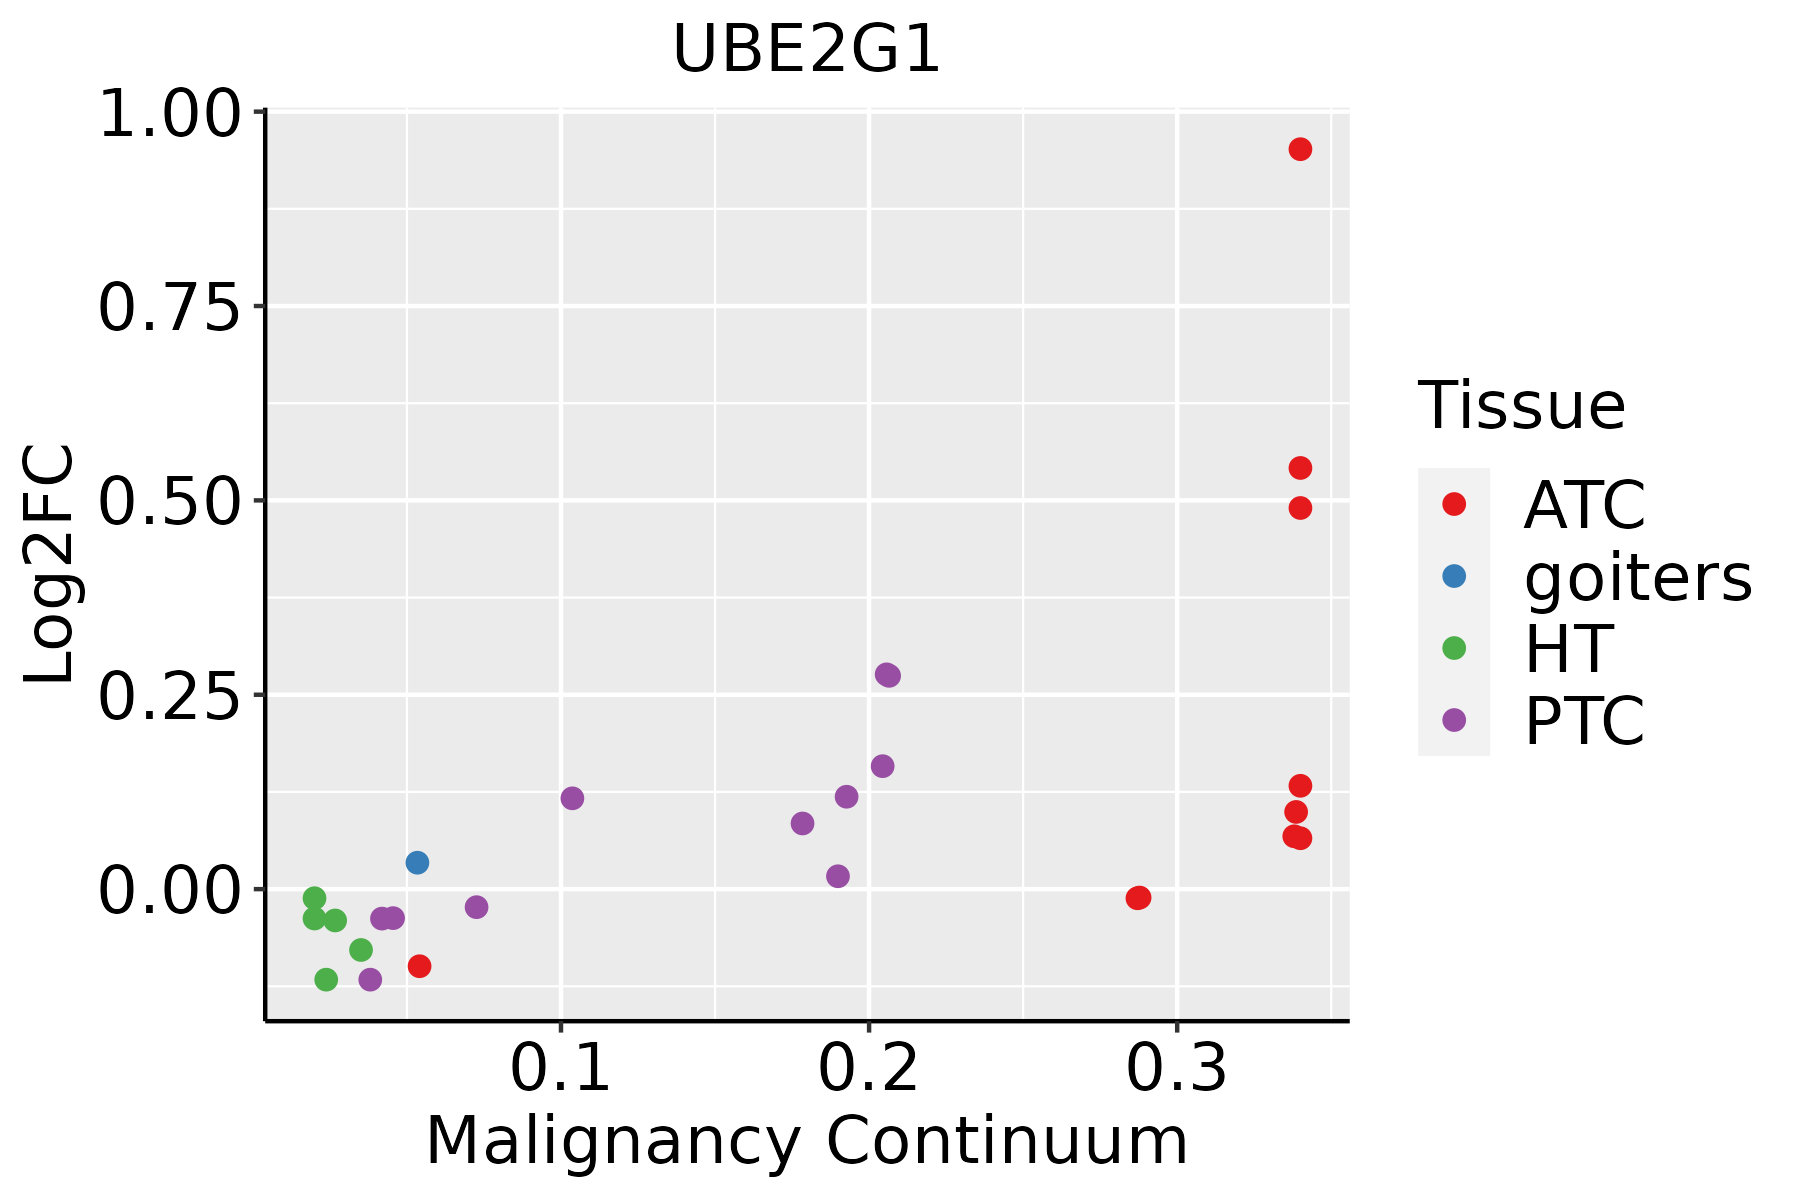 | ATC: Anaplastic thyroid cancer |
| HT: Hashimoto's thyroiditis | ||
| PTC: Papillary thyroid cancer |
| ∗log2FC in expression of this searched gene in stem-like cells from each diseased tissue sample relative to stem-like cells in normal samples in each tissue plotted against the malignancy continuum. Samples are colored based on if they are from different disease stage. |
Top |
Malignant transformation related pathway analysis |
| Find out the enriched GO biological processes and KEGG pathways involved in transition from healthy to precancer to cancer |
| Tissue | Disease Stage | Enriched GO biological Processes |
| Colorectum | AD |  |
| Colorectum | SER |  |
| Colorectum | MSS |  |
| Colorectum | MSI-H |  |
| Colorectum | FAP |  |
| ∗Top 15 enriched GO BP terms are showed in the bar plot of each disease state in each tissue. Each row represents a significant GO biological process which is colored according to the -log10(p.adjust). |
| Page: 1 2 3 4 5 6 7 8 9 |
| GO ID | Tissue | Disease Stage | Description | Gene Ratio | Bg Ratio | pvalue | p.adjust | Count |
| GO:0010498 | Colorectum | AD | proteasomal protein catabolic process | 174/3918 | 490/18723 | 3.18e-14 | 7.66e-12 | 174 |
| GO:0043161 | Colorectum | AD | proteasome-mediated ubiquitin-dependent protein catabolic process | 141/3918 | 412/18723 | 1.77e-10 | 1.68e-08 | 141 |
| GO:0000209 | Colorectum | AD | protein polyubiquitination | 78/3918 | 236/18723 | 8.71e-06 | 2.06e-04 | 78 |
| GO:0070936 | Colorectum | AD | protein K48-linked ubiquitination | 27/3918 | 65/18723 | 1.31e-04 | 1.88e-03 | 27 |
| GO:0070534 | Colorectum | AD | protein K63-linked ubiquitination | 20/3918 | 56/18723 | 7.57e-03 | 4.58e-02 | 20 |
| GO:00104982 | Colorectum | MSS | proteasomal protein catabolic process | 157/3467 | 490/18723 | 2.39e-13 | 5.25e-11 | 157 |
| GO:00431612 | Colorectum | MSS | proteasome-mediated ubiquitin-dependent protein catabolic process | 127/3467 | 412/18723 | 7.70e-10 | 6.32e-08 | 127 |
| GO:00002092 | Colorectum | MSS | protein polyubiquitination | 72/3467 | 236/18723 | 5.19e-06 | 1.42e-04 | 72 |
| GO:00709361 | Colorectum | MSS | protein K48-linked ubiquitination | 27/3467 | 65/18723 | 1.40e-05 | 3.18e-04 | 27 |
| GO:00705341 | Colorectum | MSS | protein K63-linked ubiquitination | 21/3467 | 56/18723 | 6.51e-04 | 7.06e-03 | 21 |
| GO:00431614 | Colorectum | FAP | proteasome-mediated ubiquitin-dependent protein catabolic process | 98/2622 | 412/18723 | 5.41e-08 | 4.20e-06 | 98 |
| GO:00104984 | Colorectum | FAP | proteasomal protein catabolic process | 110/2622 | 490/18723 | 2.12e-07 | 1.26e-05 | 110 |
| GO:00709362 | Colorectum | FAP | protein K48-linked ubiquitination | 24/2622 | 65/18723 | 3.42e-06 | 1.23e-04 | 24 |
| GO:00002093 | Colorectum | FAP | protein polyubiquitination | 59/2622 | 236/18723 | 4.53e-06 | 1.52e-04 | 59 |
| GO:00709363 | Colorectum | CRC | protein K48-linked ubiquitination | 19/2078 | 65/18723 | 5.34e-05 | 1.22e-03 | 19 |
| GO:00002094 | Colorectum | CRC | protein polyubiquitination | 46/2078 | 236/18723 | 9.91e-05 | 1.98e-03 | 46 |
| GO:00431615 | Colorectum | CRC | proteasome-mediated ubiquitin-dependent protein catabolic process | 69/2078 | 412/18723 | 3.16e-04 | 4.90e-03 | 69 |
| GO:00104985 | Colorectum | CRC | proteasomal protein catabolic process | 77/2078 | 490/18723 | 1.03e-03 | 1.21e-02 | 77 |
| GO:001049816 | Endometrium | AEH | proteasomal protein catabolic process | 108/2100 | 490/18723 | 2.73e-12 | 4.67e-10 | 108 |
| GO:004316116 | Endometrium | AEH | proteasome-mediated ubiquitin-dependent protein catabolic process | 88/2100 | 412/18723 | 1.54e-09 | 1.36e-07 | 88 |
| Page: 1 2 3 4 5 |
| Pathway ID | Tissue | Disease Stage | Description | Gene Ratio | Bg Ratio | pvalue | p.adjust | qvalue | Count |
| hsa05012 | Colorectum | AD | Parkinson disease | 147/2092 | 266/8465 | 2.53e-27 | 8.48e-25 | 5.41e-25 | 147 |
| hsa05022 | Colorectum | AD | Pathways of neurodegeneration - multiple diseases | 201/2092 | 476/8465 | 4.54e-18 | 1.27e-16 | 8.09e-17 | 201 |
| hsa04141 | Colorectum | AD | Protein processing in endoplasmic reticulum | 80/2092 | 174/8465 | 5.96e-10 | 1.25e-08 | 7.96e-09 | 80 |
| hsa04120 | Colorectum | AD | Ubiquitin mediated proteolysis | 58/2092 | 142/8465 | 1.46e-05 | 1.53e-04 | 9.76e-05 | 58 |
| hsa050121 | Colorectum | AD | Parkinson disease | 147/2092 | 266/8465 | 2.53e-27 | 8.48e-25 | 5.41e-25 | 147 |
| hsa050221 | Colorectum | AD | Pathways of neurodegeneration - multiple diseases | 201/2092 | 476/8465 | 4.54e-18 | 1.27e-16 | 8.09e-17 | 201 |
| hsa041411 | Colorectum | AD | Protein processing in endoplasmic reticulum | 80/2092 | 174/8465 | 5.96e-10 | 1.25e-08 | 7.96e-09 | 80 |
| hsa041201 | Colorectum | AD | Ubiquitin mediated proteolysis | 58/2092 | 142/8465 | 1.46e-05 | 1.53e-04 | 9.76e-05 | 58 |
| hsa050124 | Colorectum | MSS | Parkinson disease | 140/1875 | 266/8465 | 2.32e-28 | 7.79e-26 | 4.77e-26 | 140 |
| hsa050224 | Colorectum | MSS | Pathways of neurodegeneration - multiple diseases | 192/1875 | 476/8465 | 2.79e-20 | 1.04e-18 | 6.36e-19 | 192 |
| hsa041414 | Colorectum | MSS | Protein processing in endoplasmic reticulum | 75/1875 | 174/8465 | 3.78e-10 | 8.44e-09 | 5.17e-09 | 75 |
| hsa041204 | Colorectum | MSS | Ubiquitin mediated proteolysis | 55/1875 | 142/8465 | 5.02e-06 | 6.00e-05 | 3.68e-05 | 55 |
| hsa050125 | Colorectum | MSS | Parkinson disease | 140/1875 | 266/8465 | 2.32e-28 | 7.79e-26 | 4.77e-26 | 140 |
| hsa050225 | Colorectum | MSS | Pathways of neurodegeneration - multiple diseases | 192/1875 | 476/8465 | 2.79e-20 | 1.04e-18 | 6.36e-19 | 192 |
| hsa041415 | Colorectum | MSS | Protein processing in endoplasmic reticulum | 75/1875 | 174/8465 | 3.78e-10 | 8.44e-09 | 5.17e-09 | 75 |
| hsa041205 | Colorectum | MSS | Ubiquitin mediated proteolysis | 55/1875 | 142/8465 | 5.02e-06 | 6.00e-05 | 3.68e-05 | 55 |
| hsa041206 | Colorectum | FAP | Ubiquitin mediated proteolysis | 51/1404 | 142/8465 | 1.55e-08 | 5.84e-07 | 3.55e-07 | 51 |
| hsa050128 | Colorectum | FAP | Parkinson disease | 80/1404 | 266/8465 | 2.04e-08 | 6.20e-07 | 3.77e-07 | 80 |
| hsa050228 | Colorectum | FAP | Pathways of neurodegeneration - multiple diseases | 117/1404 | 476/8465 | 2.81e-06 | 4.47e-05 | 2.72e-05 | 117 |
| hsa041418 | Colorectum | FAP | Protein processing in endoplasmic reticulum | 50/1404 | 174/8465 | 3.64e-05 | 3.68e-04 | 2.24e-04 | 50 |
| Page: 1 2 3 4 5 6 |
Top |
Cell-cell communication analysis |
| Identification of potential cell-cell interactions between two cell types and their ligand-receptor pairs for different disease states |
| Ligand | Receptor | LRpair | Pathway | Tissue | Disease Stage |
| Page: 1 |
Top |
Single-cell gene regulatory network inference analysis |
| Find out the significant the regulons (TFs) and the target genes of each regulon across cell types for different disease states |
| TF | Cell Type | Tissue | Disease Stage | Target Gene | RSS | Regulon Activity |
| ∗The dot plots of a searched regulon are shown for all cell subpopulations in each disease state of each tissue based on the regulon specific score inferred using pySCENIC and by calculating the average expression. |
| Page: 1 |
Top |
Somatic mutation of malignant transformation related genes |
| Annotation of somatic variants for genes involved in malignant transformation |
| Hugo Symbol | Variant Class | Variant Classification | dbSNP RS | HGVSc | HGVSp | HGVSp Short | SWISSPROT | BIOTYPE | SIFT | PolyPhen | Tumor Sample Barcode | Tissue | Histology | Sex | Age | Stage | Therapy Types | Drugs | Outcome |
| UBE2G1 | SNV | Missense_Mutation | novel | c.151N>A | p.Glu51Lys | p.E51K | P62253 | protein_coding | deleterious(0) | possibly_damaging(0.904) | TCGA-BH-A0W7-01 | Breast | breast invasive carcinoma | Female | <65 | I/II | Chemotherapy | taxotere | CR |
| UBE2G1 | SNV | Missense_Mutation | novel | c.259N>T | p.Gly87Cys | p.G87C | P62253 | protein_coding | deleterious(0) | probably_damaging(1) | TCGA-DS-A1OD-01 | Cervix | cervical & endocervical cancer | Female | <65 | I/II | Chemotherapy | cisplatin | SD |
| UBE2G1 | insertion | Frame_Shift_Ins | novel | c.257_258insCTTCT | p.Gly87PhefsTer37 | p.G87Ffs*37 | P62253 | protein_coding | TCGA-DS-A1OD-01 | Cervix | cervical & endocervical cancer | Female | <65 | I/II | Chemotherapy | cisplatin | SD | ||
| UBE2G1 | SNV | Missense_Mutation | c.172C>T | p.His58Tyr | p.H58Y | P62253 | protein_coding | tolerated(0.27) | benign(0.028) | TCGA-AA-A004-01 | Colorectum | colon adenocarcinoma | Male | >=65 | I/II | Unknown | Unknown | SD | |
| UBE2G1 | SNV | Missense_Mutation | c.308N>A | p.Gly103Asp | p.G103D | P62253 | protein_coding | deleterious(0.03) | benign(0.141) | TCGA-AZ-4315-01 | Colorectum | colon adenocarcinoma | Male | <65 | I/II | Unknown | Unknown | SD | |
| UBE2G1 | SNV | Missense_Mutation | rs769874508 | c.110G>A | p.Arg37Gln | p.R37Q | P62253 | protein_coding | tolerated(0.12) | benign(0.003) | TCGA-D1-A16X-01 | Endometrium | uterine corpus endometrioid carcinoma | Female | <65 | I/II | Unknown | Unknown | SD |
| UBE2G1 | SNV | Missense_Mutation | rs769874508 | c.110N>A | p.Arg37Gln | p.R37Q | P62253 | protein_coding | tolerated(0.12) | benign(0.003) | TCGA-EY-A1GI-01 | Endometrium | uterine corpus endometrioid carcinoma | Female | <65 | I/II | Unknown | Unknown | SD |
| UBE2G1 | SNV | Missense_Mutation | novel | c.425C>T | p.Ala142Val | p.A142V | P62253 | protein_coding | deleterious(0.03) | possibly_damaging(0.569) | TCGA-NC-A5HG-01 | Lung | lung squamous cell carcinoma | Male | <65 | III/IV | Chemotherapy | cisplatin | CR |
| Page: 1 |
Top |
Related drugs of malignant transformation related genes |
| Identification of chemicals and drugs interact with genes involved in malignant transfromation |
| (DGIdb 4.0) |
| Entrez ID | Symbol | Category | Interaction Types | Drug Claim Name | Drug Name | PMIDs |
| Page: 1 |

Copyright 2023-Present -The University of Texas Health Science Center at Houston |