
|
|||||
|
 | |
| |
| |
| |
| |
| |
|
Gene: UBE2F |
Gene summary for UBE2F |
| Gene information | Species | Human | Gene symbol | UBE2F | Gene ID | 140739 |
| Gene name | ubiquitin conjugating enzyme E2 F (putative) | |
| Gene Alias | NCE2 | |
| Cytomap | 2q37.3 | |
| Gene Type | protein-coding | GO ID | GO:0006464 | UniProtAcc | Q969M7 |
Top |
Malignant transformation analysis |
| Identification of the aberrant gene expression in precancerous and cancerous lesions by comparing the gene expression of stem-like cells in diseased tissues with normal stem cells |
| Entrez ID | Symbol | Replicates | Species | Organ | Tissue | Adj P-value | Log2FC | Malignancy |
| 140739 | UBE2F | LZE4T | Human | Esophagus | ESCC | 1.76e-15 | 3.94e-01 | 0.0811 |
| 140739 | UBE2F | LZE5T | Human | Esophagus | ESCC | 6.27e-03 | 4.55e-01 | 0.0514 |
| 140739 | UBE2F | LZE8T | Human | Esophagus | ESCC | 6.59e-14 | 3.99e-01 | 0.067 |
| 140739 | UBE2F | LZE20T | Human | Esophagus | ESCC | 8.04e-06 | 3.38e-01 | 0.0662 |
| 140739 | UBE2F | LZE22D1 | Human | Esophagus | HGIN | 4.82e-03 | 4.84e-02 | 0.0595 |
| 140739 | UBE2F | LZE22T | Human | Esophagus | ESCC | 7.02e-05 | 5.21e-01 | 0.068 |
| 140739 | UBE2F | LZE24T | Human | Esophagus | ESCC | 1.31e-17 | 7.07e-01 | 0.0596 |
| 140739 | UBE2F | LZE6T | Human | Esophagus | ESCC | 3.37e-13 | 6.73e-01 | 0.0845 |
| 140739 | UBE2F | P2T-E | Human | Esophagus | ESCC | 2.90e-16 | 1.19e-01 | 0.1177 |
| 140739 | UBE2F | P4T-E | Human | Esophagus | ESCC | 1.06e-13 | 1.39e-01 | 0.1323 |
| 140739 | UBE2F | P5T-E | Human | Esophagus | ESCC | 6.02e-19 | 1.79e-01 | 0.1327 |
| 140739 | UBE2F | P8T-E | Human | Esophagus | ESCC | 2.65e-12 | 3.98e-02 | 0.0889 |
| 140739 | UBE2F | P9T-E | Human | Esophagus | ESCC | 2.95e-10 | 8.82e-02 | 0.1131 |
| 140739 | UBE2F | P10T-E | Human | Esophagus | ESCC | 2.56e-16 | 1.32e-01 | 0.116 |
| 140739 | UBE2F | P11T-E | Human | Esophagus | ESCC | 3.65e-07 | 5.32e-01 | 0.1426 |
| 140739 | UBE2F | P12T-E | Human | Esophagus | ESCC | 1.91e-15 | 2.64e-01 | 0.1122 |
| 140739 | UBE2F | P15T-E | Human | Esophagus | ESCC | 1.65e-19 | 3.38e-01 | 0.1149 |
| 140739 | UBE2F | P16T-E | Human | Esophagus | ESCC | 5.16e-13 | 1.42e-01 | 0.1153 |
| 140739 | UBE2F | P19T-E | Human | Esophagus | ESCC | 5.19e-04 | 5.69e-01 | 0.1662 |
| 140739 | UBE2F | P20T-E | Human | Esophagus | ESCC | 1.48e-22 | 3.76e-01 | 0.1124 |
| Page: 1 2 3 4 5 6 |
| Tissue | Expression Dynamics | Abbreviation |
| Esophagus |  | ESCC: Esophageal squamous cell carcinoma |
| HGIN: High-grade intraepithelial neoplasias | ||
| LGIN: Low-grade intraepithelial neoplasias | ||
| Liver |  | HCC: Hepatocellular carcinoma |
| NAFLD: Non-alcoholic fatty liver disease | ||
| Oral Cavity | 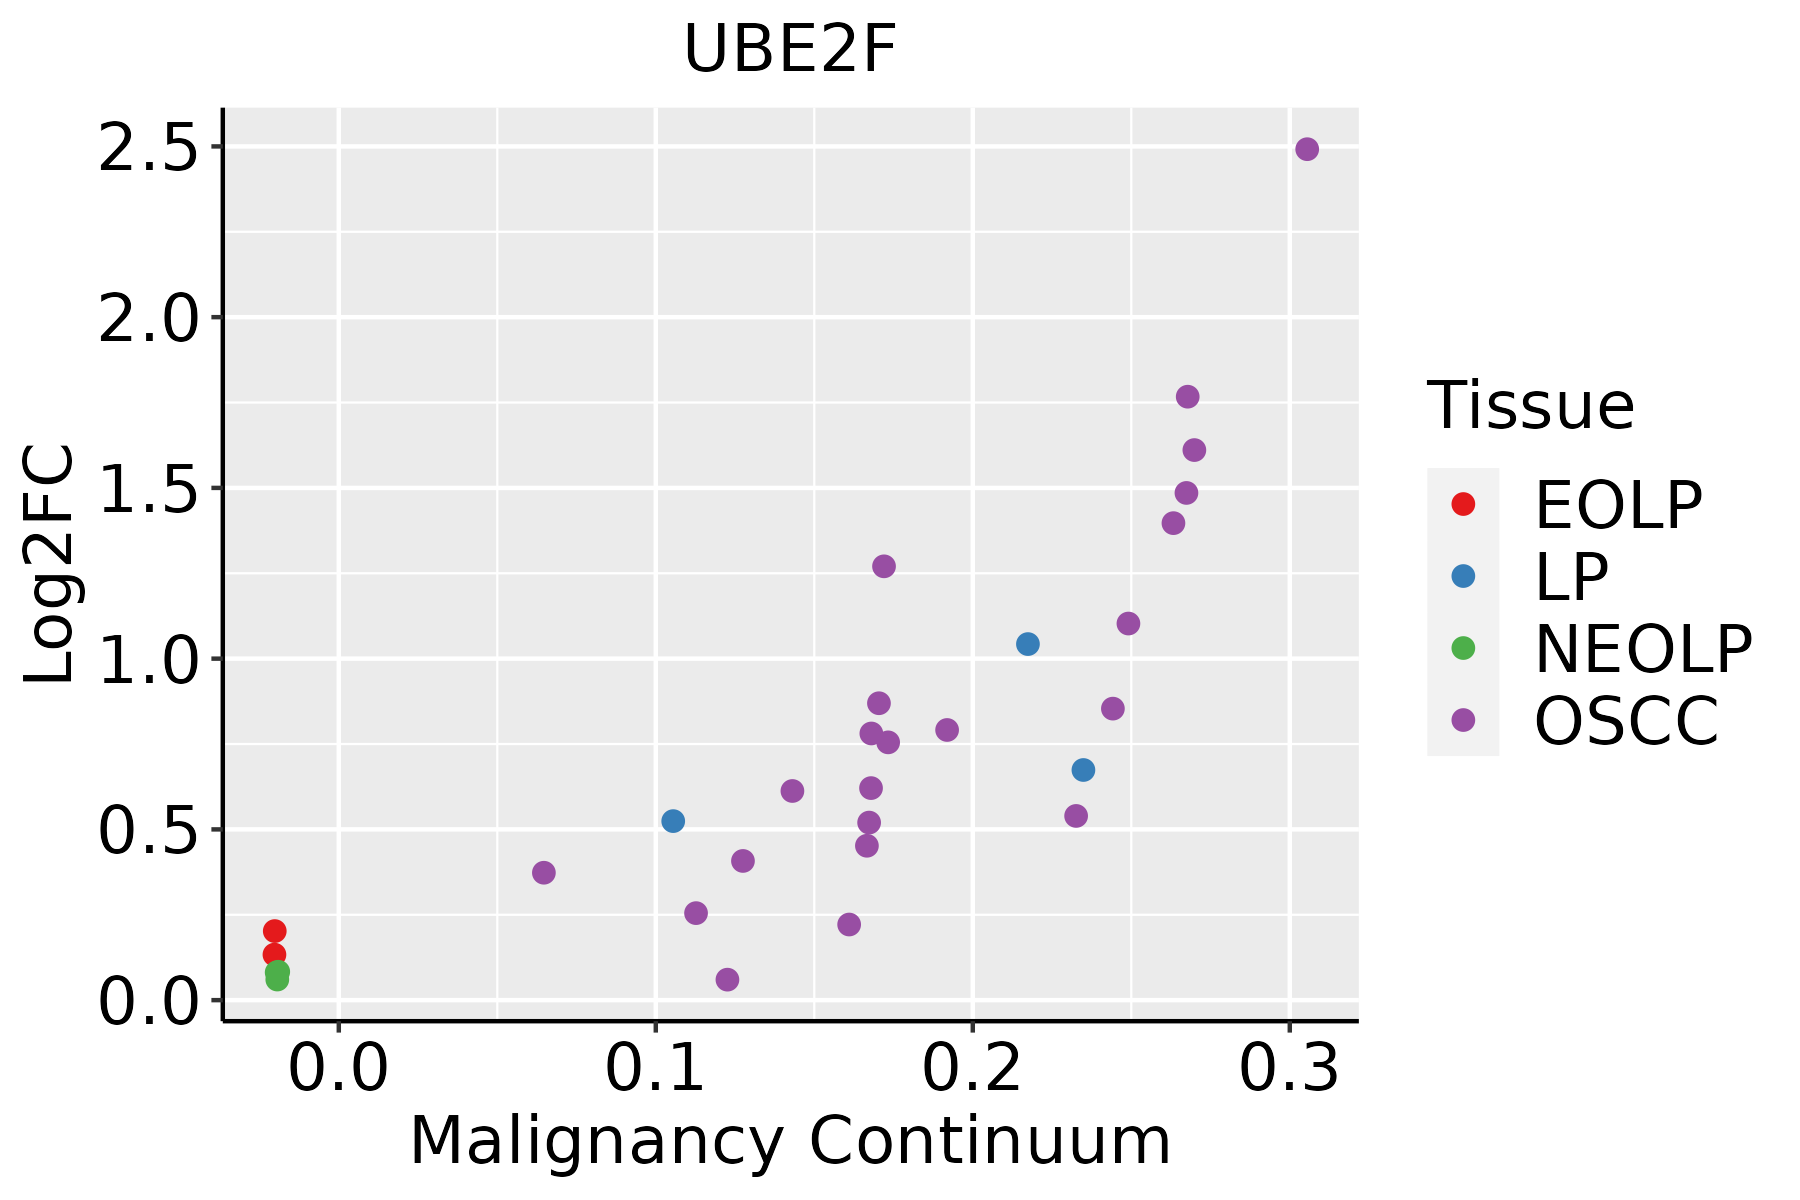 | EOLP: Erosive Oral lichen planus |
| LP: leukoplakia | ||
| NEOLP: Non-erosive oral lichen planus | ||
| OSCC: Oral squamous cell carcinoma | ||
| Skin | 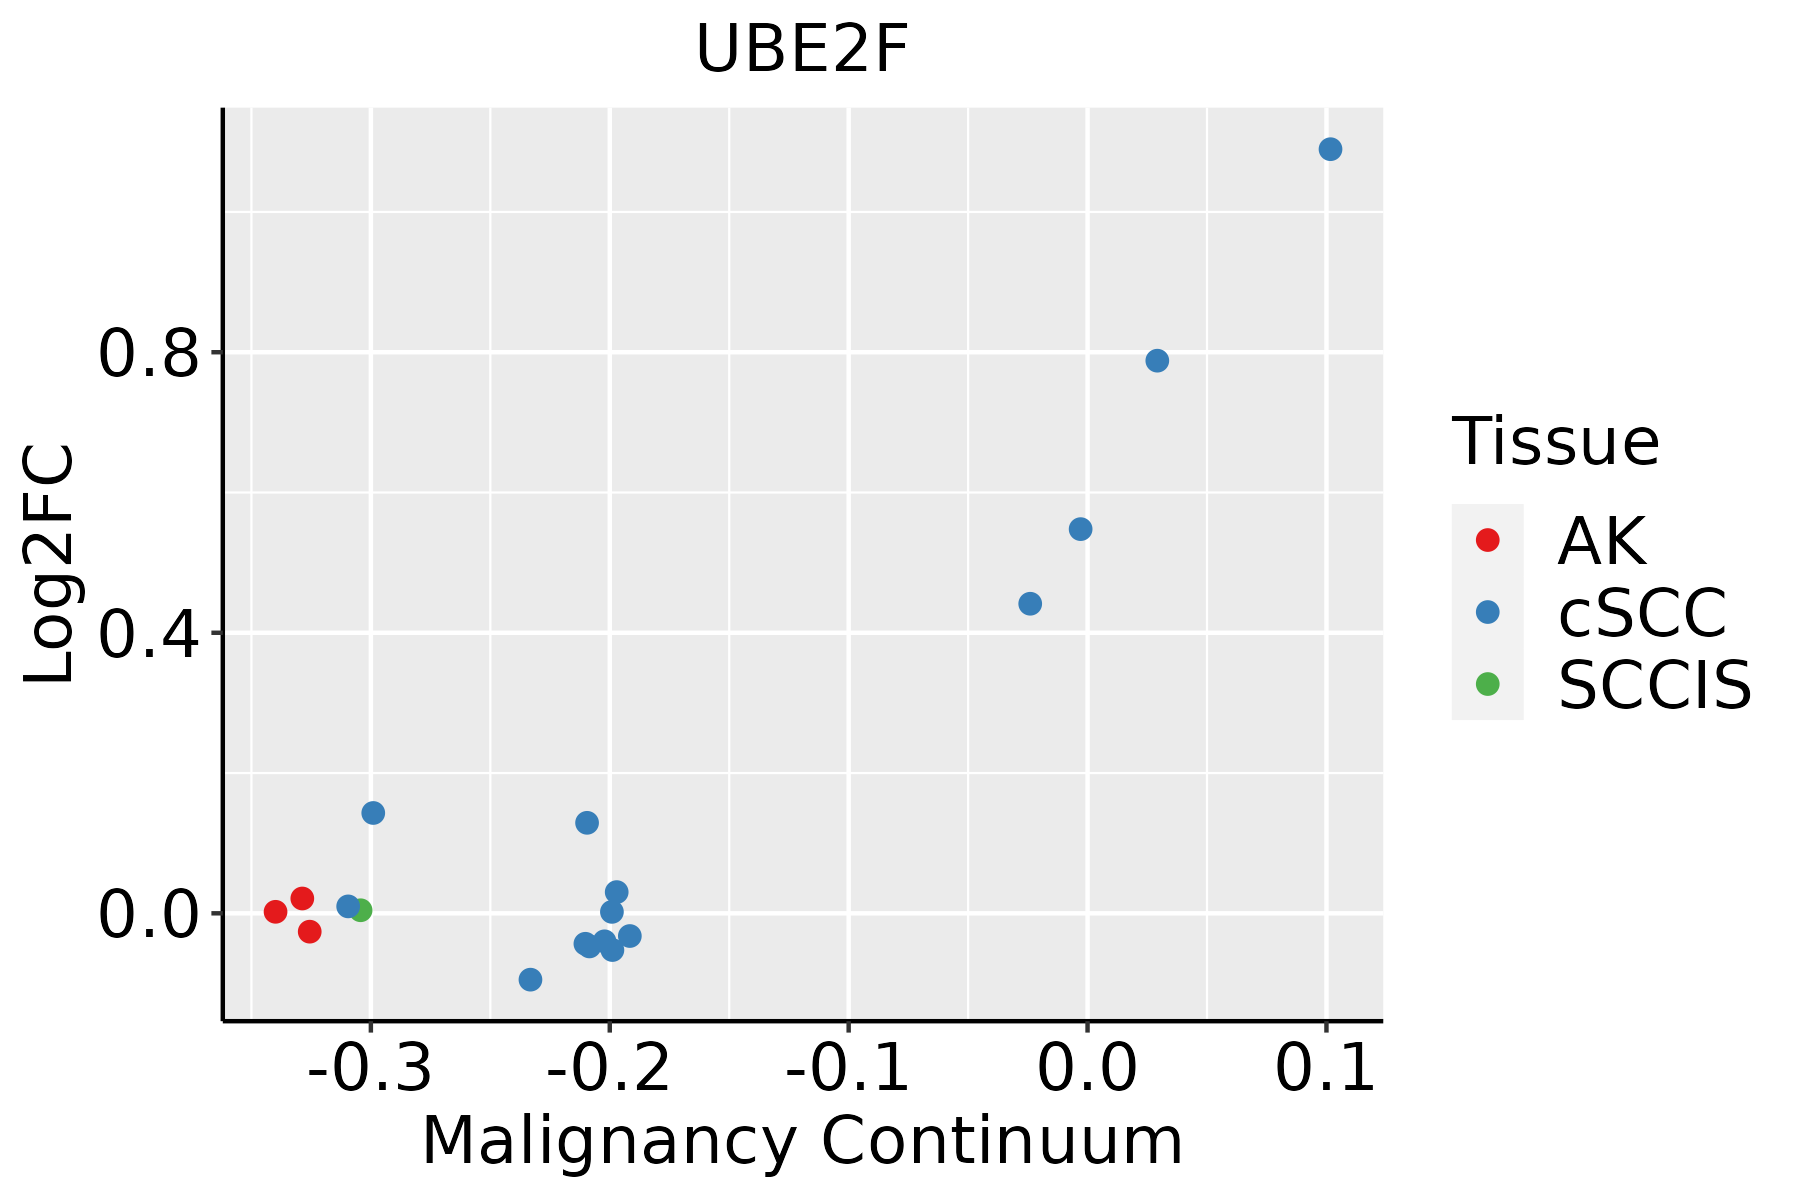 | AK: Actinic keratosis |
| cSCC: Cutaneous squamous cell carcinoma | ||
| SCCIS:squamous cell carcinoma in situ | ||
| Thyroid | 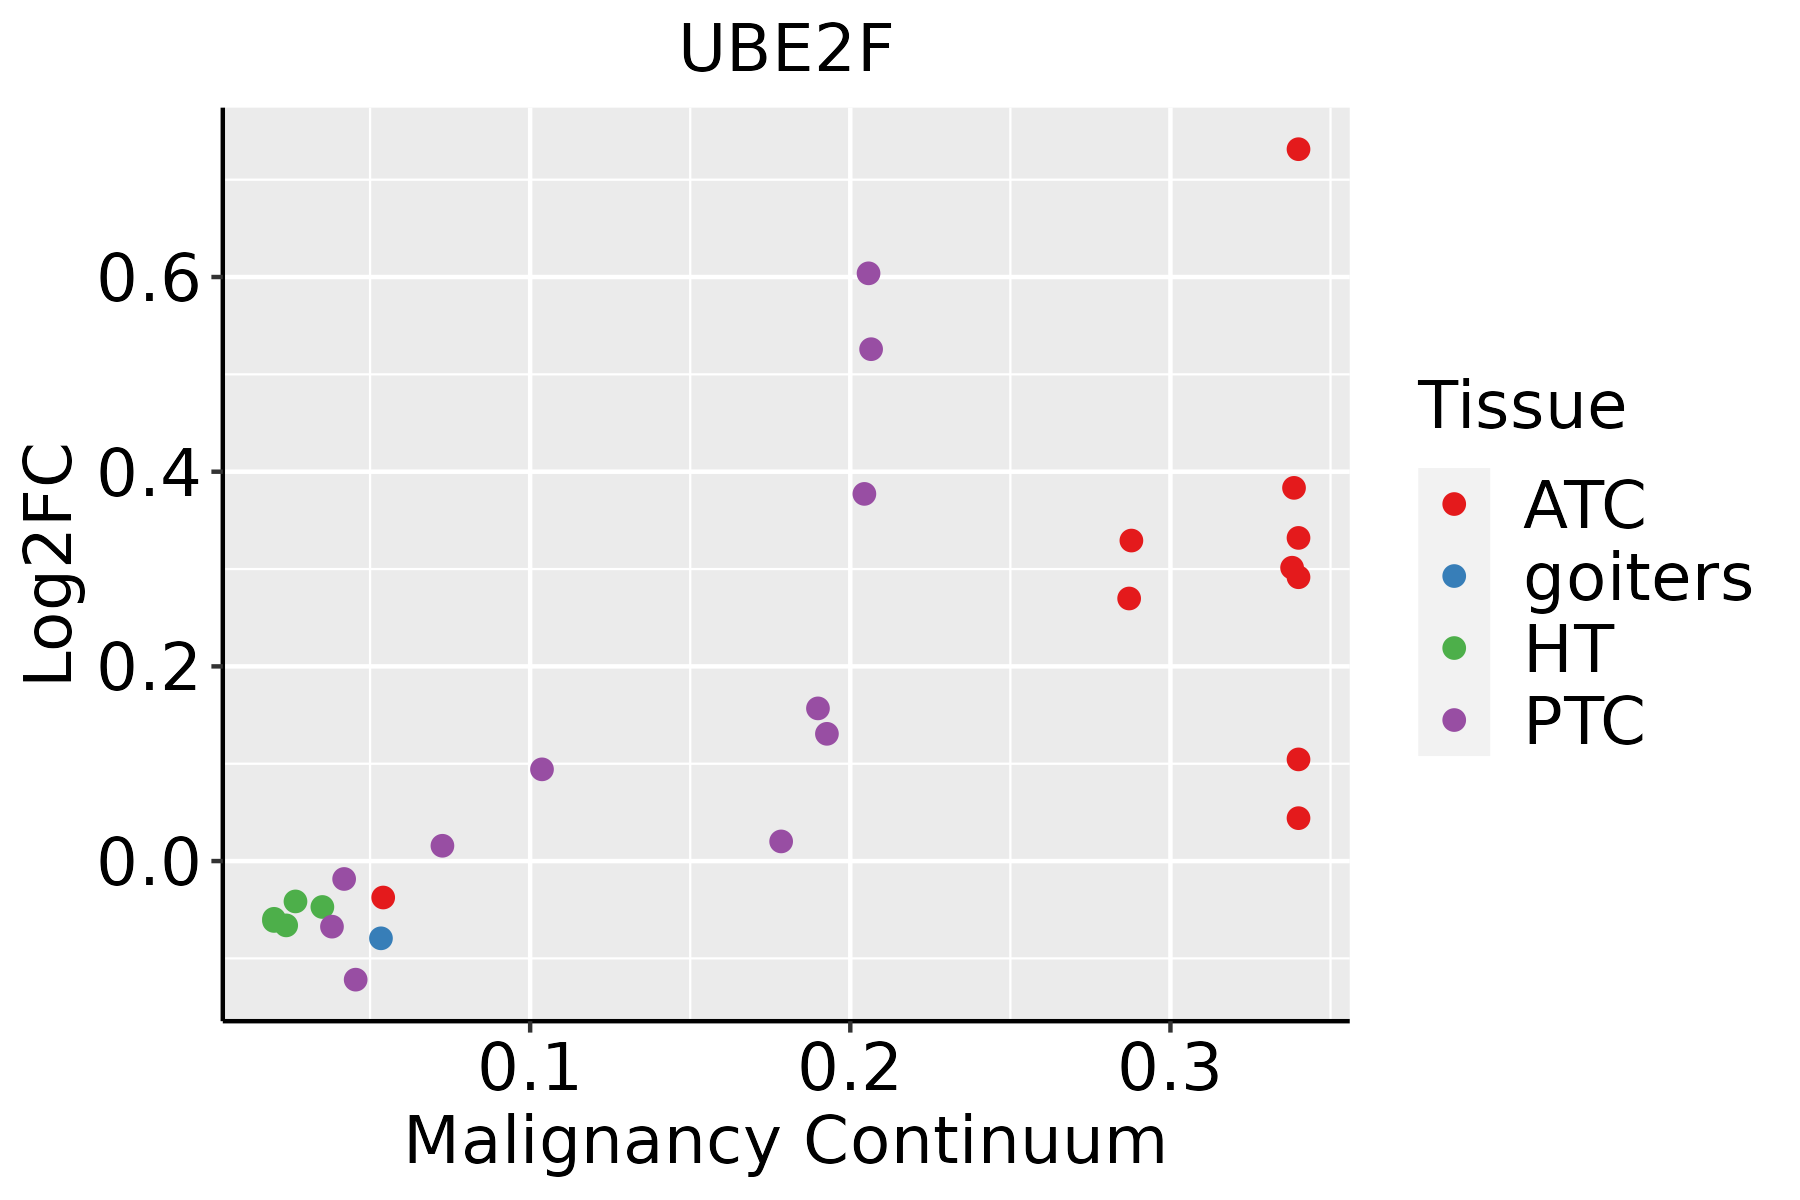 | ATC: Anaplastic thyroid cancer |
| HT: Hashimoto's thyroiditis | ||
| PTC: Papillary thyroid cancer |
| ∗log2FC in expression of this searched gene in stem-like cells from each diseased tissue sample relative to stem-like cells in normal samples in each tissue plotted against the malignancy continuum. Samples are colored based on if they are from different disease stage. |
Top |
Malignant transformation related pathway analysis |
| Find out the enriched GO biological processes and KEGG pathways involved in transition from healthy to precancer to cancer |
| Tissue | Disease Stage | Enriched GO biological Processes |
| Colorectum | AD |  |
| Colorectum | SER |  |
| Colorectum | MSS |  |
| Colorectum | MSI-H |  |
| Colorectum | FAP |  |
| ∗Top 15 enriched GO BP terms are showed in the bar plot of each disease state in each tissue. Each row represents a significant GO biological process which is colored according to the -log10(p.adjust). |
| Page: 1 2 3 4 5 6 7 8 9 |
| GO ID | Tissue | Disease Stage | Description | Gene Ratio | Bg Ratio | pvalue | p.adjust | Count |
| GO:00451166 | Esophagus | HGIN | protein neddylation | 8/2587 | 18/18723 | 1.58e-03 | 1.79e-02 | 8 |
| GO:004511614 | Esophagus | ESCC | protein neddylation | 15/8552 | 18/18723 | 1.20e-03 | 5.88e-03 | 15 |
| GO:0045116 | Liver | Cirrhotic | protein neddylation | 11/4634 | 18/18723 | 1.13e-03 | 7.73e-03 | 11 |
| GO:00451161 | Liver | HCC | protein neddylation | 15/7958 | 18/18723 | 4.74e-04 | 3.12e-03 | 15 |
| GO:0043687 | Liver | HCC | post-translational protein modification | 24/7958 | 37/18723 | 5.03e-03 | 2.11e-02 | 24 |
| GO:00451165 | Oral cavity | OSCC | protein neddylation | 13/7305 | 18/18723 | 4.45e-03 | 1.79e-02 | 13 |
| GO:004511613 | Oral cavity | LP | protein neddylation | 11/4623 | 18/18723 | 1.11e-03 | 9.13e-03 | 11 |
| GO:004511615 | Skin | cSCC | protein neddylation | 14/4864 | 18/18723 | 6.37e-06 | 8.92e-05 | 14 |
| GO:004511616 | Thyroid | PTC | protein neddylation | 13/5968 | 18/18723 | 5.21e-04 | 3.37e-03 | 13 |
| GO:004511622 | Thyroid | ATC | protein neddylation | 13/6293 | 18/18723 | 9.27e-04 | 4.98e-03 | 13 |
| Page: 1 |
| Pathway ID | Tissue | Disease Stage | Description | Gene Ratio | Bg Ratio | pvalue | p.adjust | qvalue | Count |
| hsa0412026 | Esophagus | HGIN | Ubiquitin mediated proteolysis | 49/1383 | 142/8465 | 7.78e-08 | 1.33e-06 | 1.06e-06 | 49 |
| hsa04120111 | Esophagus | HGIN | Ubiquitin mediated proteolysis | 49/1383 | 142/8465 | 7.78e-08 | 1.33e-06 | 1.06e-06 | 49 |
| hsa0412027 | Esophagus | ESCC | Ubiquitin mediated proteolysis | 122/4205 | 142/8465 | 6.53e-20 | 7.29e-18 | 3.74e-18 | 122 |
| hsa0412036 | Esophagus | ESCC | Ubiquitin mediated proteolysis | 122/4205 | 142/8465 | 6.53e-20 | 7.29e-18 | 3.74e-18 | 122 |
| hsa0412021 | Liver | Cirrhotic | Ubiquitin mediated proteolysis | 72/2530 | 142/8465 | 1.32e-07 | 1.97e-06 | 1.21e-06 | 72 |
| hsa0412031 | Liver | Cirrhotic | Ubiquitin mediated proteolysis | 72/2530 | 142/8465 | 1.32e-07 | 1.97e-06 | 1.21e-06 | 72 |
| hsa0412041 | Liver | HCC | Ubiquitin mediated proteolysis | 110/4020 | 142/8465 | 1.67e-13 | 3.74e-12 | 2.08e-12 | 110 |
| hsa0412051 | Liver | HCC | Ubiquitin mediated proteolysis | 110/4020 | 142/8465 | 1.67e-13 | 3.74e-12 | 2.08e-12 | 110 |
| hsa0412020 | Oral cavity | OSCC | Ubiquitin mediated proteolysis | 105/3704 | 142/8465 | 1.83e-13 | 4.37e-12 | 2.23e-12 | 105 |
| hsa04120110 | Oral cavity | OSCC | Ubiquitin mediated proteolysis | 105/3704 | 142/8465 | 1.83e-13 | 4.37e-12 | 2.23e-12 | 105 |
| hsa0412025 | Oral cavity | LP | Ubiquitin mediated proteolysis | 66/2418 | 142/8465 | 3.74e-06 | 3.46e-05 | 2.23e-05 | 66 |
| hsa0412035 | Oral cavity | LP | Ubiquitin mediated proteolysis | 66/2418 | 142/8465 | 3.74e-06 | 3.46e-05 | 2.23e-05 | 66 |
| Page: 1 |
Top |
Cell-cell communication analysis |
| Identification of potential cell-cell interactions between two cell types and their ligand-receptor pairs for different disease states |
| Ligand | Receptor | LRpair | Pathway | Tissue | Disease Stage |
| Page: 1 |
Top |
Single-cell gene regulatory network inference analysis |
| Find out the significant the regulons (TFs) and the target genes of each regulon across cell types for different disease states |
| TF | Cell Type | Tissue | Disease Stage | Target Gene | RSS | Regulon Activity |
| ∗The dot plots of a searched regulon are shown for all cell subpopulations in each disease state of each tissue based on the regulon specific score inferred using pySCENIC and by calculating the average expression. |
| Page: 1 |
Top |
Somatic mutation of malignant transformation related genes |
| Annotation of somatic variants for genes involved in malignant transformation |
| Hugo Symbol | Variant Class | Variant Classification | dbSNP RS | HGVSc | HGVSp | HGVSp Short | SWISSPROT | BIOTYPE | SIFT | PolyPhen | Tumor Sample Barcode | Tissue | Histology | Sex | Age | Stage | Therapy Types | Drugs | Outcome |
| UBE2F | SNV | Missense_Mutation | c.290A>C | p.Lys97Thr | p.K97T | Q969M7 | protein_coding | tolerated(0.38) | benign(0.026) | TCGA-A7-A26G-01 | Breast | breast invasive carcinoma | Female | <65 | I/II | Chemotherapy | taxotere | SD | |
| UBE2F | SNV | Missense_Mutation | c.109C>T | p.Leu37Phe | p.L37F | Q969M7 | protein_coding | deleterious(0.03) | probably_damaging(0.999) | TCGA-AA-3495-01 | Colorectum | colon adenocarcinoma | Male | >=65 | I/II | Unknown | Unknown | SD | |
| UBE2F | SNV | Missense_Mutation | c.133N>A | p.Glu45Lys | p.E45K | Q969M7 | protein_coding | tolerated(0.11) | possibly_damaging(0.564) | TCGA-AA-3811-01 | Colorectum | colon adenocarcinoma | Female | >=65 | III/IV | Unknown | Unknown | PD | |
| UBE2F | SNV | Missense_Mutation | rs750109431 | c.545N>A | p.Arg182His | p.R182H | Q969M7 | protein_coding | tolerated(0.17) | benign(0) | TCGA-BG-A0MQ-01 | Endometrium | uterine corpus endometrioid carcinoma | Female | >=65 | I/II | Unknown | Unknown | SD |
| UBE2F | SNV | Missense_Mutation | novel | c.172N>A | p.Asp58Asn | p.D58N | Q969M7 | protein_coding | tolerated(0.16) | probably_damaging(0.99) | TCGA-EY-A1GS-01 | Endometrium | uterine corpus endometrioid carcinoma | Female | >=65 | III/IV | Chemotherapy | taxol | PD |
| UBE2F | SNV | Missense_Mutation | novel | c.414N>G | p.Asp138Glu | p.D138E | Q969M7 | protein_coding | tolerated(0.12) | probably_damaging(0.96) | TCGA-EY-A215-01 | Endometrium | uterine corpus endometrioid carcinoma | Female | <65 | I/II | Unknown | Unknown | SD |
| UBE2F | SNV | Missense_Mutation | novel | c.172N>T | p.Asp58Tyr | p.D58Y | Q969M7 | protein_coding | deleterious(0) | probably_damaging(0.999) | TCGA-34-2604-01 | Lung | lung squamous cell carcinoma | Female | >=65 | I/II | Unknown | Unknown | SD |
| UBE2F | SNV | Missense_Mutation | rs369725264 | c.77C>T | p.Ser26Leu | p.S26L | Q969M7 | protein_coding | tolerated(0.17) | benign(0.015) | TCGA-85-A4JC-01 | Lung | lung squamous cell carcinoma | Male | >=65 | I/II | Chemotherapy | unknown | PD |
| UBE2F | SNV | Missense_Mutation | rs756699586 | c.418G>A | p.Val140Ile | p.V140I | Q969M7 | protein_coding | tolerated(0.32) | benign(0.003) | TCGA-V1-A9O9-01 | Prostate | prostate adenocarcinoma | Male | <65 | 8 | Unknown | Unknown | SD |
| UBE2F | SNV | Missense_Mutation | rs762910365 | c.50C>T | p.Ser17Phe | p.S17F | Q969M7 | protein_coding | tolerated(0.06) | benign(0.235) | TCGA-B7-5816-01 | Stomach | stomach adenocarcinoma | Female | <65 | I/II | Unknown | Unknown | SD |
| Page: 1 2 |
Top |
Related drugs of malignant transformation related genes |
| Identification of chemicals and drugs interact with genes involved in malignant transfromation |
| (DGIdb 4.0) |
| Entrez ID | Symbol | Category | Interaction Types | Drug Claim Name | Drug Name | PMIDs |
| Page: 1 |

Copyright 2023-Present -The University of Texas Health Science Center at Houston |