
|
|||||
|
 | |
| |
| |
| |
| |
| |
|
Gene: UBE2E2 |
Gene summary for UBE2E2 |
| Gene information | Species | Human | Gene symbol | UBE2E2 | Gene ID | 7325 |
| Gene name | ubiquitin conjugating enzyme E2 E2 | |
| Gene Alias | UBCH8 | |
| Cytomap | 3p24.3 | |
| Gene Type | protein-coding | GO ID | GO:0000082 | UniProtAcc | A0A024R2Q2 |
Top |
Malignant transformation analysis |
| Identification of the aberrant gene expression in precancerous and cancerous lesions by comparing the gene expression of stem-like cells in diseased tissues with normal stem cells |
| Entrez ID | Symbol | Replicates | Species | Organ | Tissue | Adj P-value | Log2FC | Malignancy |
| 7325 | UBE2E2 | N_HPV_2 | Human | Cervix | N_HPV | 8.95e-03 | 1.09e-01 | -0.0131 |
| 7325 | UBE2E2 | CCI_1 | Human | Cervix | CC | 3.44e-09 | 8.72e-01 | 0.528 |
| 7325 | UBE2E2 | CCI_2 | Human | Cervix | CC | 2.32e-02 | 7.50e-01 | 0.5249 |
| 7325 | UBE2E2 | CCI_3 | Human | Cervix | CC | 5.05e-46 | 1.50e+00 | 0.516 |
| 7325 | UBE2E2 | LZE8T | Human | Esophagus | ESCC | 1.61e-03 | 6.79e-02 | 0.067 |
| 7325 | UBE2E2 | LZE20T | Human | Esophagus | ESCC | 8.29e-03 | 5.43e-02 | 0.0662 |
| 7325 | UBE2E2 | LZE24T | Human | Esophagus | ESCC | 9.49e-14 | 3.97e-01 | 0.0596 |
| 7325 | UBE2E2 | LZE6T | Human | Esophagus | ESCC | 9.24e-05 | 1.23e-01 | 0.0845 |
| 7325 | UBE2E2 | P1T-E | Human | Esophagus | ESCC | 3.06e-04 | 2.30e-01 | 0.0875 |
| 7325 | UBE2E2 | P2T-E | Human | Esophagus | ESCC | 2.03e-21 | 2.79e-01 | 0.1177 |
| 7325 | UBE2E2 | P4T-E | Human | Esophagus | ESCC | 1.82e-09 | 1.96e-01 | 0.1323 |
| 7325 | UBE2E2 | P5T-E | Human | Esophagus | ESCC | 1.70e-22 | 4.90e-01 | 0.1327 |
| 7325 | UBE2E2 | P8T-E | Human | Esophagus | ESCC | 1.42e-09 | 2.10e-01 | 0.0889 |
| 7325 | UBE2E2 | P9T-E | Human | Esophagus | ESCC | 2.18e-21 | 5.37e-01 | 0.1131 |
| 7325 | UBE2E2 | P11T-E | Human | Esophagus | ESCC | 5.18e-10 | 3.24e-01 | 0.1426 |
| 7325 | UBE2E2 | P15T-E | Human | Esophagus | ESCC | 2.14e-06 | 1.49e-01 | 0.1149 |
| 7325 | UBE2E2 | P16T-E | Human | Esophagus | ESCC | 5.70e-20 | 3.86e-01 | 0.1153 |
| 7325 | UBE2E2 | P17T-E | Human | Esophagus | ESCC | 4.78e-10 | 3.78e-01 | 0.1278 |
| 7325 | UBE2E2 | P19T-E | Human | Esophagus | ESCC | 3.71e-04 | 6.32e-01 | 0.1662 |
| 7325 | UBE2E2 | P20T-E | Human | Esophagus | ESCC | 9.86e-42 | 8.48e-01 | 0.1124 |
| Page: 1 2 3 4 5 6 7 |
| Tissue | Expression Dynamics | Abbreviation |
| Cervix | 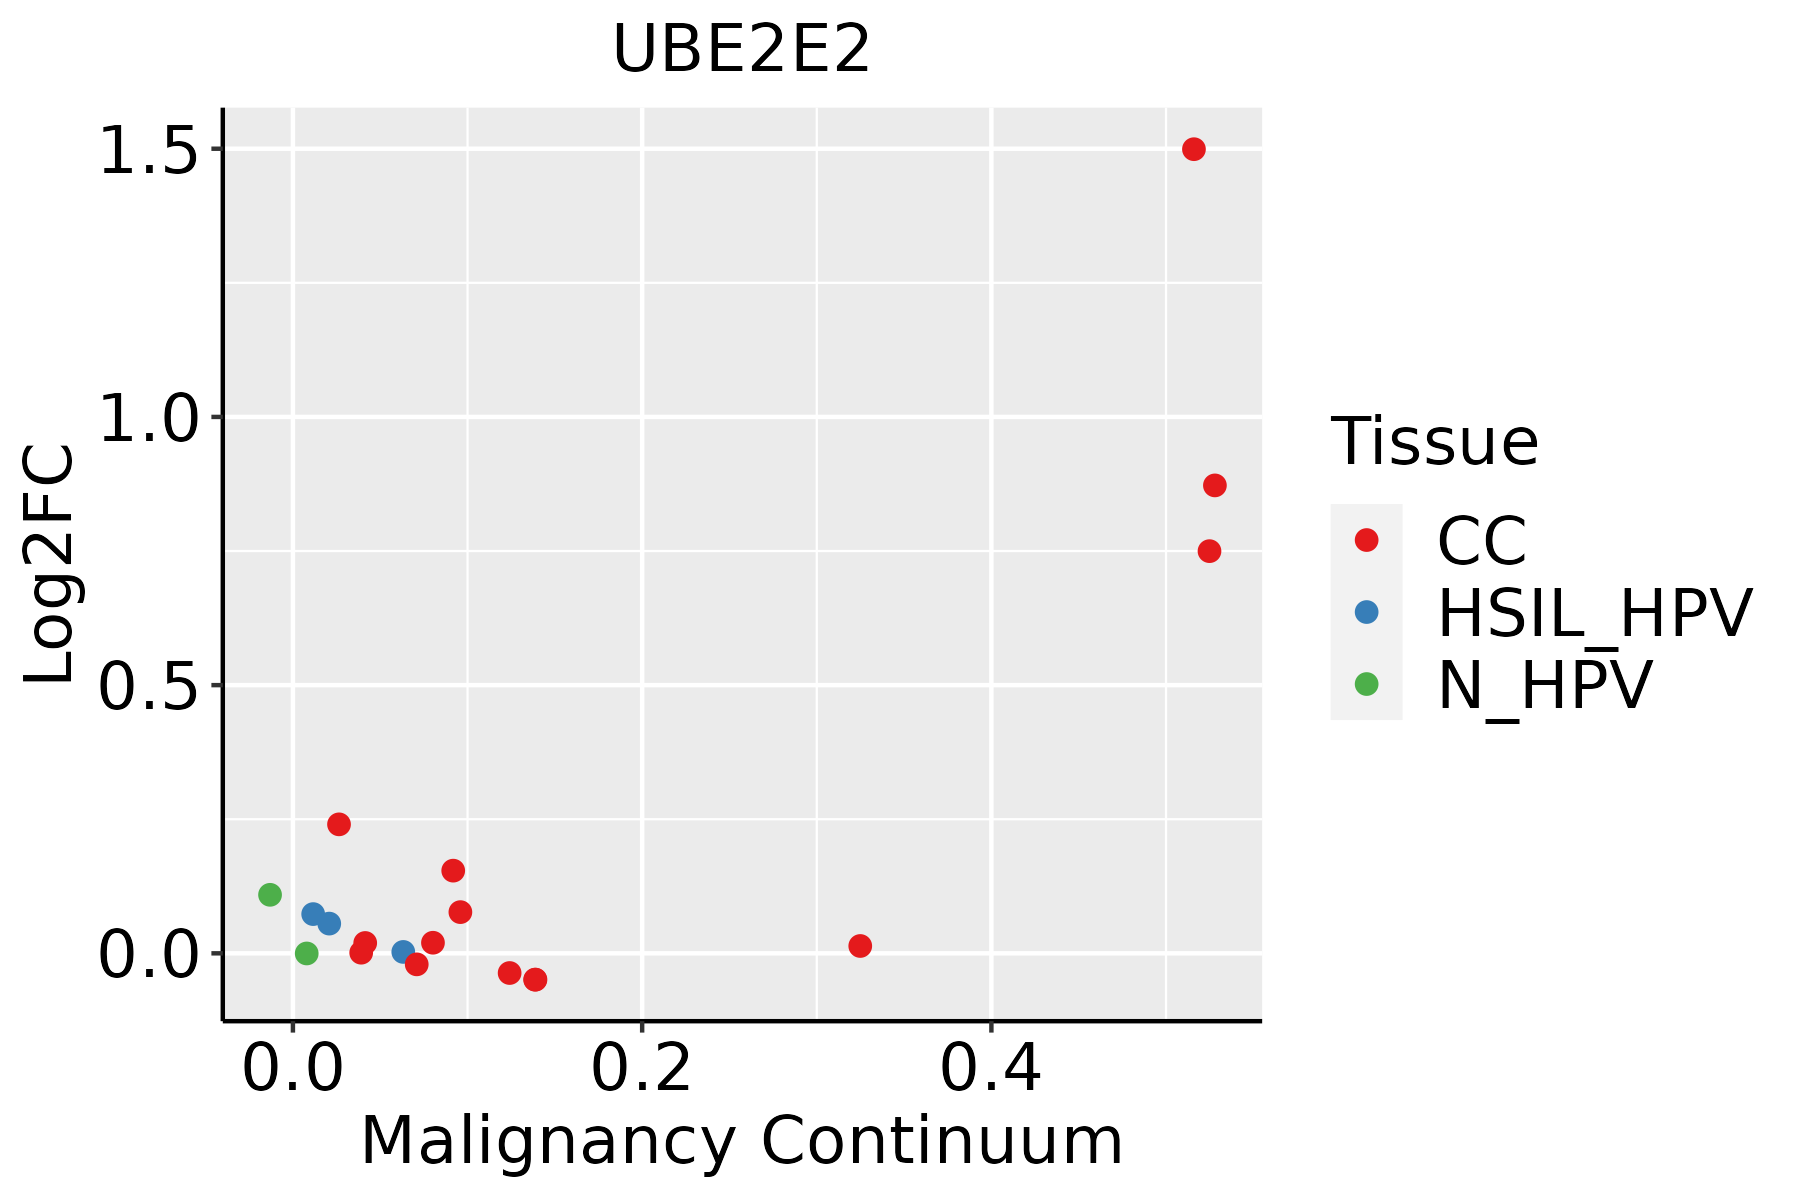 | CC: Cervix cancer |
| HSIL_HPV: HPV-infected high-grade squamous intraepithelial lesions | ||
| N_HPV: HPV-infected normal cervix | ||
| Esophagus | 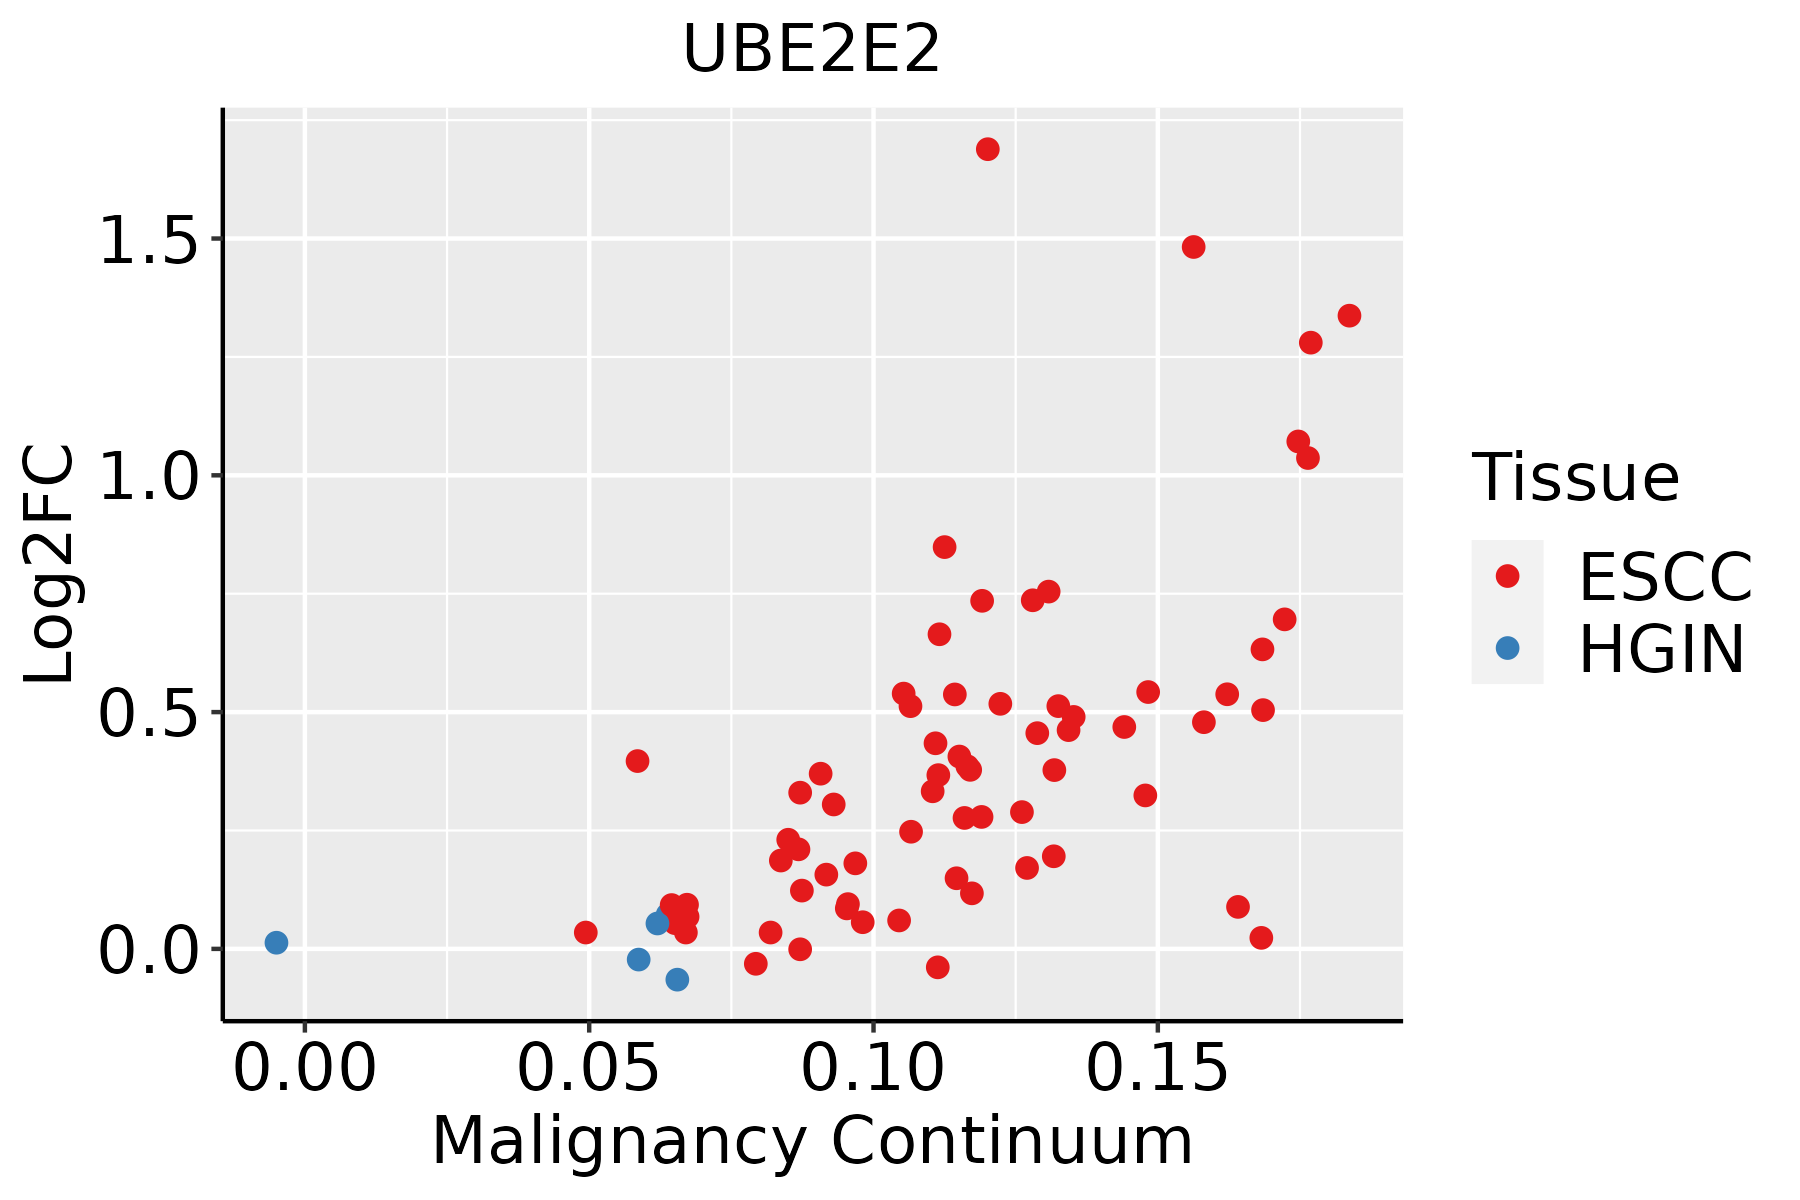 | ESCC: Esophageal squamous cell carcinoma |
| HGIN: High-grade intraepithelial neoplasias | ||
| LGIN: Low-grade intraepithelial neoplasias | ||
| Liver |  | HCC: Hepatocellular carcinoma |
| NAFLD: Non-alcoholic fatty liver disease | ||
| Lung |  | AAH: Atypical adenomatous hyperplasia |
| AIS: Adenocarcinoma in situ | ||
| IAC: Invasive lung adenocarcinoma | ||
| MIA: Minimally invasive adenocarcinoma | ||
| Oral Cavity | 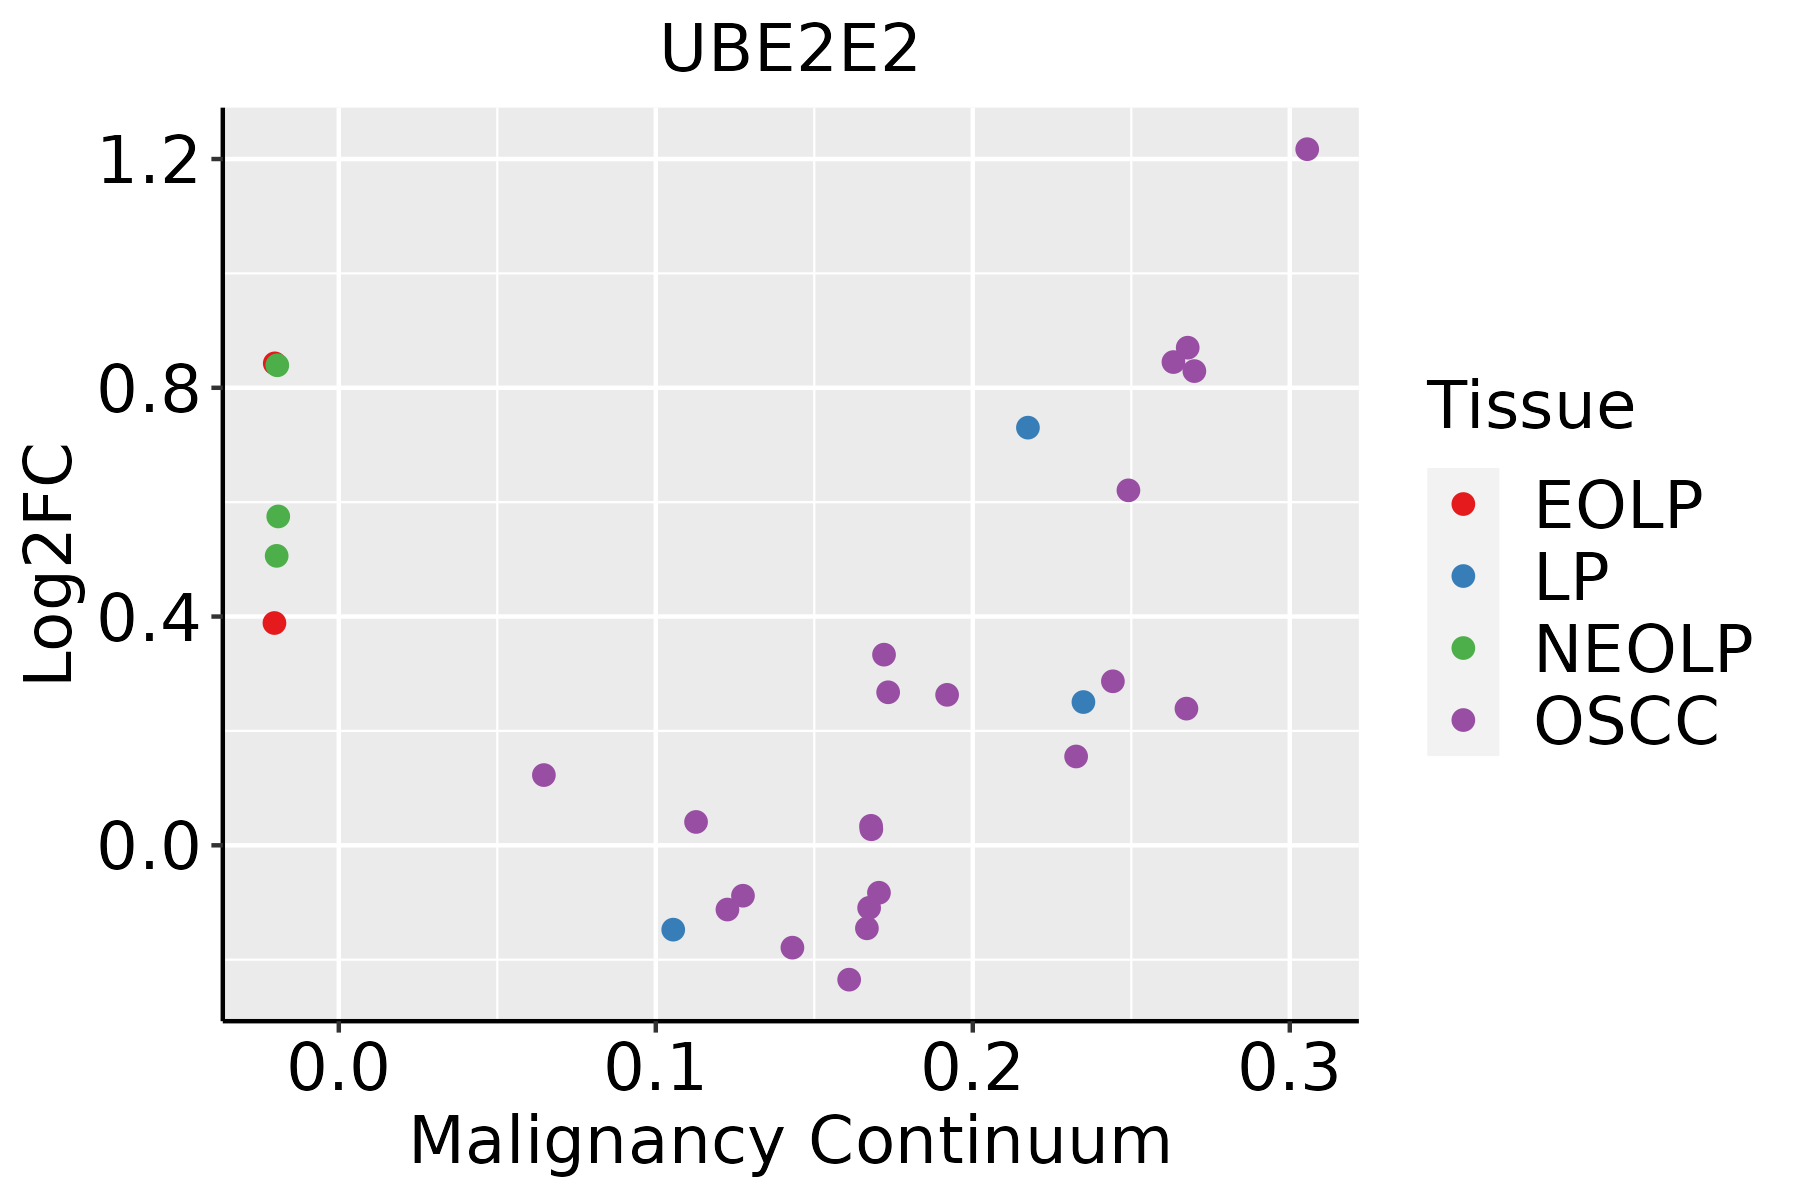 | EOLP: Erosive Oral lichen planus |
| LP: leukoplakia | ||
| NEOLP: Non-erosive oral lichen planus | ||
| OSCC: Oral squamous cell carcinoma | ||
| Prostate | 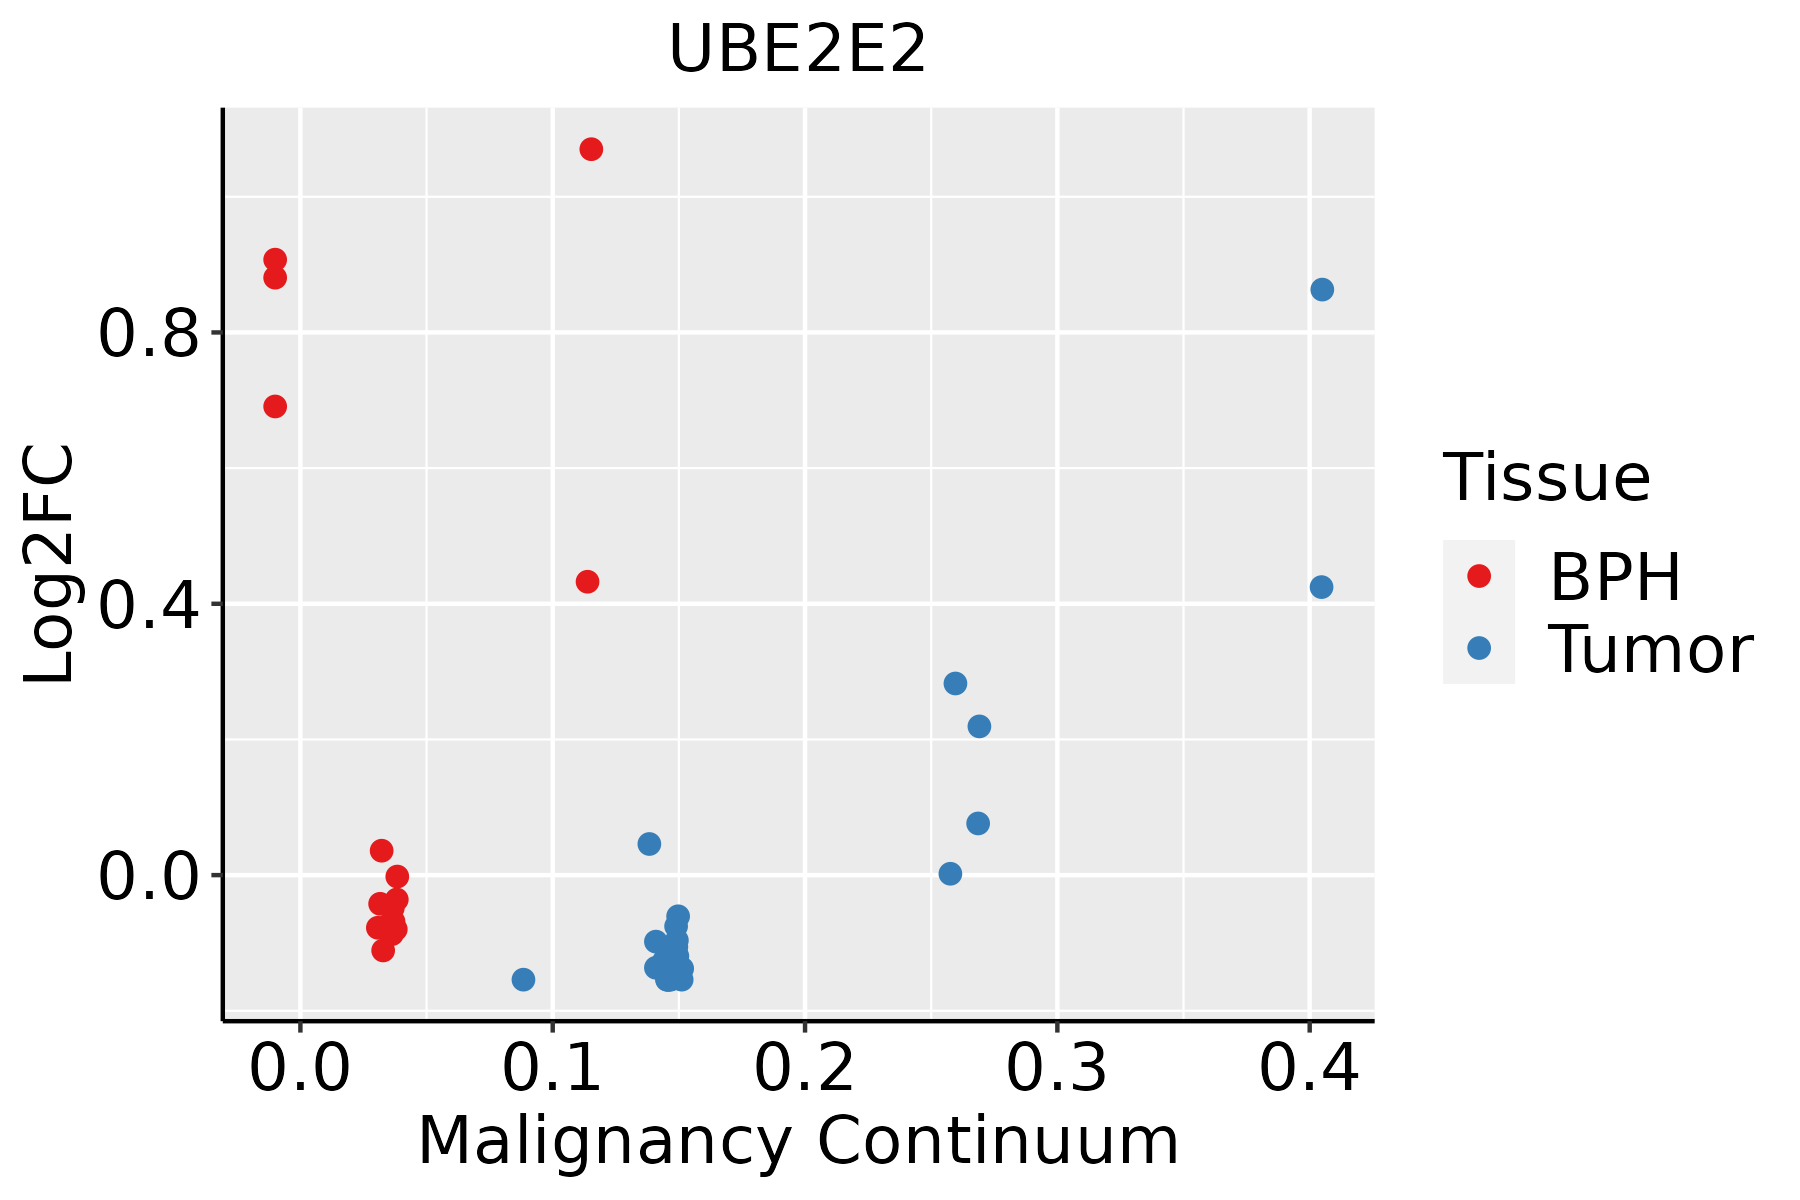 | BPH: Benign Prostatic Hyperplasia |
| Skin | 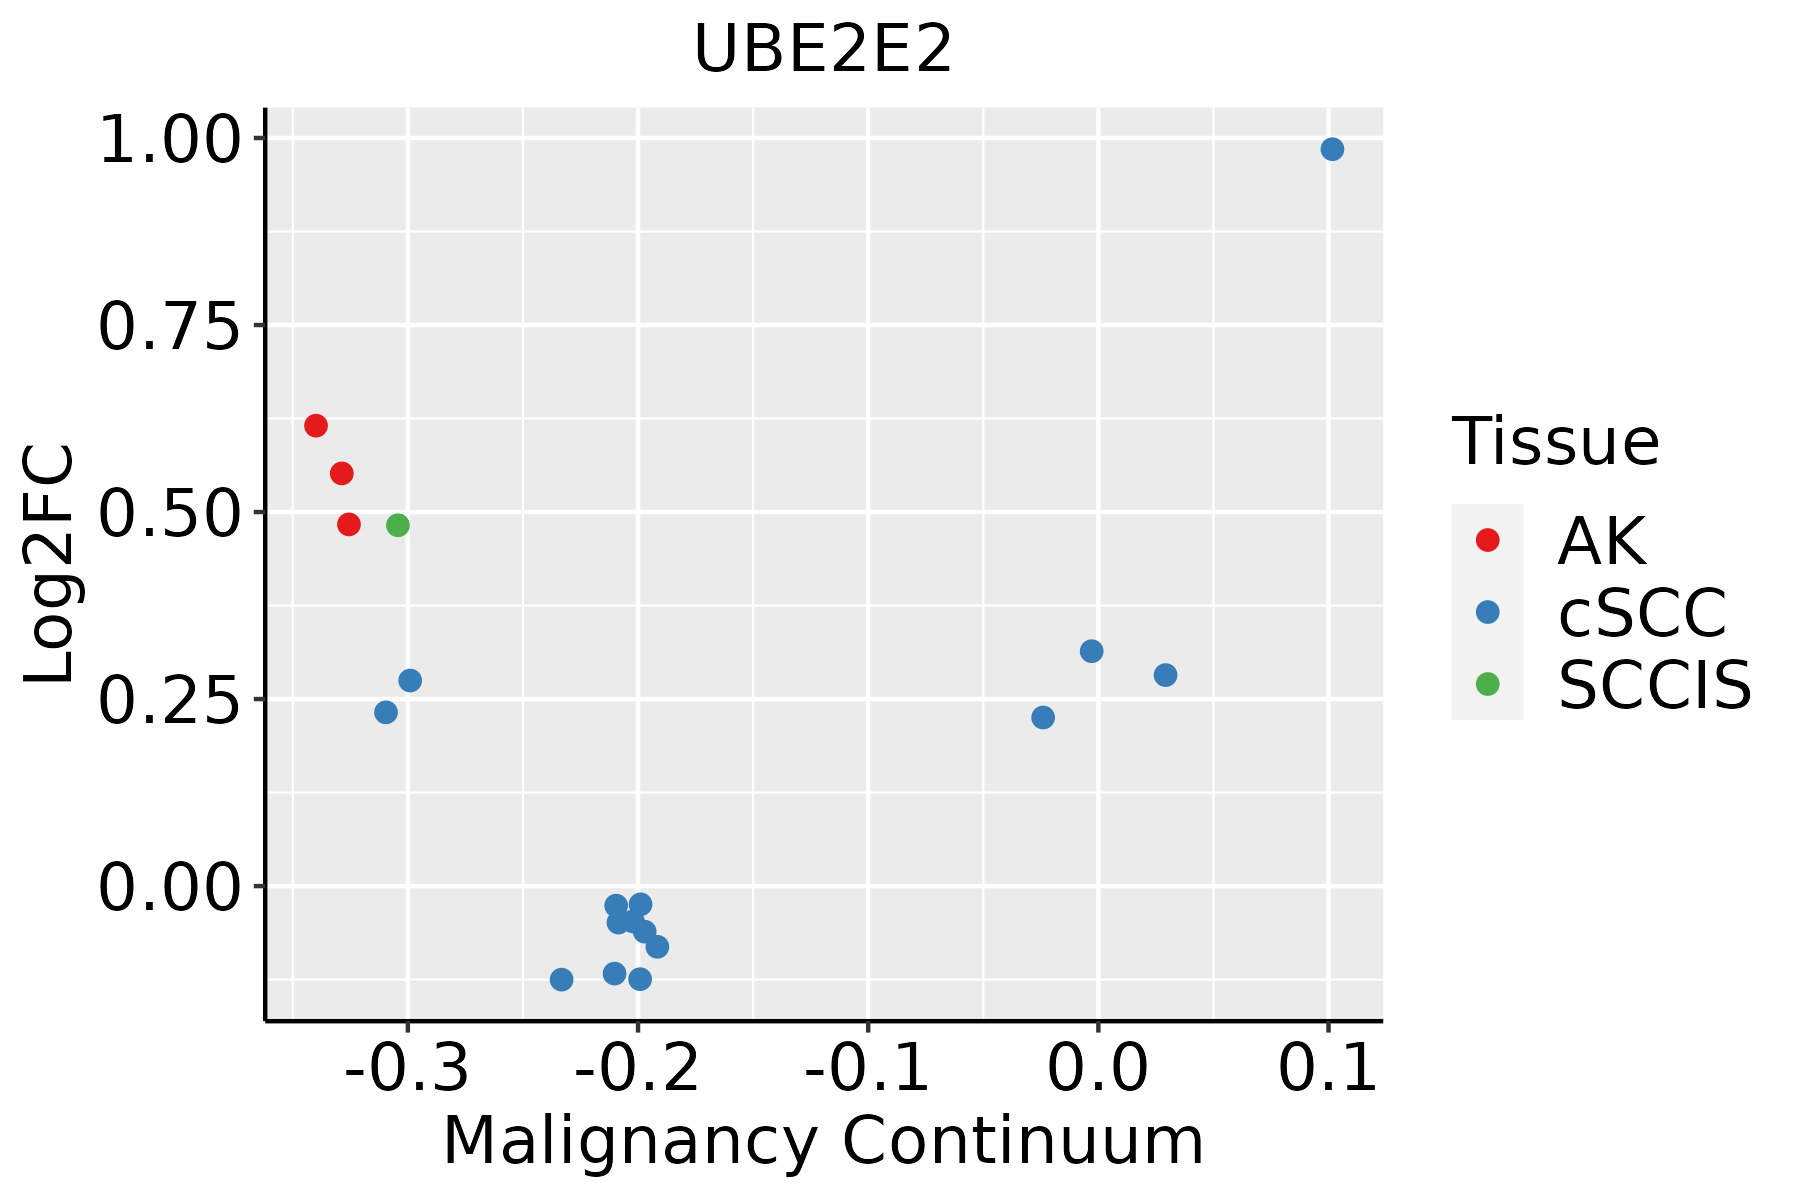 | AK: Actinic keratosis |
| cSCC: Cutaneous squamous cell carcinoma | ||
| SCCIS:squamous cell carcinoma in situ | ||
| Thyroid | 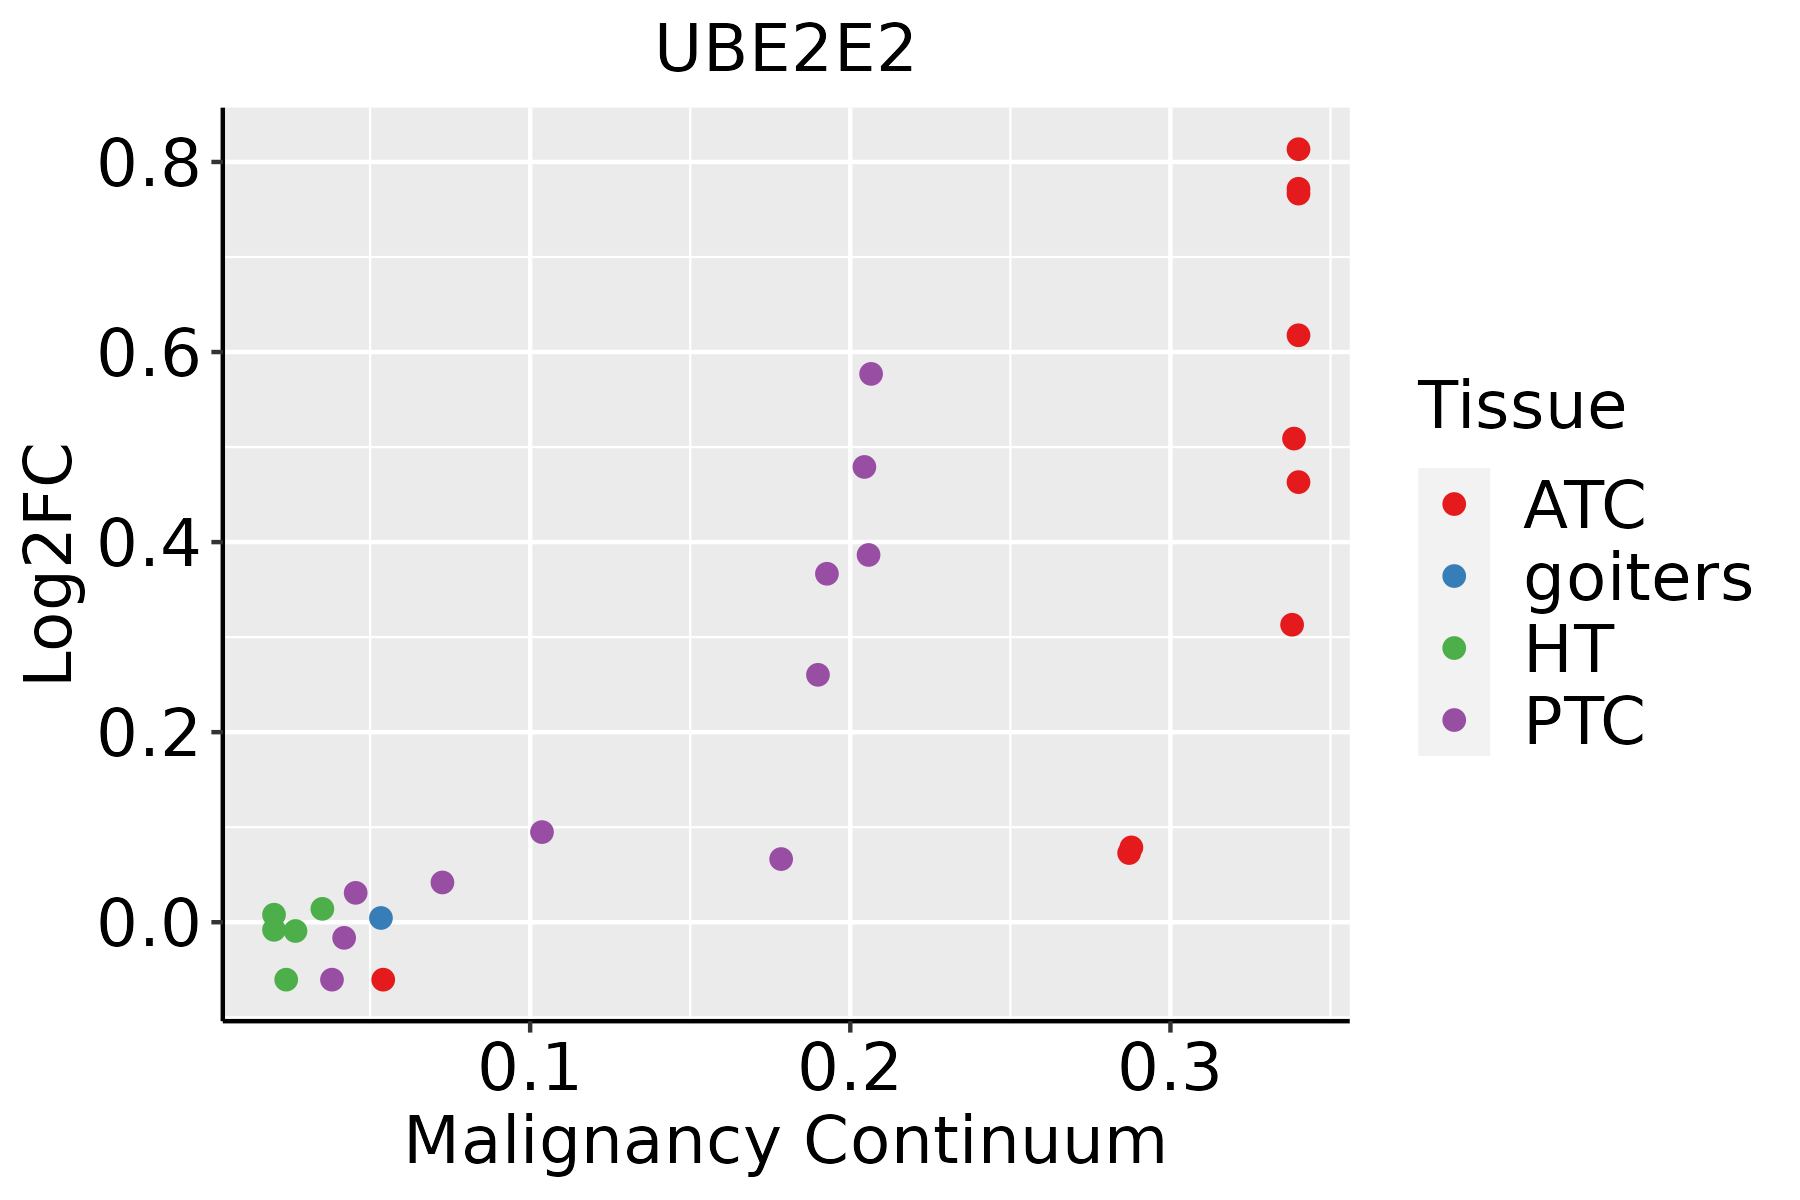 | ATC: Anaplastic thyroid cancer |
| HT: Hashimoto's thyroiditis | ||
| PTC: Papillary thyroid cancer |
| ∗log2FC in expression of this searched gene in stem-like cells from each diseased tissue sample relative to stem-like cells in normal samples in each tissue plotted against the malignancy continuum. Samples are colored based on if they are from different disease stage. |
Top |
Malignant transformation related pathway analysis |
| Find out the enriched GO biological processes and KEGG pathways involved in transition from healthy to precancer to cancer |
| Tissue | Disease Stage | Enriched GO biological Processes |
| Colorectum | AD |  |
| Colorectum | SER |  |
| Colorectum | MSS |  |
| Colorectum | MSI-H |  |
| Colorectum | FAP |  |
| ∗Top 15 enriched GO BP terms are showed in the bar plot of each disease state in each tissue. Each row represents a significant GO biological process which is colored according to the -log10(p.adjust). |
| Page: 1 2 3 4 5 6 7 8 9 |
| GO ID | Tissue | Disease Stage | Description | Gene Ratio | Bg Ratio | pvalue | p.adjust | Count |
| GO:00002097 | Cervix | CC | protein polyubiquitination | 58/2311 | 236/18723 | 1.57e-07 | 7.41e-06 | 58 |
| GO:00447725 | Cervix | CC | mitotic cell cycle phase transition | 89/2311 | 424/18723 | 2.70e-07 | 1.12e-05 | 89 |
| GO:00709366 | Cervix | CC | protein K48-linked ubiquitination | 22/2311 | 65/18723 | 5.56e-06 | 1.38e-04 | 22 |
| GO:20000453 | Cervix | CC | regulation of G1/S transition of mitotic cell cycle | 37/2311 | 142/18723 | 6.33e-06 | 1.53e-04 | 37 |
| GO:00457876 | Cervix | CC | positive regulation of cell cycle | 66/2311 | 313/18723 | 7.78e-06 | 1.81e-04 | 66 |
| GO:00000824 | Cervix | CC | G1/S transition of mitotic cell cycle | 49/2311 | 214/18723 | 1.16e-05 | 2.48e-04 | 49 |
| GO:19028062 | Cervix | CC | regulation of cell cycle G1/S phase transition | 41/2311 | 168/18723 | 1.18e-05 | 2.51e-04 | 41 |
| GO:00073466 | Cervix | CC | regulation of mitotic cell cycle | 88/2311 | 457/18723 | 1.26e-05 | 2.60e-04 | 88 |
| GO:19019903 | Cervix | CC | regulation of mitotic cell cycle phase transition | 63/2311 | 299/18723 | 1.27e-05 | 2.60e-04 | 63 |
| GO:00448434 | Cervix | CC | cell cycle G1/S phase transition | 53/2311 | 241/18723 | 1.76e-05 | 3.32e-04 | 53 |
| GO:00459316 | Cervix | CC | positive regulation of mitotic cell cycle | 32/2311 | 121/18723 | 1.88e-05 | 3.47e-04 | 32 |
| GO:19019922 | Cervix | CC | positive regulation of mitotic cell cycle phase transition | 26/2311 | 93/18723 | 3.97e-05 | 6.18e-04 | 26 |
| GO:00900685 | Cervix | CC | positive regulation of cell cycle process | 50/2311 | 236/18723 | 8.25e-05 | 1.11e-03 | 50 |
| GO:19019873 | Cervix | CC | regulation of cell cycle phase transition | 74/2311 | 390/18723 | 9.80e-05 | 1.27e-03 | 74 |
| GO:19019892 | Cervix | CC | positive regulation of cell cycle phase transition | 28/2311 | 115/18723 | 2.82e-04 | 3.07e-03 | 28 |
| GO:1900087 | Cervix | CC | positive regulation of G1/S transition of mitotic cell cycle | 13/2311 | 46/18723 | 2.95e-03 | 1.94e-02 | 13 |
| GO:00705343 | Cervix | CC | protein K63-linked ubiquitination | 14/2311 | 56/18723 | 6.93e-03 | 3.74e-02 | 14 |
| GO:1902808 | Cervix | CC | positive regulation of cell cycle G1/S phase transition | 14/2311 | 58/18723 | 9.57e-03 | 4.73e-02 | 14 |
| GO:004477212 | Cervix | N_HPV | mitotic cell cycle phase transition | 22/534 | 424/18723 | 5.33e-03 | 3.84e-02 | 22 |
| GO:004477216 | Esophagus | ESCC | mitotic cell cycle phase transition | 281/8552 | 424/18723 | 4.63e-18 | 4.45e-16 | 281 |
| Page: 1 2 3 4 5 6 7 8 9 10 11 12 |
| Pathway ID | Tissue | Disease Stage | Description | Gene Ratio | Bg Ratio | pvalue | p.adjust | qvalue | Count |
| hsa0412014 | Cervix | CC | Ubiquitin mediated proteolysis | 49/1267 | 142/8465 | 4.26e-09 | 7.68e-08 | 4.54e-08 | 49 |
| hsa0412015 | Cervix | CC | Ubiquitin mediated proteolysis | 49/1267 | 142/8465 | 4.26e-09 | 7.68e-08 | 4.54e-08 | 49 |
| hsa0412027 | Esophagus | ESCC | Ubiquitin mediated proteolysis | 122/4205 | 142/8465 | 6.53e-20 | 7.29e-18 | 3.74e-18 | 122 |
| hsa0412036 | Esophagus | ESCC | Ubiquitin mediated proteolysis | 122/4205 | 142/8465 | 6.53e-20 | 7.29e-18 | 3.74e-18 | 122 |
| hsa0412010 | Liver | NAFLD | Ubiquitin mediated proteolysis | 44/1043 | 142/8465 | 2.59e-09 | 1.70e-07 | 1.37e-07 | 44 |
| hsa0412011 | Liver | NAFLD | Ubiquitin mediated proteolysis | 44/1043 | 142/8465 | 2.59e-09 | 1.70e-07 | 1.37e-07 | 44 |
| hsa0412021 | Liver | Cirrhotic | Ubiquitin mediated proteolysis | 72/2530 | 142/8465 | 1.32e-07 | 1.97e-06 | 1.21e-06 | 72 |
| hsa0412031 | Liver | Cirrhotic | Ubiquitin mediated proteolysis | 72/2530 | 142/8465 | 1.32e-07 | 1.97e-06 | 1.21e-06 | 72 |
| hsa0412041 | Liver | HCC | Ubiquitin mediated proteolysis | 110/4020 | 142/8465 | 1.67e-13 | 3.74e-12 | 2.08e-12 | 110 |
| hsa0412051 | Liver | HCC | Ubiquitin mediated proteolysis | 110/4020 | 142/8465 | 1.67e-13 | 3.74e-12 | 2.08e-12 | 110 |
| hsa0412022 | Lung | AIS | Ubiquitin mediated proteolysis | 41/961 | 142/8465 | 8.01e-09 | 4.33e-07 | 2.77e-07 | 41 |
| hsa0412032 | Lung | AIS | Ubiquitin mediated proteolysis | 41/961 | 142/8465 | 8.01e-09 | 4.33e-07 | 2.77e-07 | 41 |
| hsa0412020 | Oral cavity | OSCC | Ubiquitin mediated proteolysis | 105/3704 | 142/8465 | 1.83e-13 | 4.37e-12 | 2.23e-12 | 105 |
| hsa04120110 | Oral cavity | OSCC | Ubiquitin mediated proteolysis | 105/3704 | 142/8465 | 1.83e-13 | 4.37e-12 | 2.23e-12 | 105 |
| hsa0412043 | Oral cavity | EOLP | Ubiquitin mediated proteolysis | 48/1218 | 142/8465 | 3.55e-09 | 6.74e-08 | 3.98e-08 | 48 |
| hsa0412053 | Oral cavity | EOLP | Ubiquitin mediated proteolysis | 48/1218 | 142/8465 | 3.55e-09 | 6.74e-08 | 3.98e-08 | 48 |
| hsa0412061 | Oral cavity | NEOLP | Ubiquitin mediated proteolysis | 43/1112 | 142/8465 | 5.78e-08 | 9.19e-07 | 5.78e-07 | 43 |
| hsa0412071 | Oral cavity | NEOLP | Ubiquitin mediated proteolysis | 43/1112 | 142/8465 | 5.78e-08 | 9.19e-07 | 5.78e-07 | 43 |
| hsa0412018 | Prostate | BPH | Ubiquitin mediated proteolysis | 61/1718 | 142/8465 | 5.50e-10 | 9.07e-09 | 5.61e-09 | 61 |
| hsa0412019 | Prostate | BPH | Ubiquitin mediated proteolysis | 61/1718 | 142/8465 | 5.50e-10 | 9.07e-09 | 5.61e-09 | 61 |
| Page: 1 2 |
Top |
Cell-cell communication analysis |
| Identification of potential cell-cell interactions between two cell types and their ligand-receptor pairs for different disease states |
| Ligand | Receptor | LRpair | Pathway | Tissue | Disease Stage |
| Page: 1 |
Top |
Single-cell gene regulatory network inference analysis |
| Find out the significant the regulons (TFs) and the target genes of each regulon across cell types for different disease states |
| TF | Cell Type | Tissue | Disease Stage | Target Gene | RSS | Regulon Activity |
| ∗The dot plots of a searched regulon are shown for all cell subpopulations in each disease state of each tissue based on the regulon specific score inferred using pySCENIC and by calculating the average expression. |
| Page: 1 |
Top |
Somatic mutation of malignant transformation related genes |
| Annotation of somatic variants for genes involved in malignant transformation |
| Hugo Symbol | Variant Class | Variant Classification | dbSNP RS | HGVSc | HGVSp | HGVSp Short | SWISSPROT | BIOTYPE | SIFT | PolyPhen | Tumor Sample Barcode | Tissue | Histology | Sex | Age | Stage | Therapy Types | Drugs | Outcome |
| UBE2E2 | SNV | Missense_Mutation | novel | c.454N>G | p.Thr152Ala | p.T152A | Q96LR5 | protein_coding | deleterious(0) | probably_damaging(0.951) | TCGA-A6-2672-01 | Colorectum | colon adenocarcinoma | Female | >=65 | III/IV | Unknown | Unknown | SD |
| UBE2E2 | SNV | Missense_Mutation | novel | c.117N>T | p.Lys39Asn | p.K39N | Q96LR5 | protein_coding | tolerated(0.08) | benign(0) | TCGA-AZ-4315-01 | Colorectum | colon adenocarcinoma | Male | <65 | I/II | Unknown | Unknown | SD |
| UBE2E2 | SNV | Missense_Mutation | c.263N>A | p.Arg88Lys | p.R88K | Q96LR5 | protein_coding | tolerated(0.16) | benign(0.078) | TCGA-CM-5861-01 | Colorectum | colon adenocarcinoma | Female | <65 | I/II | Unknown | Unknown | PD | |
| UBE2E2 | SNV | Missense_Mutation | c.335N>A | p.Pro112Gln | p.P112Q | Q96LR5 | protein_coding | tolerated(0.19) | benign(0.029) | TCGA-D5-6534-01 | Colorectum | colon adenocarcinoma | Female | <65 | I/II | Unknown | Unknown | SD | |
| UBE2E2 | SNV | Missense_Mutation | c.409N>A | p.Val137Met | p.V137M | Q96LR5 | protein_coding | tolerated(0.08) | benign(0.055) | TCGA-D5-6930-01 | Colorectum | colon adenocarcinoma | Male | >=65 | I/II | Unknown | Unknown | SD | |
| UBE2E2 | SNV | Missense_Mutation | c.330T>G | p.Phe110Leu | p.F110L | Q96LR5 | protein_coding | deleterious(0.02) | possibly_damaging(0.766) | TCGA-AG-3725-01 | Colorectum | rectum adenocarcinoma | Female | >=65 | III/IV | Unknown | Unknown | SD | |
| UBE2E2 | SNV | Missense_Mutation | c.235C>A | p.Pro79Thr | p.P79T | Q96LR5 | protein_coding | deleterious(0) | probably_damaging(0.993) | TCGA-AG-4007-01 | Colorectum | rectum adenocarcinoma | Male | >=65 | III/IV | Unknown | Unknown | SD | |
| UBE2E2 | deletion | Frame_Shift_Del | novel | c.606delN | p.Ter202%3D | p.*202%3D | Q96LR5 | protein_coding | TCGA-CM-4743-01 | Colorectum | colon adenocarcinoma | Male | >=65 | I/II | Chemotherapy | capecitabine | SD | ||
| UBE2E2 | SNV | Missense_Mutation | novel | c.500N>A | p.Cys167Tyr | p.C167Y | Q96LR5 | protein_coding | deleterious(0.03) | possibly_damaging(0.575) | TCGA-AX-A1CE-01 | Endometrium | uterine corpus endometrioid carcinoma | Female | <65 | I/II | Unspecific | Paclitaxel | SD |
| UBE2E2 | SNV | Missense_Mutation | c.573N>T | p.Met191Ile | p.M191I | Q96LR5 | protein_coding | tolerated(1) | benign(0.006) | TCGA-D1-A174-01 | Endometrium | uterine corpus endometrioid carcinoma | Female | <65 | I/II | Unknown | Unknown | SD |
| Page: 1 2 3 |
Top |
Related drugs of malignant transformation related genes |
| Identification of chemicals and drugs interact with genes involved in malignant transfromation |
| (DGIdb 4.0) |
| Entrez ID | Symbol | Category | Interaction Types | Drug Claim Name | Drug Name | PMIDs |
| Page: 1 |

Copyright 2023-Present -The University of Texas Health Science Center at Houston |