
|
|||||
|
 | |
| |
| |
| |
| |
| |
|
Gene: UBE2E1 |
Gene summary for UBE2E1 |
| Gene information | Species | Human | Gene symbol | UBE2E1 | Gene ID | 7324 |
| Gene name | ubiquitin conjugating enzyme E2 E1 | |
| Gene Alias | UBCH6 | |
| Cytomap | 3p24.2 | |
| Gene Type | protein-coding | GO ID | GO:0000209 | UniProtAcc | P51965 |
Top |
Malignant transformation analysis |
| Identification of the aberrant gene expression in precancerous and cancerous lesions by comparing the gene expression of stem-like cells in diseased tissues with normal stem cells |
| Entrez ID | Symbol | Replicates | Species | Organ | Tissue | Adj P-value | Log2FC | Malignancy |
| 7324 | UBE2E1 | CCI_3 | Human | Cervix | CC | 3.07e-09 | 7.44e-01 | 0.516 |
| 7324 | UBE2E1 | HTA11_3410_2000001011 | Human | Colorectum | AD | 2.09e-15 | -5.39e-01 | 0.0155 |
| 7324 | UBE2E1 | HTA11_3361_2000001011 | Human | Colorectum | AD | 7.52e-04 | -4.97e-01 | -0.1207 |
| 7324 | UBE2E1 | HTA11_5212_2000001011 | Human | Colorectum | AD | 1.98e-02 | -5.75e-01 | -0.2061 |
| 7324 | UBE2E1 | HTA11_7862_2000001011 | Human | Colorectum | AD | 6.98e-04 | -3.20e-01 | -0.0179 |
| 7324 | UBE2E1 | HTA11_866_3004761011 | Human | Colorectum | AD | 3.09e-03 | -3.90e-01 | 0.096 |
| 7324 | UBE2E1 | HTA11_7696_3000711011 | Human | Colorectum | AD | 7.04e-06 | -4.05e-01 | 0.0674 |
| 7324 | UBE2E1 | HTA11_99999974143_84620 | Human | Colorectum | MSS | 1.31e-13 | -5.08e-01 | 0.3005 |
| 7324 | UBE2E1 | F007 | Human | Colorectum | FAP | 2.60e-03 | -2.44e-01 | 0.1176 |
| 7324 | UBE2E1 | A002-C-010 | Human | Colorectum | FAP | 3.73e-03 | -1.61e-01 | 0.242 |
| 7324 | UBE2E1 | A001-C-207 | Human | Colorectum | FAP | 1.98e-03 | -2.53e-01 | 0.1278 |
| 7324 | UBE2E1 | A015-C-203 | Human | Colorectum | FAP | 1.12e-35 | -6.68e-01 | -0.1294 |
| 7324 | UBE2E1 | A015-C-204 | Human | Colorectum | FAP | 2.34e-14 | -5.72e-01 | -0.0228 |
| 7324 | UBE2E1 | A014-C-040 | Human | Colorectum | FAP | 1.12e-11 | -7.68e-01 | -0.1184 |
| 7324 | UBE2E1 | A002-C-201 | Human | Colorectum | FAP | 4.24e-23 | -5.16e-01 | 0.0324 |
| 7324 | UBE2E1 | A002-C-203 | Human | Colorectum | FAP | 4.91e-04 | -2.18e-01 | 0.2786 |
| 7324 | UBE2E1 | A001-C-119 | Human | Colorectum | FAP | 8.46e-19 | -7.34e-01 | -0.1557 |
| 7324 | UBE2E1 | A001-C-108 | Human | Colorectum | FAP | 1.97e-25 | -5.69e-01 | -0.0272 |
| 7324 | UBE2E1 | A002-C-205 | Human | Colorectum | FAP | 7.01e-32 | -6.46e-01 | -0.1236 |
| 7324 | UBE2E1 | A001-C-104 | Human | Colorectum | FAP | 6.61e-06 | -3.50e-01 | 0.0184 |
| Page: 1 2 3 4 5 6 7 8 |
| Tissue | Expression Dynamics | Abbreviation |
| Cervix | 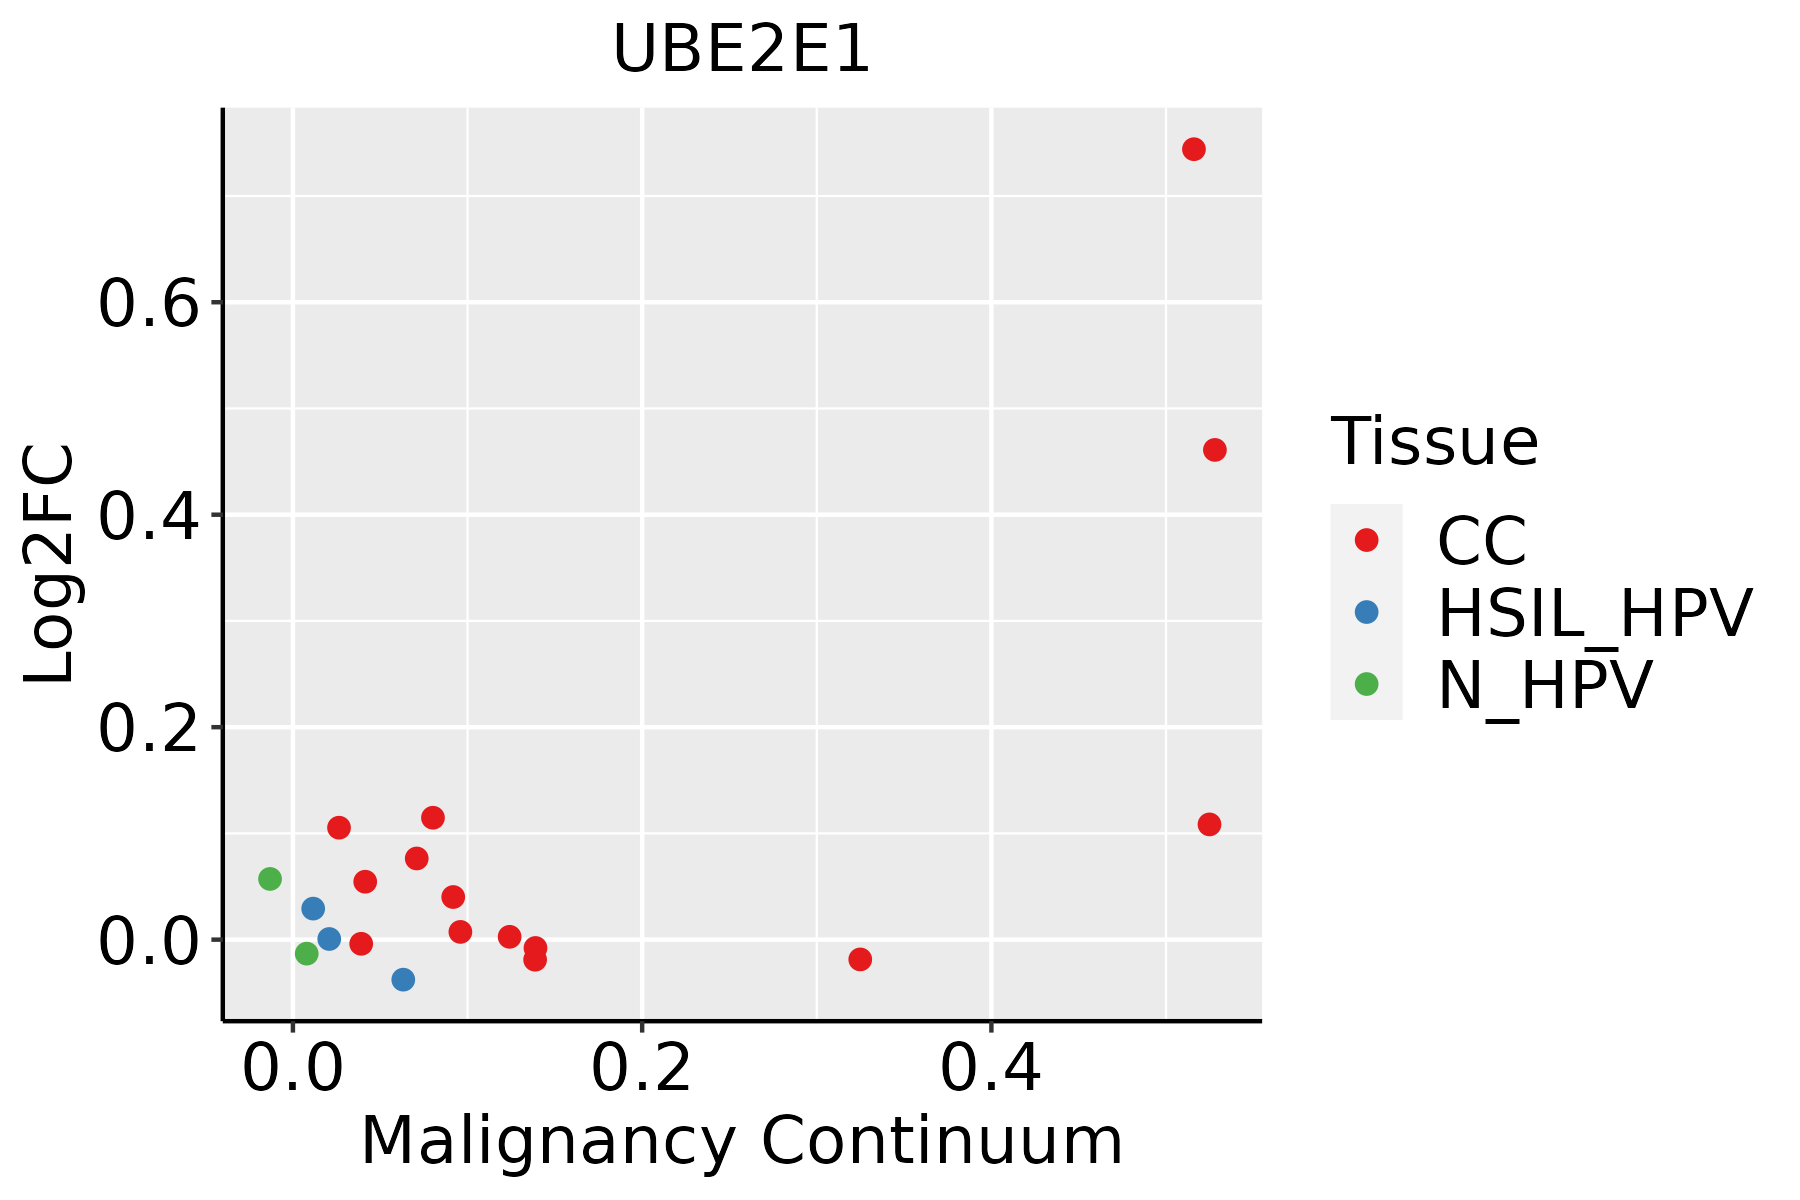 | CC: Cervix cancer |
| HSIL_HPV: HPV-infected high-grade squamous intraepithelial lesions | ||
| N_HPV: HPV-infected normal cervix | ||
| Colorectum (GSE201348) |  | FAP: Familial adenomatous polyposis |
| CRC: Colorectal cancer | ||
| Colorectum (HTA11) |  | AD: Adenomas |
| SER: Sessile serrated lesions | ||
| MSI-H: Microsatellite-high colorectal cancer | ||
| MSS: Microsatellite stable colorectal cancer | ||
| Esophagus | 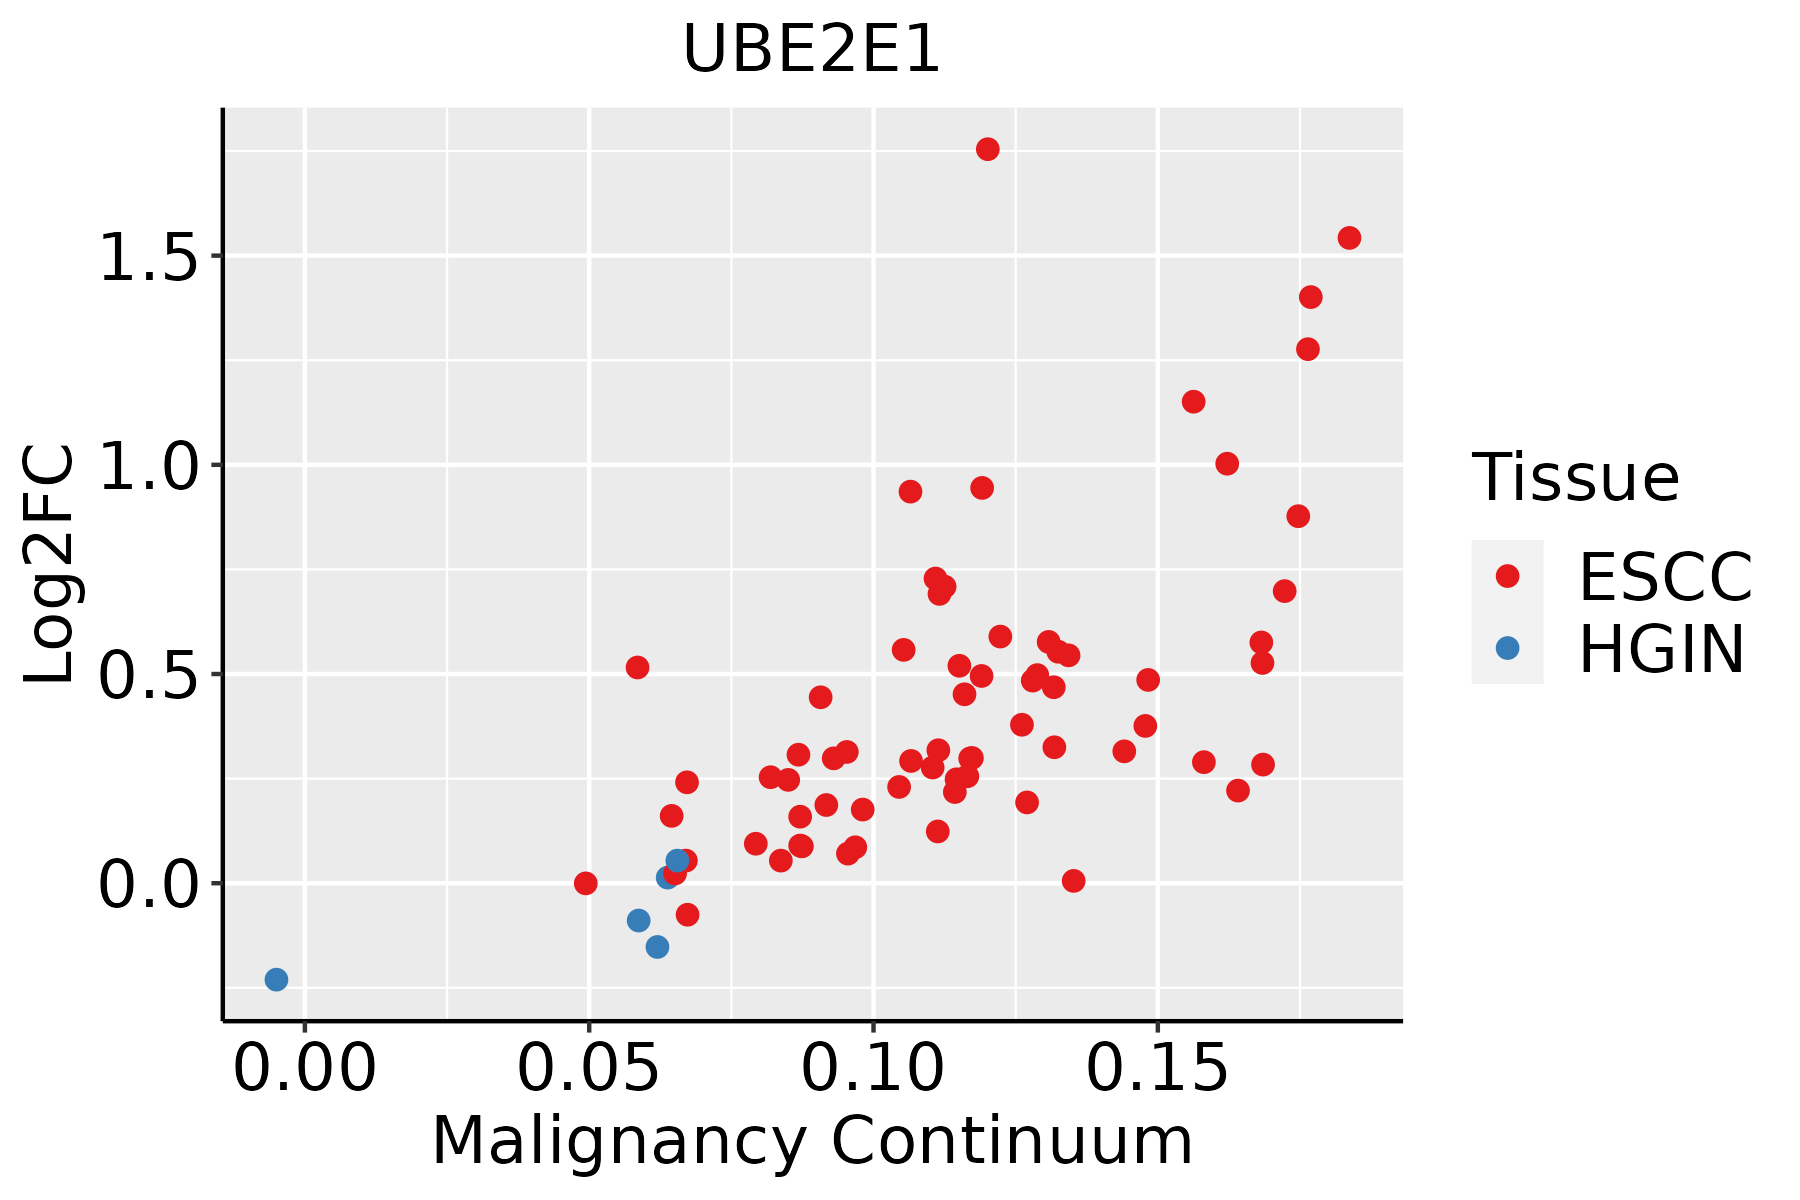 | ESCC: Esophageal squamous cell carcinoma |
| HGIN: High-grade intraepithelial neoplasias | ||
| LGIN: Low-grade intraepithelial neoplasias | ||
| Liver |  | HCC: Hepatocellular carcinoma |
| NAFLD: Non-alcoholic fatty liver disease | ||
| Oral Cavity | 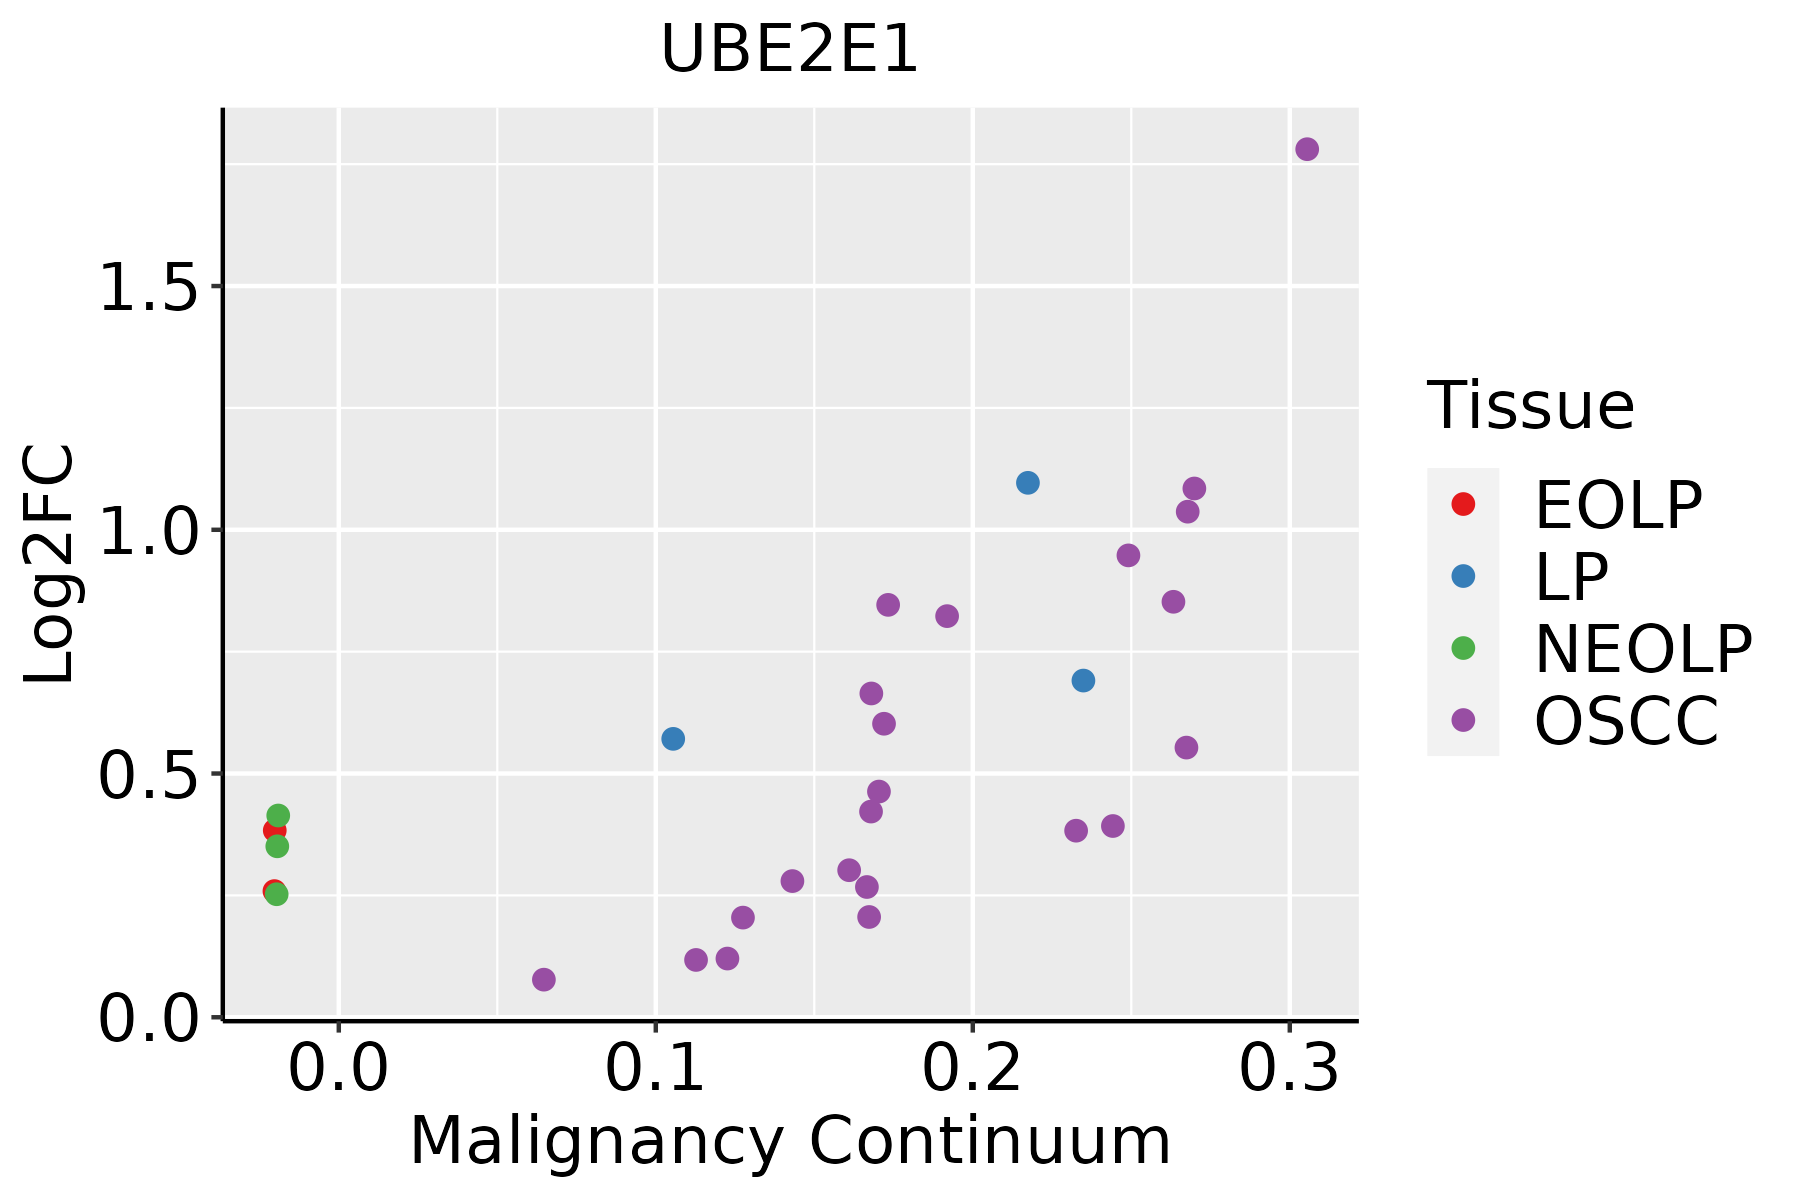 | EOLP: Erosive Oral lichen planus |
| LP: leukoplakia | ||
| NEOLP: Non-erosive oral lichen planus | ||
| OSCC: Oral squamous cell carcinoma | ||
| Prostate |  | BPH: Benign Prostatic Hyperplasia |
| Skin |  | AK: Actinic keratosis |
| cSCC: Cutaneous squamous cell carcinoma | ||
| SCCIS:squamous cell carcinoma in situ |
| ∗log2FC in expression of this searched gene in stem-like cells from each diseased tissue sample relative to stem-like cells in normal samples in each tissue plotted against the malignancy continuum. Samples are colored based on if they are from different disease stage. |
Top |
Malignant transformation related pathway analysis |
| Find out the enriched GO biological processes and KEGG pathways involved in transition from healthy to precancer to cancer |
| Tissue | Disease Stage | Enriched GO biological Processes |
| Colorectum | AD |  |
| Colorectum | SER |  |
| Colorectum | MSS |  |
| Colorectum | MSI-H |  |
| Colorectum | FAP |  |
| ∗Top 15 enriched GO BP terms are showed in the bar plot of each disease state in each tissue. Each row represents a significant GO biological process which is colored according to the -log10(p.adjust). |
| Page: 1 2 3 4 5 6 7 8 9 |
| GO ID | Tissue | Disease Stage | Description | Gene Ratio | Bg Ratio | pvalue | p.adjust | Count |
| GO:00002097 | Cervix | CC | protein polyubiquitination | 58/2311 | 236/18723 | 1.57e-07 | 7.41e-06 | 58 |
| GO:00709366 | Cervix | CC | protein K48-linked ubiquitination | 22/2311 | 65/18723 | 5.56e-06 | 1.38e-04 | 22 |
| GO:00165705 | Cervix | CC | histone modification | 84/2311 | 463/18723 | 1.70e-04 | 2.01e-03 | 84 |
| GO:0000209 | Colorectum | AD | protein polyubiquitination | 78/3918 | 236/18723 | 8.71e-06 | 2.06e-04 | 78 |
| GO:0070936 | Colorectum | AD | protein K48-linked ubiquitination | 27/3918 | 65/18723 | 1.31e-04 | 1.88e-03 | 27 |
| GO:0006513 | Colorectum | AD | protein monoubiquitination | 23/3918 | 67/18723 | 7.55e-03 | 4.58e-02 | 23 |
| GO:00002092 | Colorectum | MSS | protein polyubiquitination | 72/3467 | 236/18723 | 5.19e-06 | 1.42e-04 | 72 |
| GO:00709361 | Colorectum | MSS | protein K48-linked ubiquitination | 27/3467 | 65/18723 | 1.40e-05 | 3.18e-04 | 27 |
| GO:0016570 | Colorectum | MSS | histone modification | 113/3467 | 463/18723 | 8.37e-04 | 8.68e-03 | 113 |
| GO:00065131 | Colorectum | MSS | protein monoubiquitination | 21/3467 | 67/18723 | 7.90e-03 | 4.84e-02 | 21 |
| GO:0016574 | Colorectum | MSS | histone ubiquitination | 16/3467 | 47/18723 | 8.22e-03 | 4.99e-02 | 16 |
| GO:00709362 | Colorectum | FAP | protein K48-linked ubiquitination | 24/2622 | 65/18723 | 3.42e-06 | 1.23e-04 | 24 |
| GO:00002093 | Colorectum | FAP | protein polyubiquitination | 59/2622 | 236/18723 | 4.53e-06 | 1.52e-04 | 59 |
| GO:00165701 | Colorectum | FAP | histone modification | 94/2622 | 463/18723 | 1.06e-04 | 1.76e-03 | 94 |
| GO:00165741 | Colorectum | FAP | histone ubiquitination | 14/2622 | 47/18723 | 3.95e-03 | 2.75e-02 | 14 |
| GO:00065132 | Colorectum | FAP | protein monoubiquitination | 18/2622 | 67/18723 | 4.08e-03 | 2.81e-02 | 18 |
| GO:00709363 | Colorectum | CRC | protein K48-linked ubiquitination | 19/2078 | 65/18723 | 5.34e-05 | 1.22e-03 | 19 |
| GO:00002094 | Colorectum | CRC | protein polyubiquitination | 46/2078 | 236/18723 | 9.91e-05 | 1.98e-03 | 46 |
| GO:00165702 | Colorectum | CRC | histone modification | 75/2078 | 463/18723 | 4.95e-04 | 7.06e-03 | 75 |
| GO:001657015 | Esophagus | ESCC | histone modification | 323/8552 | 463/18723 | 2.61e-26 | 7.88e-24 | 323 |
| Page: 1 2 3 4 |
| Pathway ID | Tissue | Disease Stage | Description | Gene Ratio | Bg Ratio | pvalue | p.adjust | qvalue | Count |
| hsa04120 | Colorectum | AD | Ubiquitin mediated proteolysis | 58/2092 | 142/8465 | 1.46e-05 | 1.53e-04 | 9.76e-05 | 58 |
| hsa041201 | Colorectum | AD | Ubiquitin mediated proteolysis | 58/2092 | 142/8465 | 1.46e-05 | 1.53e-04 | 9.76e-05 | 58 |
| hsa041206 | Colorectum | FAP | Ubiquitin mediated proteolysis | 51/1404 | 142/8465 | 1.55e-08 | 5.84e-07 | 3.55e-07 | 51 |
| hsa041207 | Colorectum | FAP | Ubiquitin mediated proteolysis | 51/1404 | 142/8465 | 1.55e-08 | 5.84e-07 | 3.55e-07 | 51 |
| hsa041208 | Colorectum | CRC | Ubiquitin mediated proteolysis | 42/1091 | 142/8465 | 9.98e-08 | 6.67e-06 | 4.52e-06 | 42 |
| hsa041209 | Colorectum | CRC | Ubiquitin mediated proteolysis | 42/1091 | 142/8465 | 9.98e-08 | 6.67e-06 | 4.52e-06 | 42 |
| hsa0412027 | Esophagus | ESCC | Ubiquitin mediated proteolysis | 122/4205 | 142/8465 | 6.53e-20 | 7.29e-18 | 3.74e-18 | 122 |
| hsa0412036 | Esophagus | ESCC | Ubiquitin mediated proteolysis | 122/4205 | 142/8465 | 6.53e-20 | 7.29e-18 | 3.74e-18 | 122 |
| hsa0412021 | Liver | Cirrhotic | Ubiquitin mediated proteolysis | 72/2530 | 142/8465 | 1.32e-07 | 1.97e-06 | 1.21e-06 | 72 |
| hsa0412031 | Liver | Cirrhotic | Ubiquitin mediated proteolysis | 72/2530 | 142/8465 | 1.32e-07 | 1.97e-06 | 1.21e-06 | 72 |
| hsa0412041 | Liver | HCC | Ubiquitin mediated proteolysis | 110/4020 | 142/8465 | 1.67e-13 | 3.74e-12 | 2.08e-12 | 110 |
| hsa0412051 | Liver | HCC | Ubiquitin mediated proteolysis | 110/4020 | 142/8465 | 1.67e-13 | 3.74e-12 | 2.08e-12 | 110 |
| hsa0412020 | Oral cavity | OSCC | Ubiquitin mediated proteolysis | 105/3704 | 142/8465 | 1.83e-13 | 4.37e-12 | 2.23e-12 | 105 |
| hsa04120110 | Oral cavity | OSCC | Ubiquitin mediated proteolysis | 105/3704 | 142/8465 | 1.83e-13 | 4.37e-12 | 2.23e-12 | 105 |
| hsa0412025 | Oral cavity | LP | Ubiquitin mediated proteolysis | 66/2418 | 142/8465 | 3.74e-06 | 3.46e-05 | 2.23e-05 | 66 |
| hsa0412035 | Oral cavity | LP | Ubiquitin mediated proteolysis | 66/2418 | 142/8465 | 3.74e-06 | 3.46e-05 | 2.23e-05 | 66 |
| hsa0412043 | Oral cavity | EOLP | Ubiquitin mediated proteolysis | 48/1218 | 142/8465 | 3.55e-09 | 6.74e-08 | 3.98e-08 | 48 |
| hsa0412053 | Oral cavity | EOLP | Ubiquitin mediated proteolysis | 48/1218 | 142/8465 | 3.55e-09 | 6.74e-08 | 3.98e-08 | 48 |
| hsa0412061 | Oral cavity | NEOLP | Ubiquitin mediated proteolysis | 43/1112 | 142/8465 | 5.78e-08 | 9.19e-07 | 5.78e-07 | 43 |
| hsa0412071 | Oral cavity | NEOLP | Ubiquitin mediated proteolysis | 43/1112 | 142/8465 | 5.78e-08 | 9.19e-07 | 5.78e-07 | 43 |
| Page: 1 2 |
Top |
Cell-cell communication analysis |
| Identification of potential cell-cell interactions between two cell types and their ligand-receptor pairs for different disease states |
| Ligand | Receptor | LRpair | Pathway | Tissue | Disease Stage |
| Page: 1 |
Top |
Single-cell gene regulatory network inference analysis |
| Find out the significant the regulons (TFs) and the target genes of each regulon across cell types for different disease states |
| TF | Cell Type | Tissue | Disease Stage | Target Gene | RSS | Regulon Activity |
| ∗The dot plots of a searched regulon are shown for all cell subpopulations in each disease state of each tissue based on the regulon specific score inferred using pySCENIC and by calculating the average expression. |
| Page: 1 |
Top |
Somatic mutation of malignant transformation related genes |
| Annotation of somatic variants for genes involved in malignant transformation |
| Hugo Symbol | Variant Class | Variant Classification | dbSNP RS | HGVSc | HGVSp | HGVSp Short | SWISSPROT | BIOTYPE | SIFT | PolyPhen | Tumor Sample Barcode | Tissue | Histology | Sex | Age | Stage | Therapy Types | Drugs | Outcome |
| UBE2E1 | SNV | Missense_Mutation | c.491N>G | p.Pro164Arg | p.P164R | P51965 | protein_coding | deleterious(0.01) | possibly_damaging(0.768) | TCGA-A2-A0T0-01 | Breast | breast invasive carcinoma | Female | <65 | I/II | Chemotherapy | taxotere | SD | |
| UBE2E1 | SNV | Missense_Mutation | c.409G>C | p.Asp137His | p.D137H | P51965 | protein_coding | deleterious(0.01) | probably_damaging(0.944) | TCGA-C5-A7CO-01 | Cervix | cervical & endocervical cancer | Female | >=65 | I/II | Chemotherapy | cisplatin | SD | |
| UBE2E1 | SNV | Missense_Mutation | c.69N>T | p.Glu23Asp | p.E23D | P51965 | protein_coding | tolerated(0.12) | benign(0) | TCGA-AA-3710-01 | Colorectum | colon adenocarcinoma | Female | >=65 | I/II | Unknown | Unknown | SD | |
| UBE2E1 | SNV | Missense_Mutation | c.164N>G | p.Glu55Gly | p.E55G | P51965 | protein_coding | deleterious(0) | probably_damaging(0.998) | TCGA-AA-3715-01 | Colorectum | colon adenocarcinoma | Male | >=65 | I/II | Unknown | Unknown | PD | |
| UBE2E1 | SNV | Missense_Mutation | c.569G>T | p.Arg190Ile | p.R190I | P51965 | protein_coding | deleterious(0) | possibly_damaging(0.838) | TCGA-AA-A010-01 | Colorectum | colon adenocarcinoma | Female | <65 | I/II | Chemotherapy | folinic | CR | |
| UBE2E1 | SNV | Missense_Mutation | novel | c.482N>A | p.Pro161His | p.P161H | P51965 | protein_coding | deleterious(0) | probably_damaging(0.997) | TCGA-A5-A0G2-01 | Endometrium | uterine corpus endometrioid carcinoma | Female | <65 | III/IV | Unknown | Unknown | SD |
| UBE2E1 | SNV | Missense_Mutation | c.359N>G | p.Tyr120Cys | p.Y120C | P51965 | protein_coding | deleterious(0) | probably_damaging(0.996) | TCGA-A5-A0RA-01 | Endometrium | uterine corpus endometrioid carcinoma | Female | >=65 | I/II | Unknown | Unknown | SD | |
| UBE2E1 | SNV | Missense_Mutation | novel | c.353N>T | p.Arg118Ile | p.R118I | P51965 | protein_coding | deleterious(0) | probably_damaging(0.994) | TCGA-AJ-A3EL-01 | Endometrium | uterine corpus endometrioid carcinoma | Female | <65 | I/II | Unknown | Unknown | SD |
| UBE2E1 | SNV | Missense_Mutation | c.28N>G | p.Thr10Ala | p.T10A | P51965 | protein_coding | tolerated_low_confidence(0.16) | benign(0.007) | TCGA-AP-A0LM-01 | Endometrium | uterine corpus endometrioid carcinoma | Female | <65 | III/IV | Chemotherapy | cisplatin | SD | |
| UBE2E1 | SNV | Missense_Mutation | c.491N>T | p.Pro164Leu | p.P164L | P51965 | protein_coding | deleterious(0) | probably_damaging(0.995) | TCGA-AX-A1CE-01 | Endometrium | uterine corpus endometrioid carcinoma | Female | <65 | I/II | Unspecific | Paclitaxel | SD |
| Page: 1 2 |
Top |
Related drugs of malignant transformation related genes |
| Identification of chemicals and drugs interact with genes involved in malignant transfromation |
| (DGIdb 4.0) |
| Entrez ID | Symbol | Category | Interaction Types | Drug Claim Name | Drug Name | PMIDs |
| Page: 1 |

Copyright 2023-Present -The University of Texas Health Science Center at Houston |