| Tissue | Expression Dynamics | Abbreviation |
| Cervix |  | CC: Cervix cancer |
| HSIL_HPV: HPV-infected high-grade squamous intraepithelial lesions |
| N_HPV: HPV-infected normal cervix |
| Colorectum (GSE201348) |  | FAP: Familial adenomatous polyposis |
| CRC: Colorectal cancer |
| Colorectum (HTA11) |  | AD: Adenomas |
| SER: Sessile serrated lesions |
| MSI-H: Microsatellite-high colorectal cancer |
| MSS: Microsatellite stable colorectal cancer |
| Endometrium | 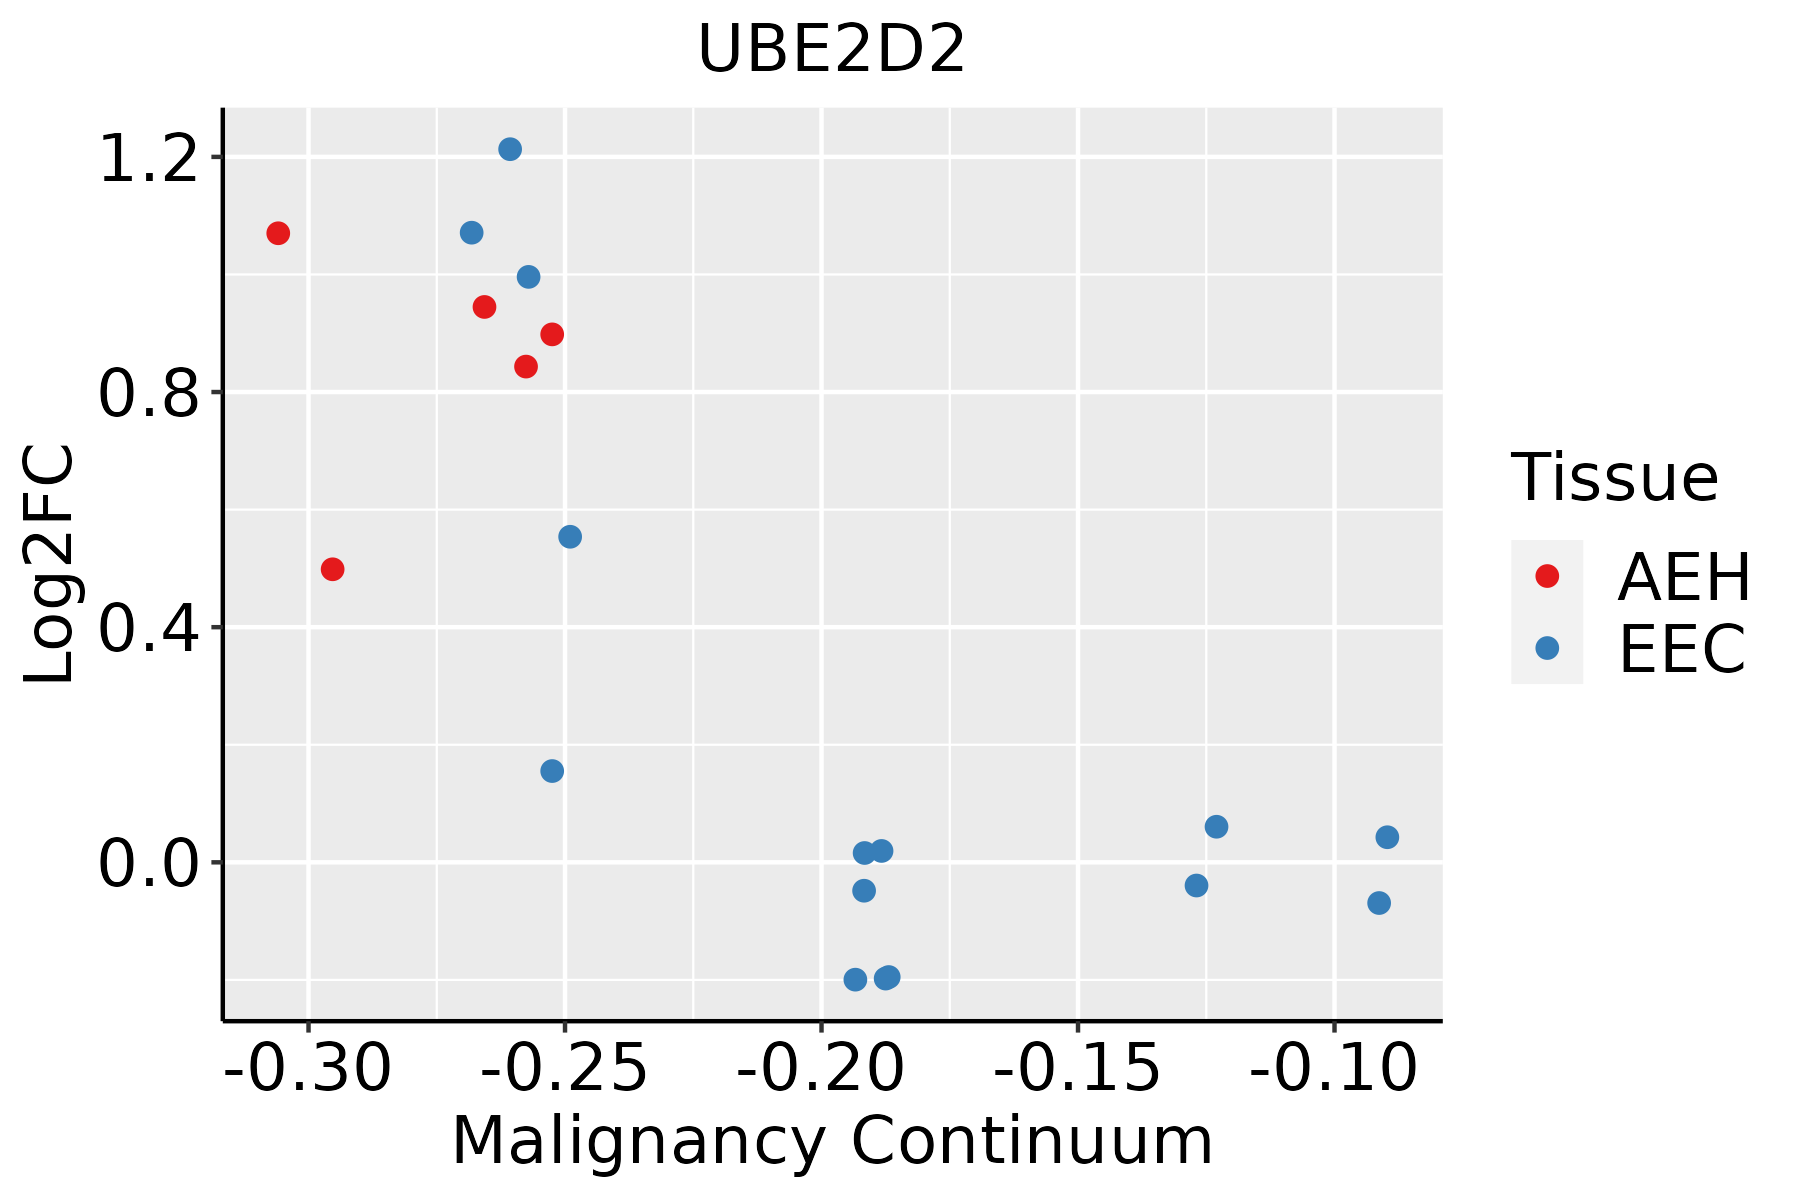 | AEH: Atypical endometrial hyperplasia |
| EEC: Endometrioid Cancer |
| Esophagus |  | ESCC: Esophageal squamous cell carcinoma |
| HGIN: High-grade intraepithelial neoplasias |
| LGIN: Low-grade intraepithelial neoplasias |
| Liver |  | HCC: Hepatocellular carcinoma |
| NAFLD: Non-alcoholic fatty liver disease |
| Oral Cavity | 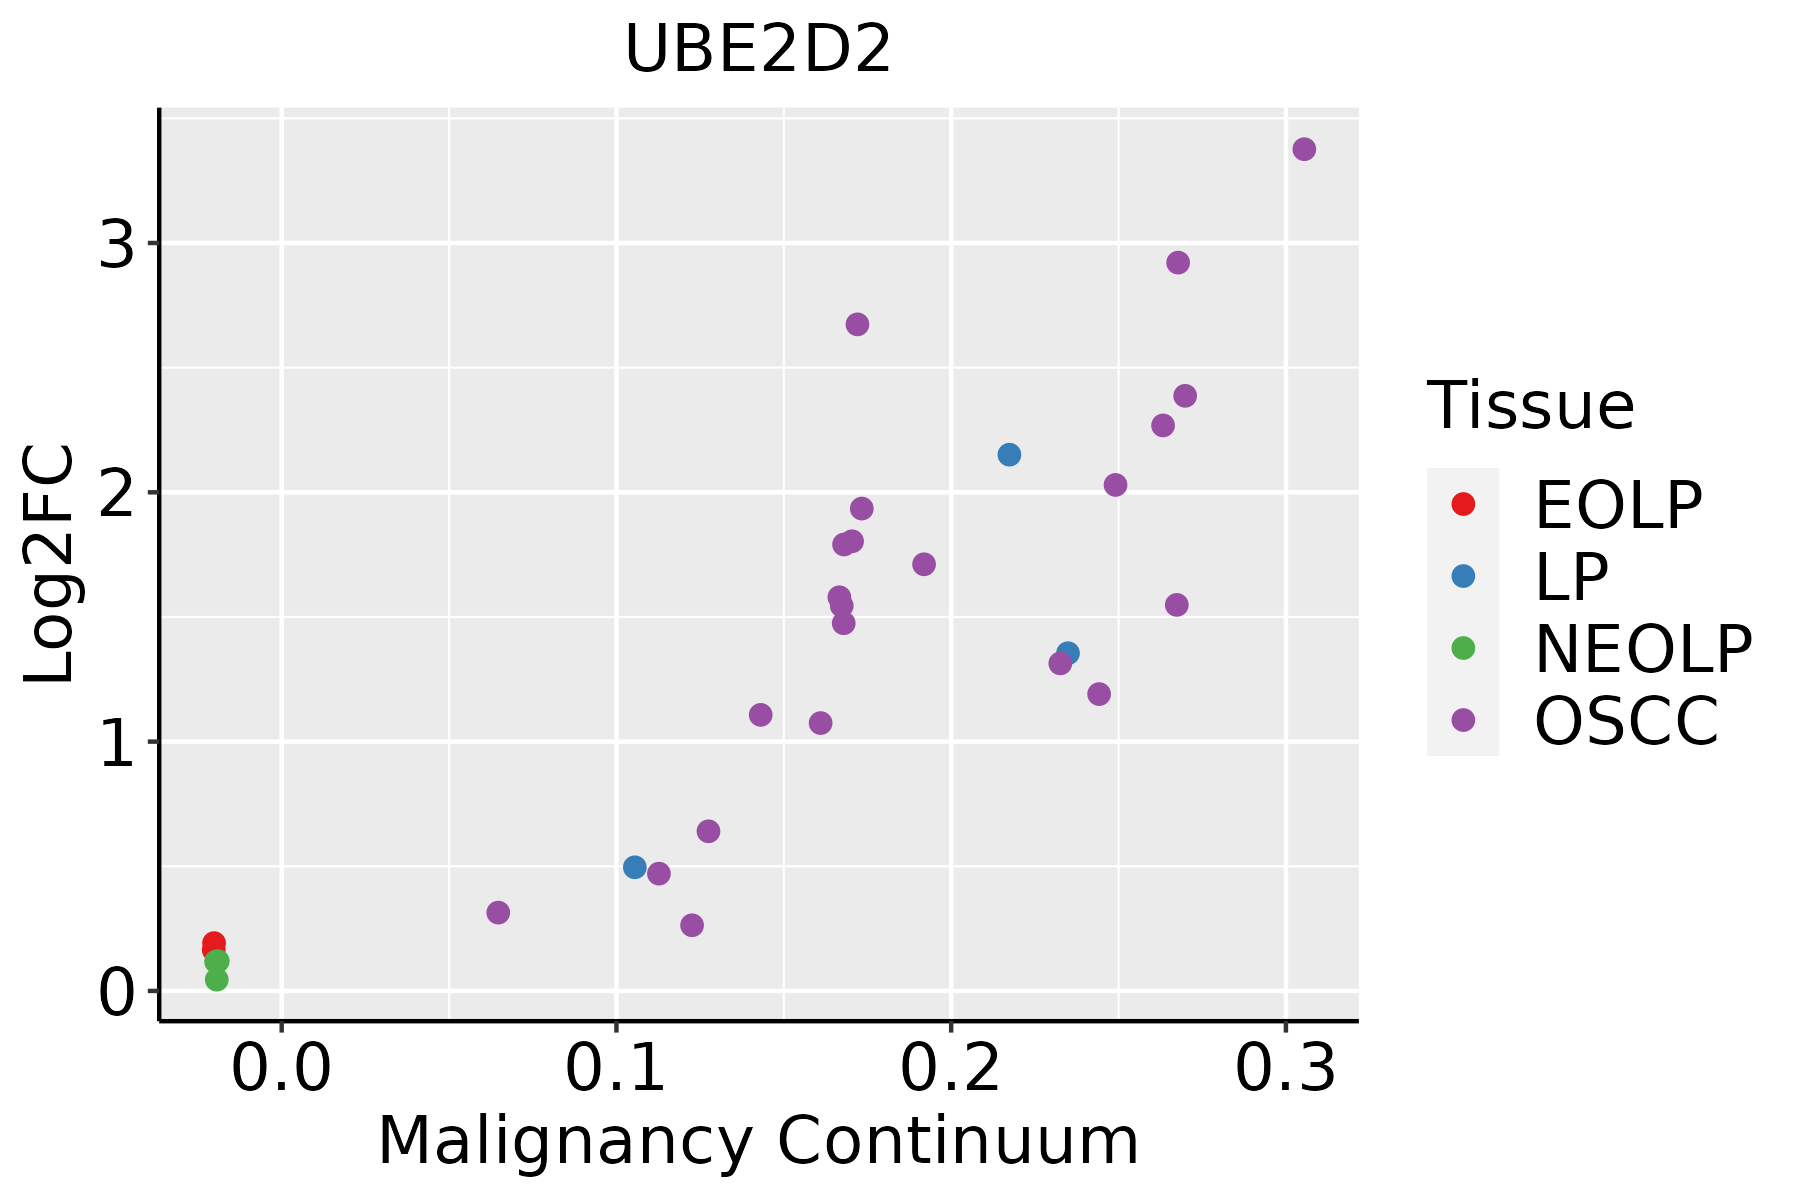 | EOLP: Erosive Oral lichen planus |
| LP: leukoplakia |
| NEOLP: Non-erosive oral lichen planus |
| OSCC: Oral squamous cell carcinoma |
| Prostate | 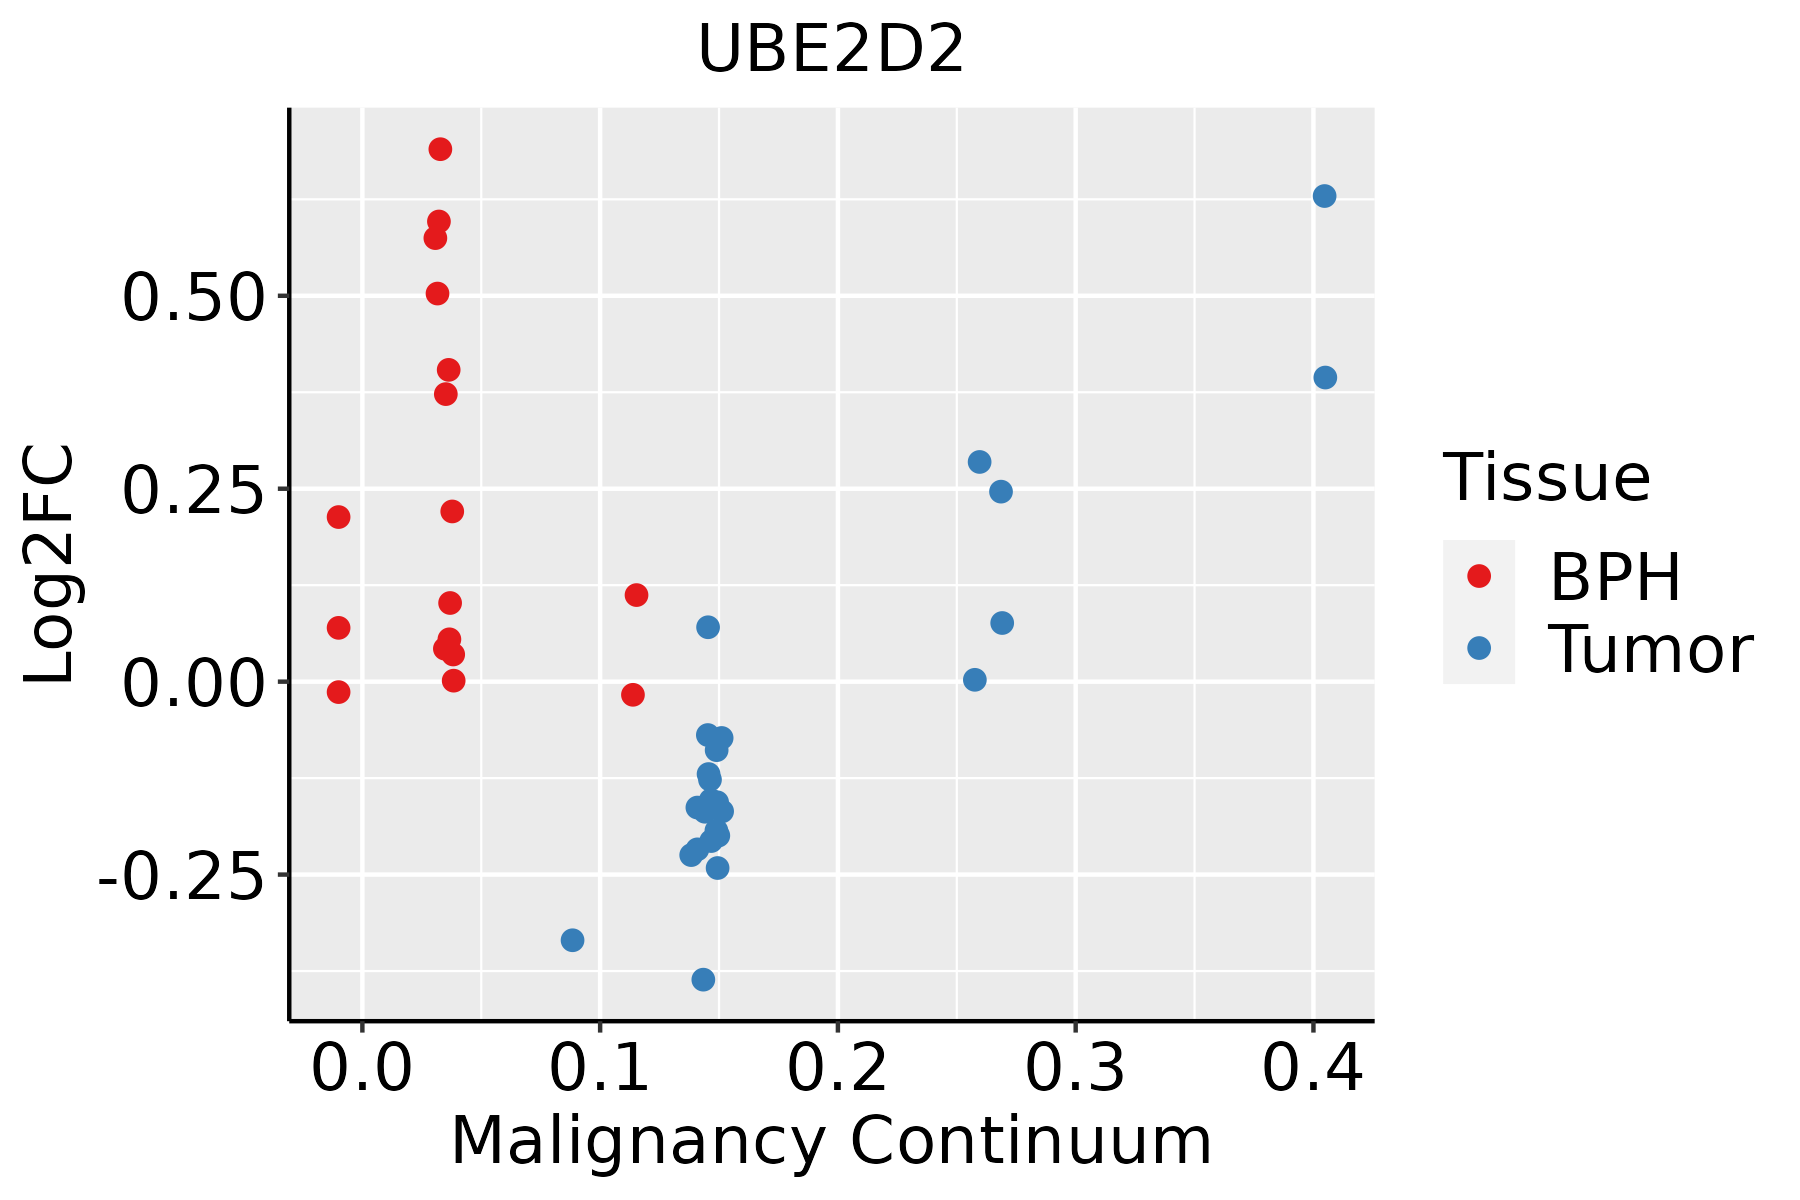 | BPH: Benign Prostatic Hyperplasia |
| Skin | 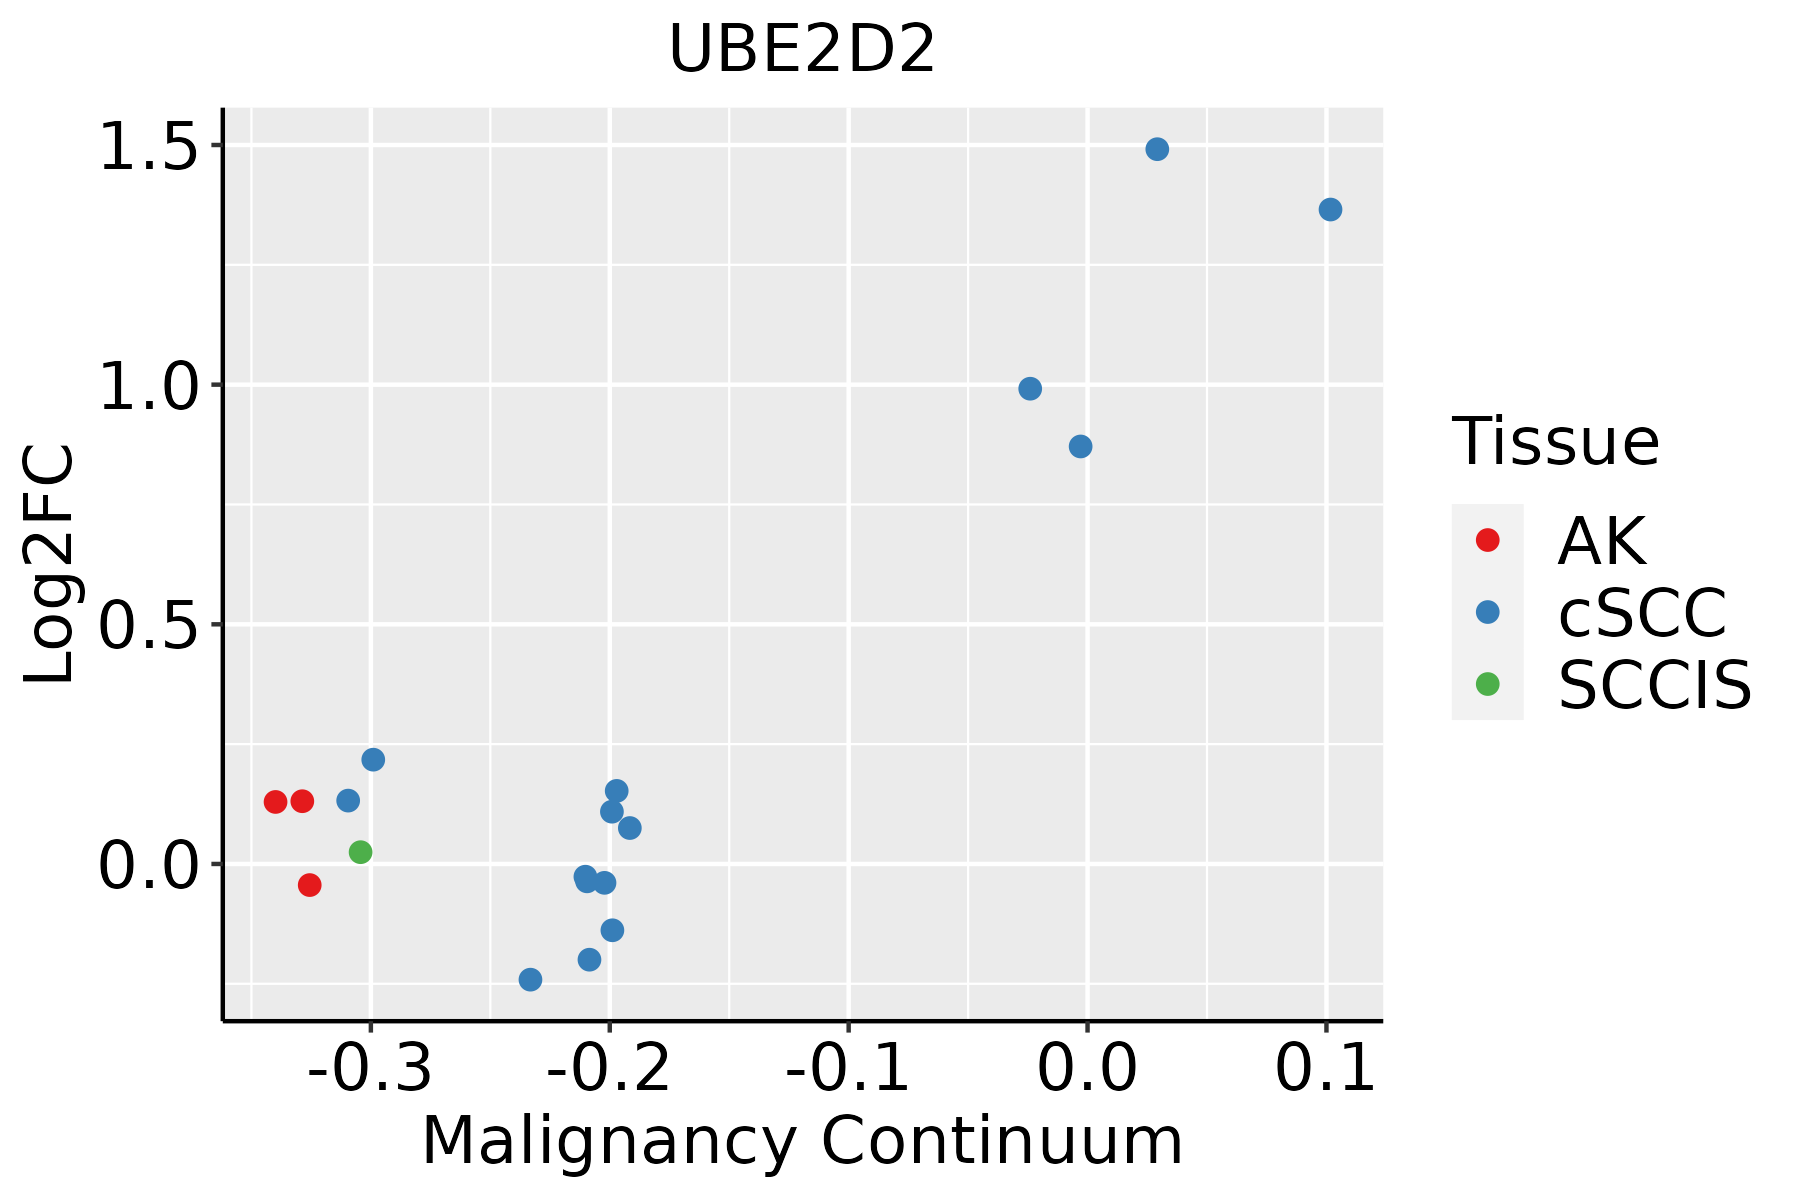 | AK: Actinic keratosis |
| cSCC: Cutaneous squamous cell carcinoma |
| SCCIS:squamous cell carcinoma in situ |
| Thyroid |  | ATC: Anaplastic thyroid cancer |
| HT: Hashimoto's thyroiditis |
| PTC: Papillary thyroid cancer |
| GO ID | Tissue | Disease Stage | Description | Gene Ratio | Bg Ratio | pvalue | p.adjust | Count |
| GO:00002097 | Cervix | CC | protein polyubiquitination | 58/2311 | 236/18723 | 1.57e-07 | 7.41e-06 | 58 |
| GO:00709366 | Cervix | CC | protein K48-linked ubiquitination | 22/2311 | 65/18723 | 5.56e-06 | 1.38e-04 | 22 |
| GO:00518656 | Cervix | CC | protein autoubiquitination | 17/2311 | 73/18723 | 6.71e-03 | 3.70e-02 | 17 |
| GO:0000209 | Colorectum | AD | protein polyubiquitination | 78/3918 | 236/18723 | 8.71e-06 | 2.06e-04 | 78 |
| GO:0070936 | Colorectum | AD | protein K48-linked ubiquitination | 27/3918 | 65/18723 | 1.31e-04 | 1.88e-03 | 27 |
| GO:0051865 | Colorectum | AD | protein autoubiquitination | 28/3918 | 73/18723 | 4.87e-04 | 5.30e-03 | 28 |
| GO:00002092 | Colorectum | MSS | protein polyubiquitination | 72/3467 | 236/18723 | 5.19e-06 | 1.42e-04 | 72 |
| GO:00709361 | Colorectum | MSS | protein K48-linked ubiquitination | 27/3467 | 65/18723 | 1.40e-05 | 3.18e-04 | 27 |
| GO:00518651 | Colorectum | MSS | protein autoubiquitination | 25/3467 | 73/18723 | 1.00e-03 | 1.00e-02 | 25 |
| GO:00709362 | Colorectum | FAP | protein K48-linked ubiquitination | 24/2622 | 65/18723 | 3.42e-06 | 1.23e-04 | 24 |
| GO:00002093 | Colorectum | FAP | protein polyubiquitination | 59/2622 | 236/18723 | 4.53e-06 | 1.52e-04 | 59 |
| GO:00518652 | Colorectum | FAP | protein autoubiquitination | 22/2622 | 73/18723 | 2.88e-04 | 3.77e-03 | 22 |
| GO:00709363 | Colorectum | CRC | protein K48-linked ubiquitination | 19/2078 | 65/18723 | 5.34e-05 | 1.22e-03 | 19 |
| GO:00002094 | Colorectum | CRC | protein polyubiquitination | 46/2078 | 236/18723 | 9.91e-05 | 1.98e-03 | 46 |
| GO:00518653 | Colorectum | CRC | protein autoubiquitination | 18/2078 | 73/18723 | 8.33e-04 | 1.04e-02 | 18 |
| GO:00709367 | Endometrium | AEH | protein K48-linked ubiquitination | 21/2100 | 65/18723 | 4.56e-06 | 1.18e-04 | 21 |
| GO:00002098 | Endometrium | AEH | protein polyubiquitination | 44/2100 | 236/18723 | 4.83e-04 | 4.97e-03 | 44 |
| GO:007093614 | Endometrium | EEC | protein K48-linked ubiquitination | 22/2168 | 65/18723 | 1.92e-06 | 5.79e-05 | 22 |
| GO:000020913 | Endometrium | EEC | protein polyubiquitination | 46/2168 | 236/18723 | 2.65e-04 | 3.04e-03 | 46 |
| GO:007093610 | Esophagus | HGIN | protein K48-linked ubiquitination | 24/2587 | 65/18723 | 2.69e-06 | 9.49e-05 | 24 |
| Pathway ID | Tissue | Disease Stage | Description | Gene Ratio | Bg Ratio | pvalue | p.adjust | qvalue | Count |
| hsa0412014 | Cervix | CC | Ubiquitin mediated proteolysis | 49/1267 | 142/8465 | 4.26e-09 | 7.68e-08 | 4.54e-08 | 49 |
| hsa0414120 | Cervix | CC | Protein processing in endoplasmic reticulum | 55/1267 | 174/8465 | 1.74e-08 | 2.68e-07 | 1.58e-07 | 55 |
| hsa0513120 | Cervix | CC | Shigellosis | 69/1267 | 247/8465 | 7.64e-08 | 1.03e-06 | 6.10e-07 | 69 |
| hsa0412015 | Cervix | CC | Ubiquitin mediated proteolysis | 49/1267 | 142/8465 | 4.26e-09 | 7.68e-08 | 4.54e-08 | 49 |
| hsa04141110 | Cervix | CC | Protein processing in endoplasmic reticulum | 55/1267 | 174/8465 | 1.74e-08 | 2.68e-07 | 1.58e-07 | 55 |
| hsa05131110 | Cervix | CC | Shigellosis | 69/1267 | 247/8465 | 7.64e-08 | 1.03e-06 | 6.10e-07 | 69 |
| hsa05131 | Colorectum | AD | Shigellosis | 109/2092 | 247/8465 | 1.09e-11 | 2.44e-10 | 1.55e-10 | 109 |
| hsa04141 | Colorectum | AD | Protein processing in endoplasmic reticulum | 80/2092 | 174/8465 | 5.96e-10 | 1.25e-08 | 7.96e-09 | 80 |
| hsa04120 | Colorectum | AD | Ubiquitin mediated proteolysis | 58/2092 | 142/8465 | 1.46e-05 | 1.53e-04 | 9.76e-05 | 58 |
| hsa051311 | Colorectum | AD | Shigellosis | 109/2092 | 247/8465 | 1.09e-11 | 2.44e-10 | 1.55e-10 | 109 |
| hsa041411 | Colorectum | AD | Protein processing in endoplasmic reticulum | 80/2092 | 174/8465 | 5.96e-10 | 1.25e-08 | 7.96e-09 | 80 |
| hsa041201 | Colorectum | AD | Ubiquitin mediated proteolysis | 58/2092 | 142/8465 | 1.46e-05 | 1.53e-04 | 9.76e-05 | 58 |
| hsa041414 | Colorectum | MSS | Protein processing in endoplasmic reticulum | 75/1875 | 174/8465 | 3.78e-10 | 8.44e-09 | 5.17e-09 | 75 |
| hsa051314 | Colorectum | MSS | Shigellosis | 94/1875 | 247/8465 | 6.82e-09 | 1.34e-07 | 8.23e-08 | 94 |
| hsa041204 | Colorectum | MSS | Ubiquitin mediated proteolysis | 55/1875 | 142/8465 | 5.02e-06 | 6.00e-05 | 3.68e-05 | 55 |
| hsa041415 | Colorectum | MSS | Protein processing in endoplasmic reticulum | 75/1875 | 174/8465 | 3.78e-10 | 8.44e-09 | 5.17e-09 | 75 |
| hsa051315 | Colorectum | MSS | Shigellosis | 94/1875 | 247/8465 | 6.82e-09 | 1.34e-07 | 8.23e-08 | 94 |
| hsa041205 | Colorectum | MSS | Ubiquitin mediated proteolysis | 55/1875 | 142/8465 | 5.02e-06 | 6.00e-05 | 3.68e-05 | 55 |
| hsa041416 | Colorectum | MSI-H | Protein processing in endoplasmic reticulum | 46/797 | 174/8465 | 4.53e-11 | 9.78e-10 | 8.19e-10 | 46 |
| hsa051316 | Colorectum | MSI-H | Shigellosis | 40/797 | 247/8465 | 4.28e-04 | 5.34e-03 | 4.47e-03 | 40 |
| Hugo Symbol | Variant Class | Variant Classification | dbSNP RS | HGVSc | HGVSp | HGVSp Short | SWISSPROT | BIOTYPE | SIFT | PolyPhen | Tumor Sample Barcode | Tissue | Histology | Sex | Age | Stage | Therapy Types | Drugs | Outcome |
| UBE2D2 | SNV | Missense_Mutation | | c.93N>G | p.Phe31Leu | p.F31L | P62837 | protein_coding | tolerated_low_confidence(0.06) | benign(0.108) | TCGA-A2-A0YK-01 | Breast | breast invasive carcinoma | Female | <65 | I/II | Chemotherapy | cytoxan | SD |
| UBE2D2 | SNV | Missense_Mutation | novel | c.181C>T | p.Pro61Ser | p.P61S | P62837 | protein_coding | deleterious_low_confidence(0) | probably_damaging(0.971) | TCGA-AO-A03O-01 | Breast | breast invasive carcinoma | Female | >=65 | I/II | Chemotherapy | doxorubicin | SD |
| UBE2D2 | SNV | Missense_Mutation | | c.85G>A | p.Asp29Asn | p.D29N | P62837 | protein_coding | tolerated_low_confidence(0.1) | benign(0.1) | TCGA-E2-A1IN-01 | Breast | breast invasive carcinoma | Female | <65 | I/II | Hormone Therapy | arimidex | SD |
| UBE2D2 | SNV | Missense_Mutation | | c.244N>A | p.Gly82Ser | p.G82S | P62837 | protein_coding | deleterious_low_confidence(0) | probably_damaging(0.981) | TCGA-AU-6004-01 | Colorectum | colon adenocarcinoma | Female | >=65 | I/II | Unknown | Unknown | SD |
| UBE2D2 | SNV | Missense_Mutation | novel | c.349G>T | p.Asp117Tyr | p.D117Y | P62837 | protein_coding | deleterious_low_confidence(0.01) | probably_damaging(0.985) | TCGA-AP-A1E0-01 | Endometrium | uterine corpus endometrioid carcinoma | Female | <65 | III/IV | Chemotherapy | paclitaxel | SD |
| UBE2D2 | SNV | Missense_Mutation | novel | c.407G>T | p.Arg136Ile | p.R136I | P62837 | protein_coding | deleterious_low_confidence(0.03) | benign(0.374) | TCGA-AP-A1E0-01 | Endometrium | uterine corpus endometrioid carcinoma | Female | <65 | III/IV | Chemotherapy | paclitaxel | SD |
| UBE2D2 | SNV | Missense_Mutation | | c.215N>T | p.Arg72Ile | p.R72I | P62837 | protein_coding | deleterious_low_confidence(0) | possibly_damaging(0.591) | TCGA-AX-A05Z-01 | Endometrium | uterine corpus endometrioid carcinoma | Female | <65 | III/IV | Chemotherapy | adriamycin | SD |
| UBE2D2 | SNV | Missense_Mutation | | c.340N>G | p.Asn114Asp | p.N114D | P62837 | protein_coding | deleterious_low_confidence(0.04) | possibly_damaging(0.872) | TCGA-AX-A05Z-01 | Endometrium | uterine corpus endometrioid carcinoma | Female | <65 | III/IV | Chemotherapy | adriamycin | SD |
| UBE2D2 | SNV | Missense_Mutation | novel | c.202G>A | p.Ala68Thr | p.A68T | P62837 | protein_coding | tolerated_low_confidence(0.32) | benign(0.031) | TCGA-B5-A3FA-01 | Endometrium | uterine corpus endometrioid carcinoma | Female | >=65 | I/II | Unknown | Unknown | SD |
| UBE2D2 | SNV | Missense_Mutation | novel | c.160A>G | p.Ile54Val | p.I54V | P62837 | protein_coding | tolerated_low_confidence(0.08) | benign(0.027) | TCGA-D1-A175-01 | Endometrium | uterine corpus endometrioid carcinoma | Female | <65 | I/II | Chemotherapy | paclitaxel | SD |


