
|
|||||
|
 | |
| |
| |
| |
| |
| |
|
Gene: UBE2C |
Gene summary for UBE2C |
| Gene information | Species | Human | Gene symbol | UBE2C | Gene ID | 11065 |
| Gene name | ubiquitin conjugating enzyme E2 C | |
| Gene Alias | UBCH10 | |
| Cytomap | 20q13.12 | |
| Gene Type | protein-coding | GO ID | GO:0000070 | UniProtAcc | A0A087WVK1 |
Top |
Malignant transformation analysis |
| Identification of the aberrant gene expression in precancerous and cancerous lesions by comparing the gene expression of stem-like cells in diseased tissues with normal stem cells |
| Entrez ID | Symbol | Replicates | Species | Organ | Tissue | Adj P-value | Log2FC | Malignancy |
| 11065 | UBE2C | GSM4909281 | Human | Breast | IDC | 2.05e-06 | 2.96e-01 | 0.21 |
| 11065 | UBE2C | GSM4909282 | Human | Breast | IDC | 5.59e-57 | 1.10e+00 | -0.0288 |
| 11065 | UBE2C | GSM4909285 | Human | Breast | IDC | 1.79e-07 | 3.12e-01 | 0.21 |
| 11065 | UBE2C | GSM4909287 | Human | Breast | IDC | 1.25e-14 | 5.98e-01 | 0.2057 |
| 11065 | UBE2C | GSM4909290 | Human | Breast | IDC | 8.69e-04 | 2.98e-01 | 0.2096 |
| 11065 | UBE2C | GSM4909291 | Human | Breast | IDC | 9.90e-05 | 3.42e-01 | 0.1753 |
| 11065 | UBE2C | GSM4909296 | Human | Breast | IDC | 4.83e-04 | 2.32e-01 | 0.1524 |
| 11065 | UBE2C | GSM4909304 | Human | Breast | IDC | 1.49e-03 | 2.26e-01 | 0.1636 |
| 11065 | UBE2C | GSM4909308 | Human | Breast | IDC | 2.73e-04 | 2.84e-01 | 0.158 |
| 11065 | UBE2C | GSM4909309 | Human | Breast | IDC | 5.39e-29 | 8.30e-01 | 0.0483 |
| 11065 | UBE2C | GSM4909315 | Human | Breast | IDC | 2.58e-02 | 2.59e-01 | 0.21 |
| 11065 | UBE2C | GSM4909318 | Human | Breast | IDC | 3.67e-03 | 6.13e-01 | 0.2031 |
| 11065 | UBE2C | GSM4909319 | Human | Breast | IDC | 1.16e-04 | 2.36e-01 | 0.1563 |
| 11065 | UBE2C | M2 | Human | Breast | IDC | 1.16e-05 | 6.17e-01 | 0.21 |
| 11065 | UBE2C | NCCBC3 | Human | Breast | DCIS | 7.07e-04 | 1.95e-01 | 0.1198 |
| 11065 | UBE2C | LZE7T | Human | Esophagus | ESCC | 1.18e-02 | 2.76e-01 | 0.0667 |
| 11065 | UBE2C | LZE22T | Human | Esophagus | ESCC | 1.63e-05 | 6.44e-01 | 0.068 |
| 11065 | UBE2C | LZE24T | Human | Esophagus | ESCC | 4.20e-02 | 1.70e-01 | 0.0596 |
| 11065 | UBE2C | LZE21T | Human | Esophagus | ESCC | 1.24e-03 | 5.77e-01 | 0.0655 |
| 11065 | UBE2C | LZE6T | Human | Esophagus | ESCC | 1.55e-08 | 1.01e+00 | 0.0845 |
| Page: 1 2 3 4 5 |
| Tissue | Expression Dynamics | Abbreviation |
| Breast | 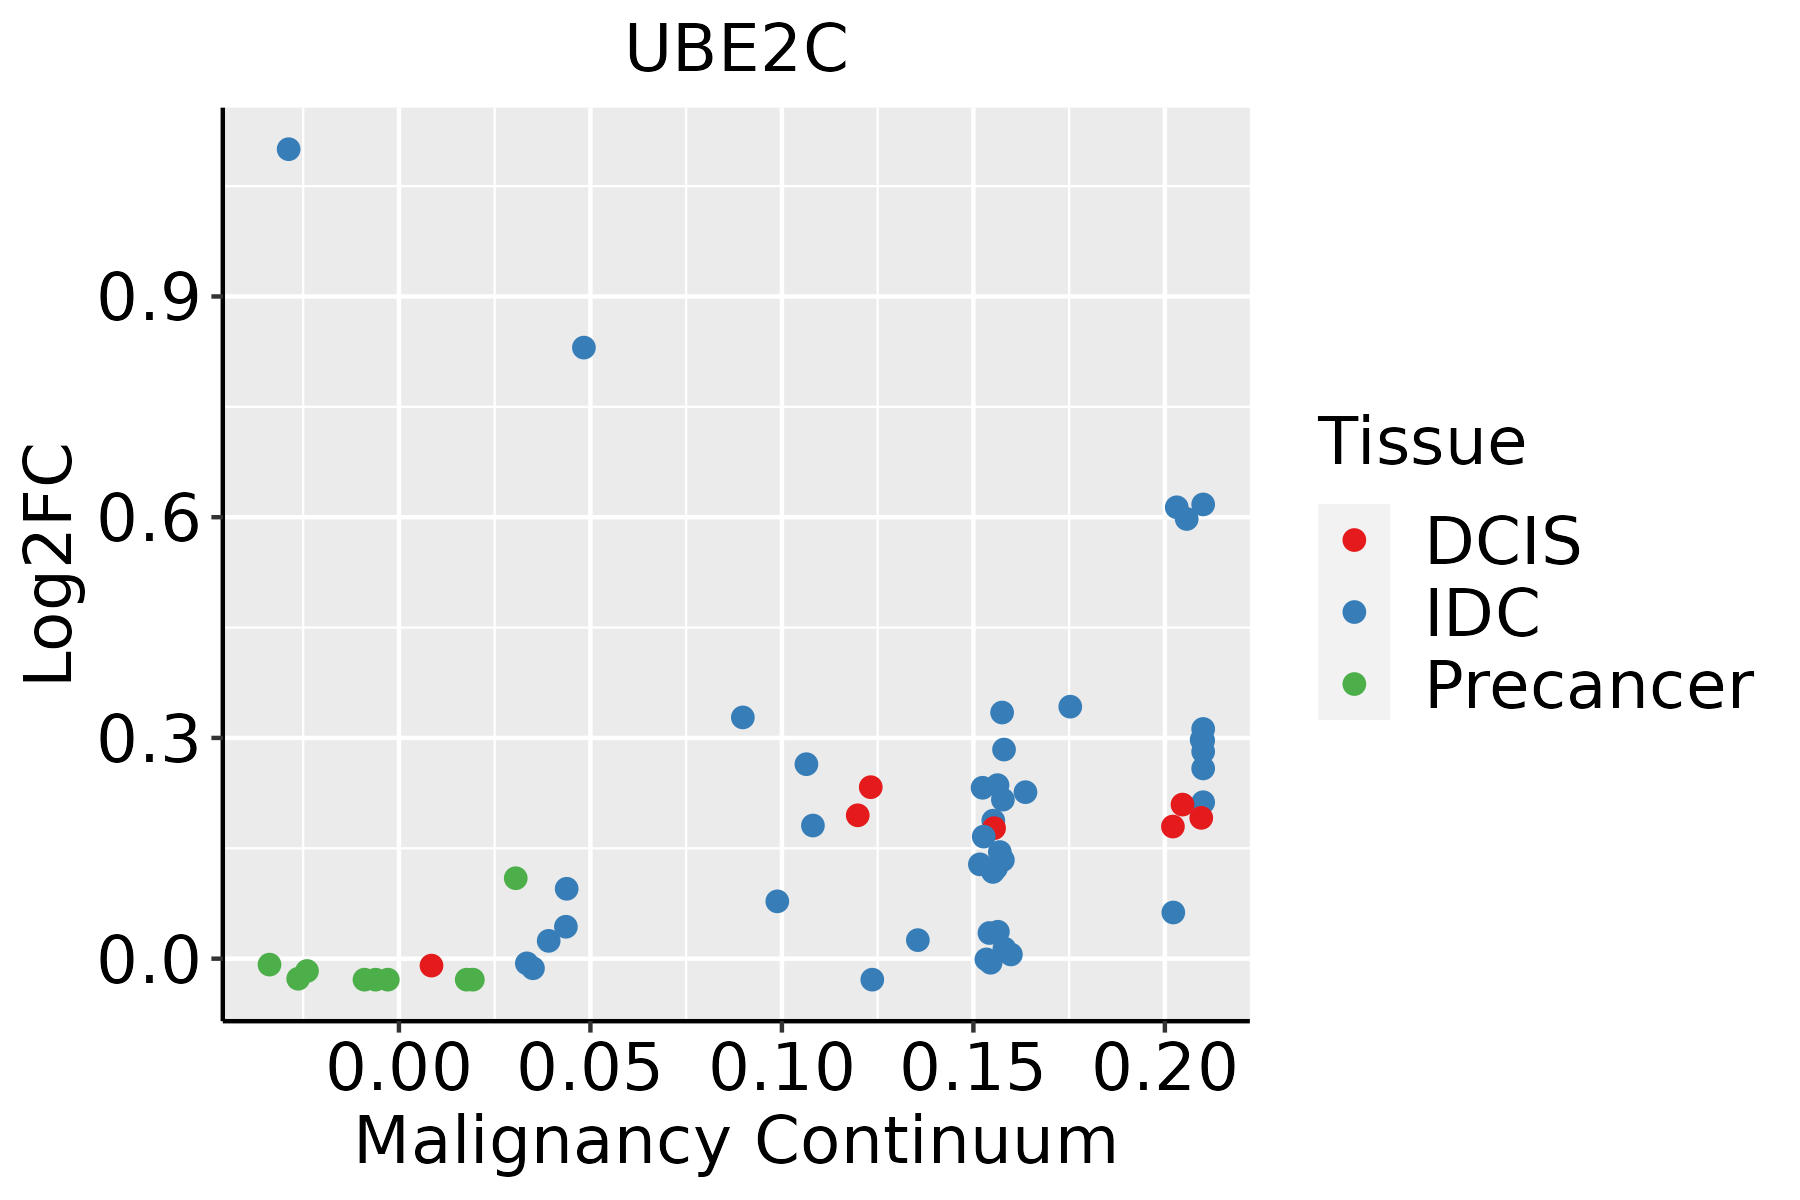 | IDC: Invasive ductal carcinoma |
| DCIS: Ductal carcinoma in situ | ||
| Precancer(BRCA1-mut): Precancerous lesion from BRCA1 mutation carriers | ||
| Esophagus |  | ESCC: Esophageal squamous cell carcinoma |
| HGIN: High-grade intraepithelial neoplasias | ||
| LGIN: Low-grade intraepithelial neoplasias | ||
| Liver |  | HCC: Hepatocellular carcinoma |
| NAFLD: Non-alcoholic fatty liver disease | ||
| Oral Cavity | 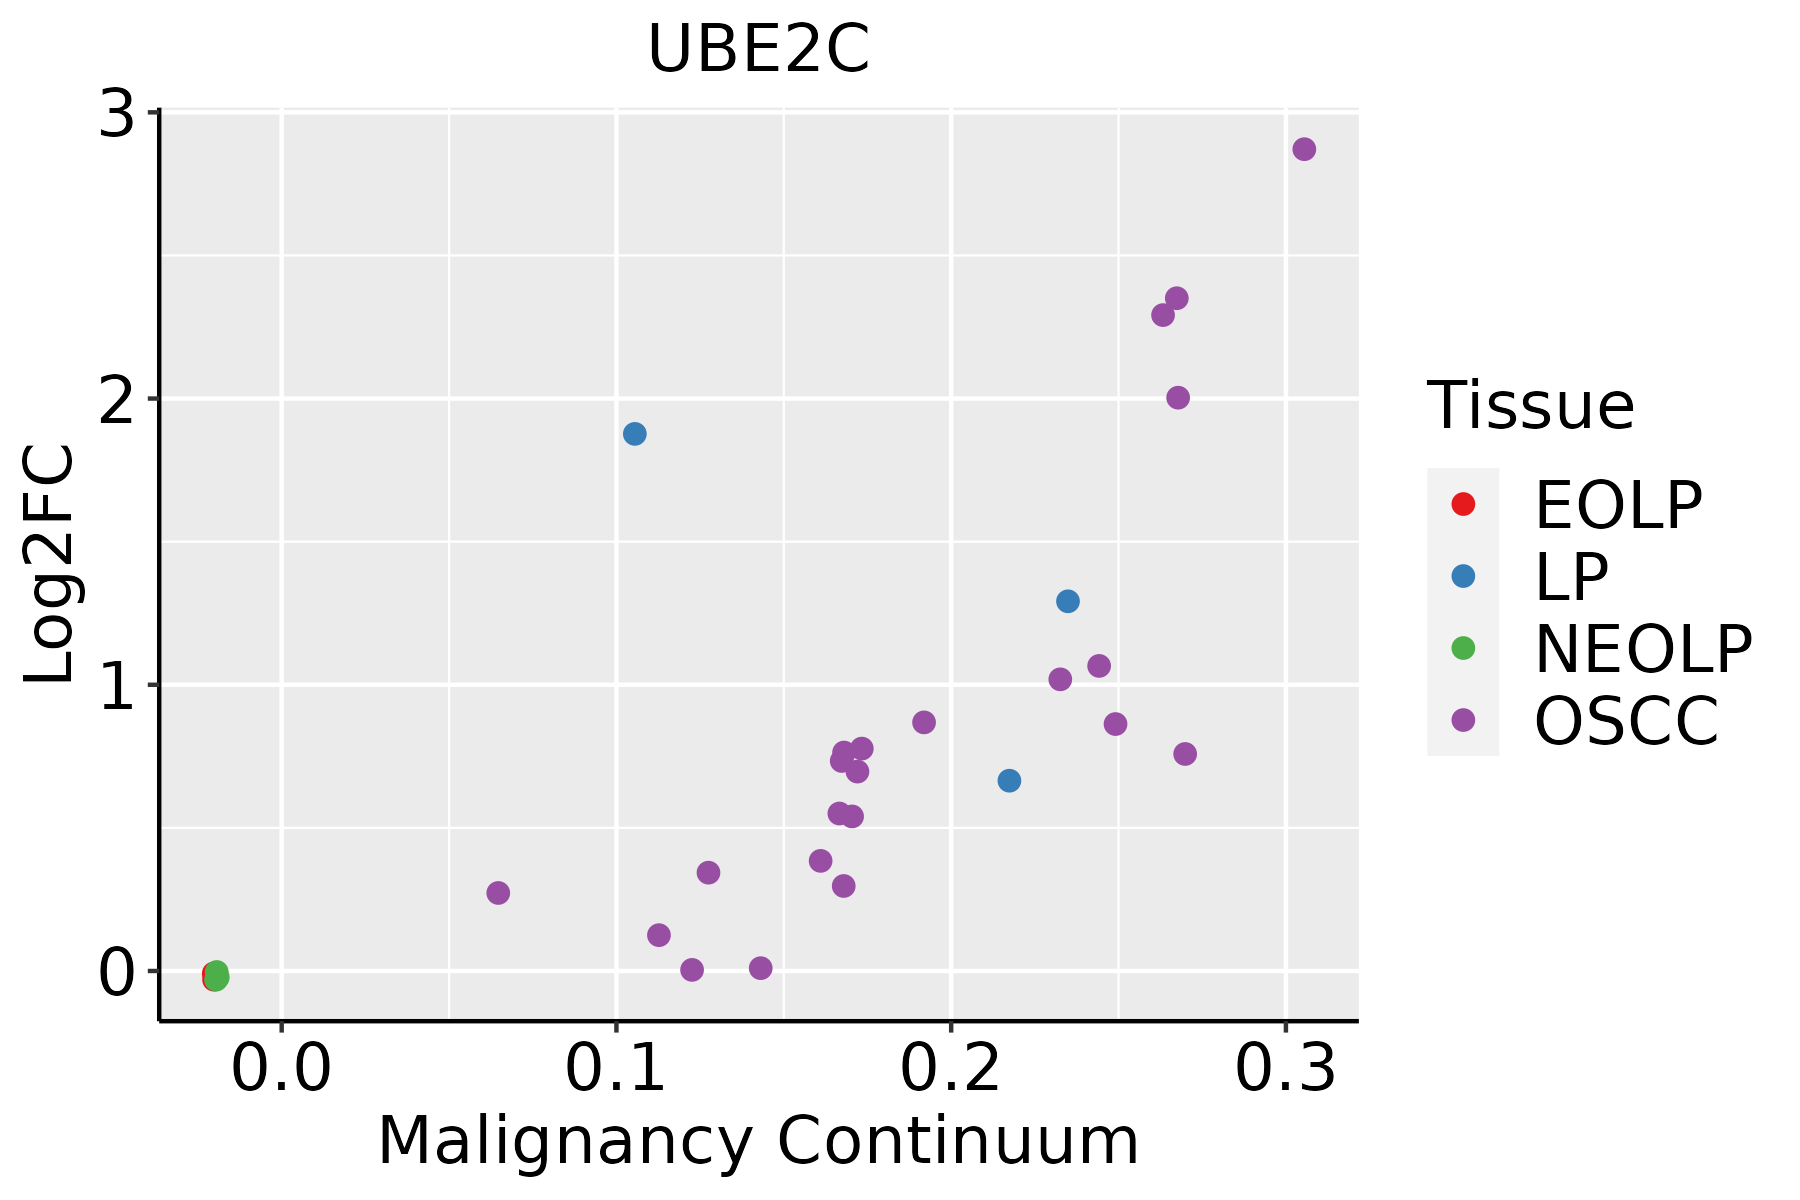 | EOLP: Erosive Oral lichen planus |
| LP: leukoplakia | ||
| NEOLP: Non-erosive oral lichen planus | ||
| OSCC: Oral squamous cell carcinoma | ||
| Skin | 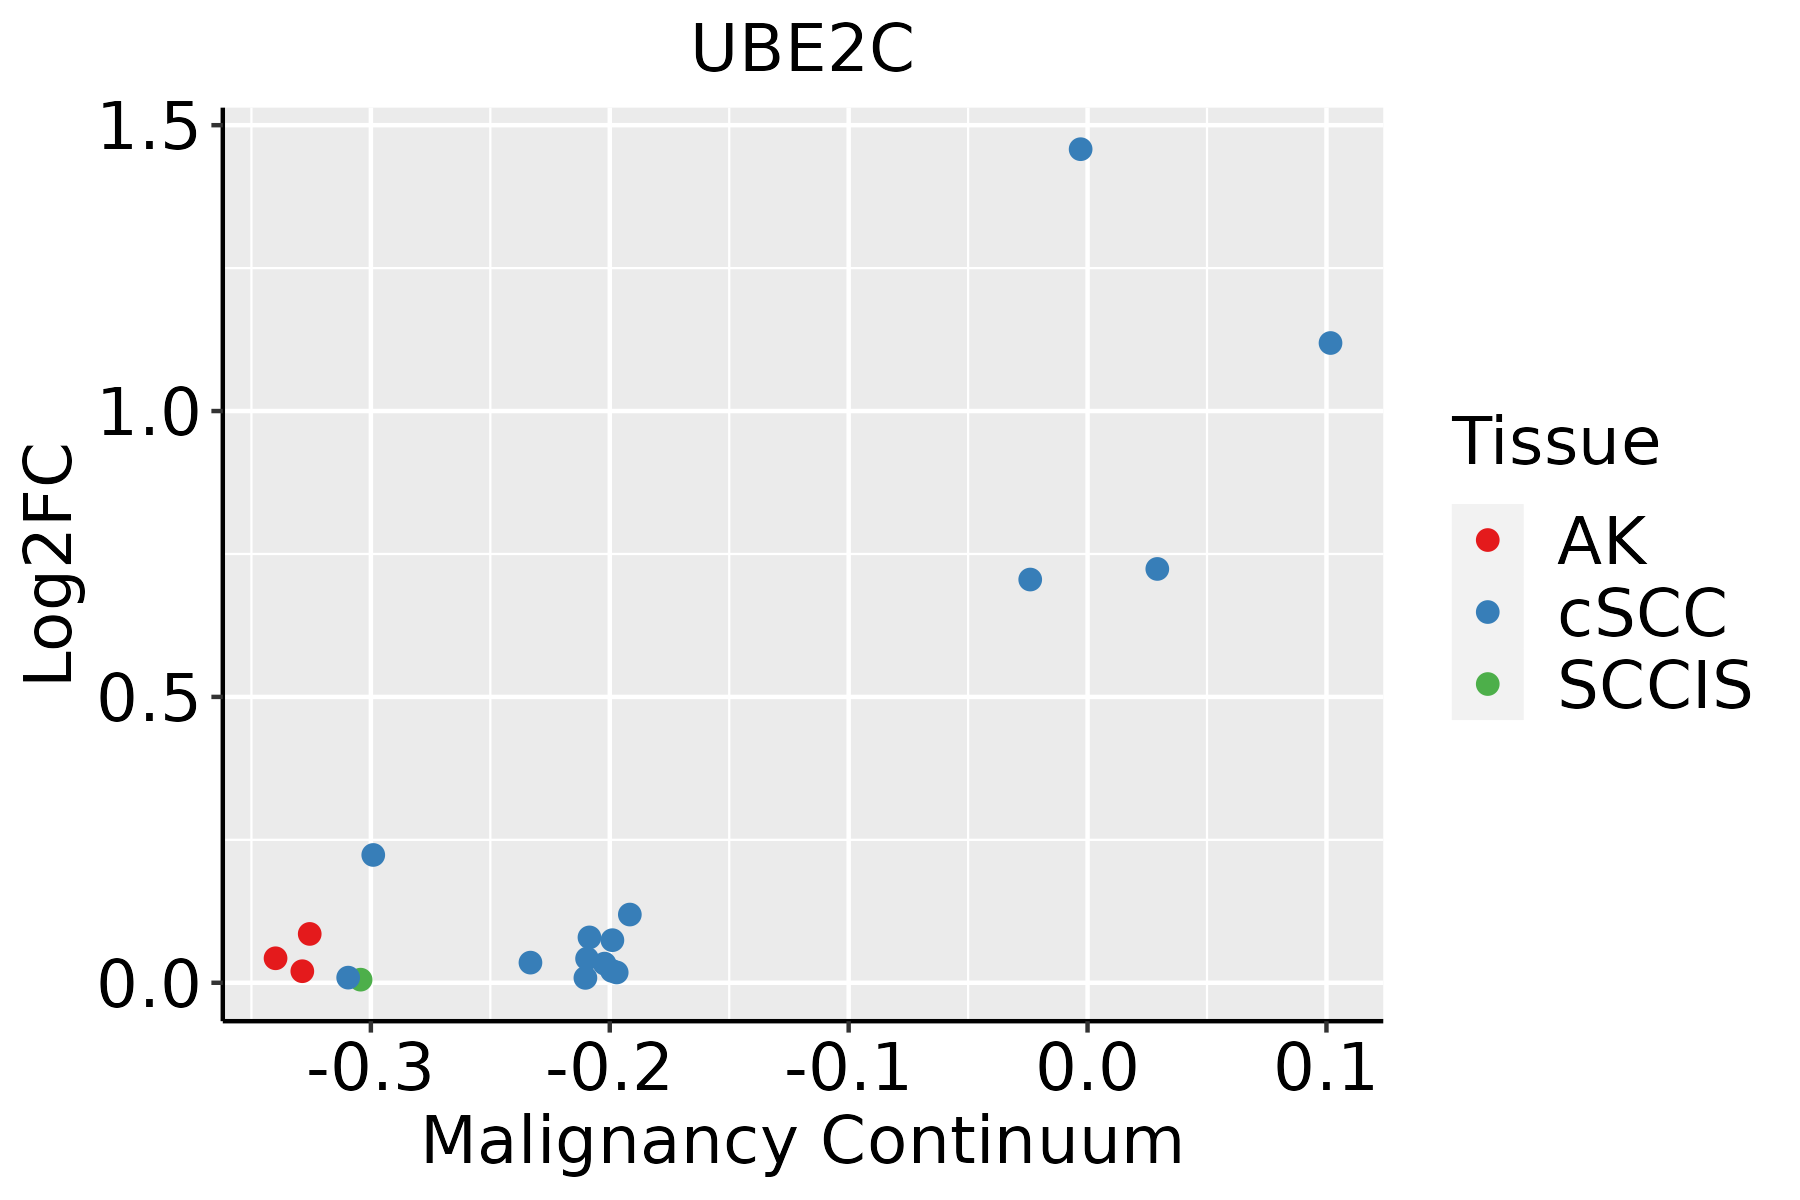 | AK: Actinic keratosis |
| cSCC: Cutaneous squamous cell carcinoma | ||
| SCCIS:squamous cell carcinoma in situ | ||
| Thyroid | 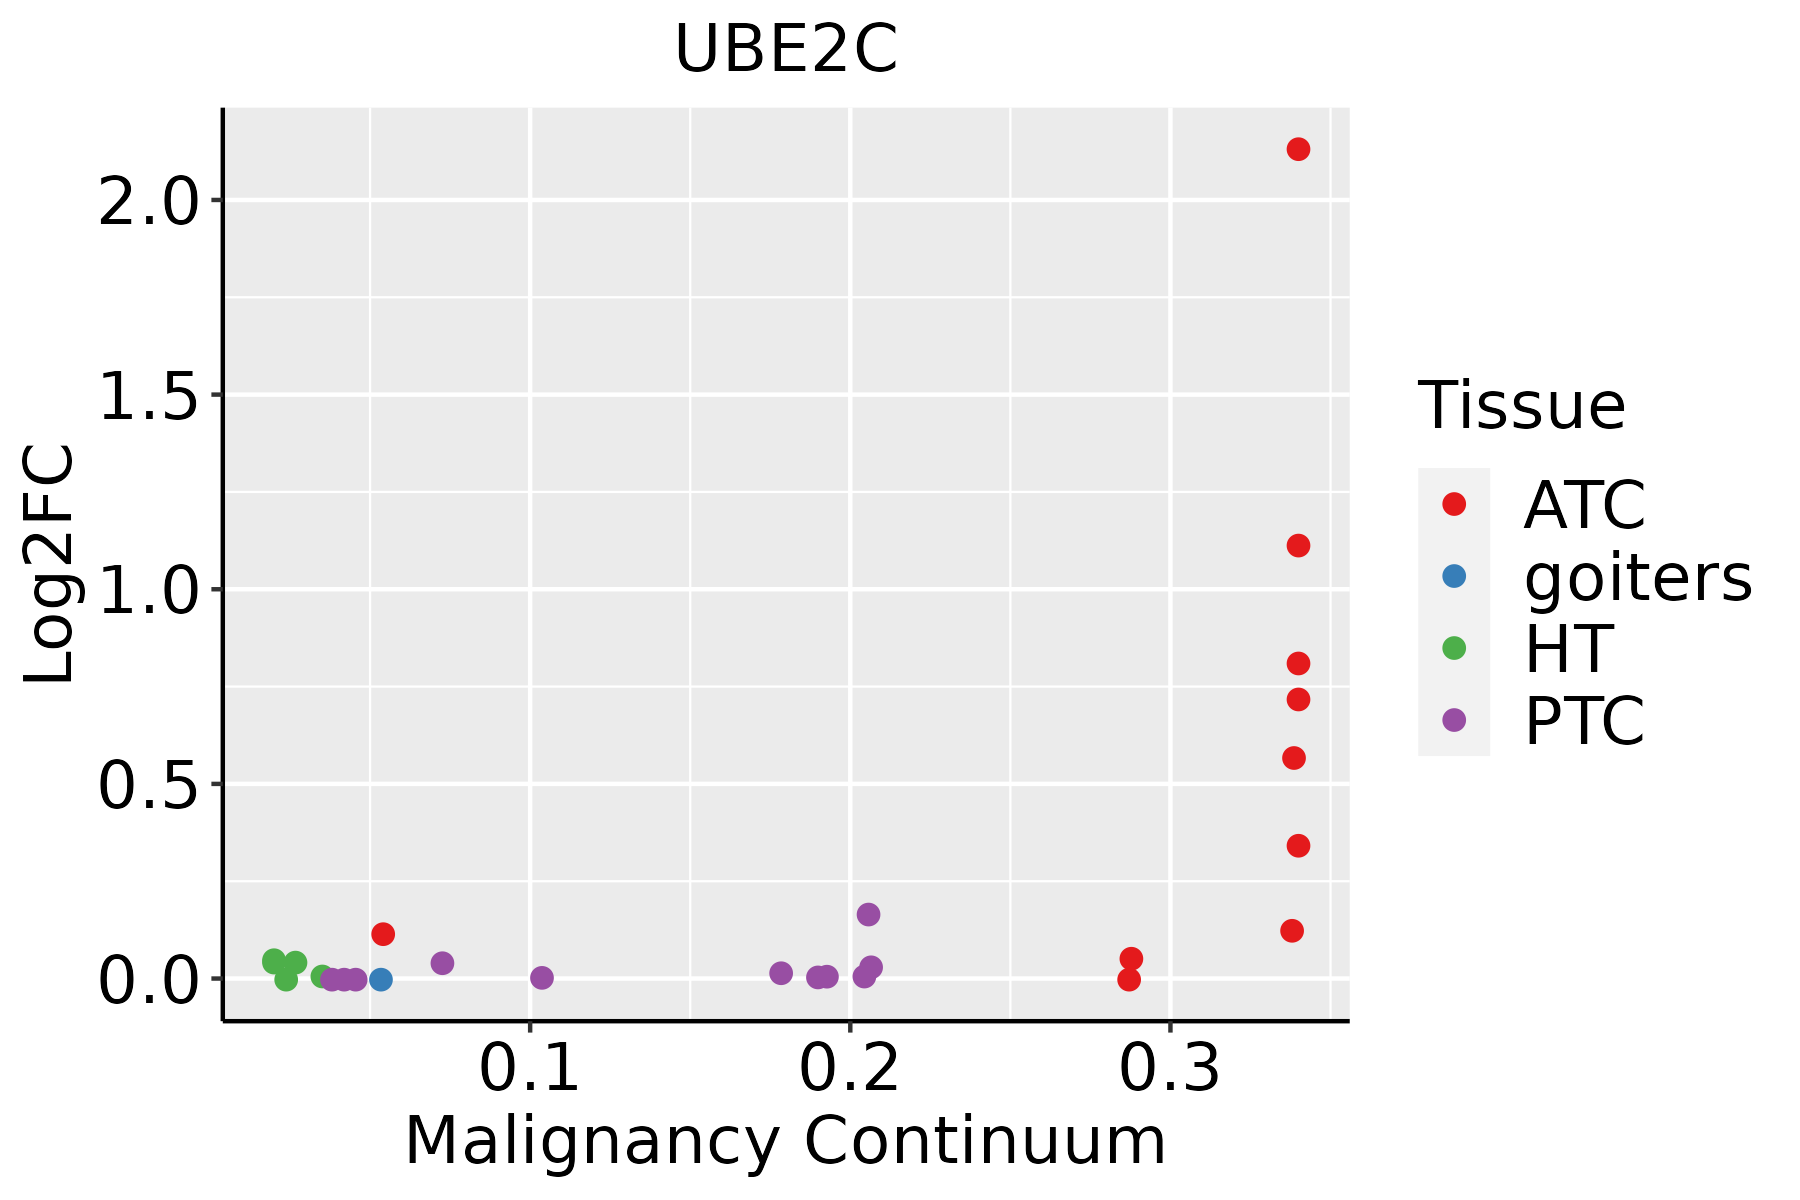 | ATC: Anaplastic thyroid cancer |
| HT: Hashimoto's thyroiditis | ||
| PTC: Papillary thyroid cancer |
| ∗log2FC in expression of this searched gene in stem-like cells from each diseased tissue sample relative to stem-like cells in normal samples in each tissue plotted against the malignancy continuum. Samples are colored based on if they are from different disease stage. |
Top |
Malignant transformation related pathway analysis |
| Find out the enriched GO biological processes and KEGG pathways involved in transition from healthy to precancer to cancer |
| Tissue | Disease Stage | Enriched GO biological Processes |
| Colorectum | AD |  |
| Colorectum | SER |  |
| Colorectum | MSS |  |
| Colorectum | MSI-H |  |
| Colorectum | FAP |  |
| ∗Top 15 enriched GO BP terms are showed in the bar plot of each disease state in each tissue. Each row represents a significant GO biological process which is colored according to the -log10(p.adjust). |
| Page: 1 2 3 4 5 6 7 8 9 |
| GO ID | Tissue | Disease Stage | Description | Gene Ratio | Bg Ratio | pvalue | p.adjust | Count |
| GO:001049814 | Breast | IDC | proteasomal protein catabolic process | 75/1434 | 490/18723 | 5.59e-09 | 4.41e-07 | 75 |
| GO:190332014 | Breast | IDC | regulation of protein modification by small protein conjugation or removal | 43/1434 | 242/18723 | 1.71e-07 | 9.16e-06 | 43 |
| GO:003139614 | Breast | IDC | regulation of protein ubiquitination | 37/1434 | 210/18723 | 1.50e-06 | 6.36e-05 | 37 |
| GO:004316114 | Breast | IDC | proteasome-mediated ubiquitin-dependent protein catabolic process | 57/1434 | 412/18723 | 9.55e-06 | 2.68e-04 | 57 |
| GO:190466614 | Breast | IDC | regulation of ubiquitin protein ligase activity | 8/1434 | 23/18723 | 2.01e-04 | 3.30e-03 | 8 |
| GO:005143814 | Breast | IDC | regulation of ubiquitin-protein transferase activity | 12/1434 | 53/18723 | 5.43e-04 | 6.97e-03 | 12 |
| GO:00512589 | Breast | IDC | protein polymerization | 38/1434 | 297/18723 | 1.26e-03 | 1.34e-02 | 38 |
| GO:00330445 | Breast | IDC | regulation of chromosome organization | 26/1434 | 187/18723 | 2.22e-03 | 2.06e-02 | 26 |
| GO:00073465 | Breast | IDC | regulation of mitotic cell cycle | 51/1434 | 457/18723 | 4.30e-03 | 3.35e-02 | 51 |
| GO:00459315 | Breast | IDC | positive regulation of mitotic cell cycle | 18/1434 | 121/18723 | 4.90e-03 | 3.73e-02 | 18 |
| GO:001049824 | Breast | DCIS | proteasomal protein catabolic process | 75/1390 | 490/18723 | 1.44e-09 | 1.40e-07 | 75 |
| GO:190332024 | Breast | DCIS | regulation of protein modification by small protein conjugation or removal | 43/1390 | 242/18723 | 7.16e-08 | 4.22e-06 | 43 |
| GO:003139624 | Breast | DCIS | regulation of protein ubiquitination | 37/1390 | 210/18723 | 7.12e-07 | 3.01e-05 | 37 |
| GO:004316124 | Breast | DCIS | proteasome-mediated ubiquitin-dependent protein catabolic process | 57/1390 | 412/18723 | 3.76e-06 | 1.16e-04 | 57 |
| GO:190466624 | Breast | DCIS | regulation of ubiquitin protein ligase activity | 8/1390 | 23/18723 | 1.61e-04 | 2.71e-03 | 8 |
| GO:005125814 | Breast | DCIS | protein polymerization | 39/1390 | 297/18723 | 3.64e-04 | 5.15e-03 | 39 |
| GO:005143823 | Breast | DCIS | regulation of ubiquitin-protein transferase activity | 12/1390 | 53/18723 | 4.10e-04 | 5.55e-03 | 12 |
| GO:000734612 | Breast | DCIS | regulation of mitotic cell cycle | 52/1390 | 457/18723 | 1.38e-03 | 1.43e-02 | 52 |
| GO:003304412 | Breast | DCIS | regulation of chromosome organization | 26/1390 | 187/18723 | 1.44e-03 | 1.47e-02 | 26 |
| GO:004593112 | Breast | DCIS | positive regulation of mitotic cell cycle | 19/1390 | 121/18723 | 1.47e-03 | 1.49e-02 | 19 |
| Page: 1 2 3 4 5 6 7 8 9 10 11 12 |
| Pathway ID | Tissue | Disease Stage | Description | Gene Ratio | Bg Ratio | pvalue | p.adjust | qvalue | Count |
| hsa0412027 | Esophagus | ESCC | Ubiquitin mediated proteolysis | 122/4205 | 142/8465 | 6.53e-20 | 7.29e-18 | 3.74e-18 | 122 |
| hsa0412036 | Esophagus | ESCC | Ubiquitin mediated proteolysis | 122/4205 | 142/8465 | 6.53e-20 | 7.29e-18 | 3.74e-18 | 122 |
| hsa0412041 | Liver | HCC | Ubiquitin mediated proteolysis | 110/4020 | 142/8465 | 1.67e-13 | 3.74e-12 | 2.08e-12 | 110 |
| hsa0412051 | Liver | HCC | Ubiquitin mediated proteolysis | 110/4020 | 142/8465 | 1.67e-13 | 3.74e-12 | 2.08e-12 | 110 |
| hsa0412020 | Oral cavity | OSCC | Ubiquitin mediated proteolysis | 105/3704 | 142/8465 | 1.83e-13 | 4.37e-12 | 2.23e-12 | 105 |
| hsa04120110 | Oral cavity | OSCC | Ubiquitin mediated proteolysis | 105/3704 | 142/8465 | 1.83e-13 | 4.37e-12 | 2.23e-12 | 105 |
| Page: 1 |
Top |
Cell-cell communication analysis |
| Identification of potential cell-cell interactions between two cell types and their ligand-receptor pairs for different disease states |
| Ligand | Receptor | LRpair | Pathway | Tissue | Disease Stage |
| Page: 1 |
Top |
Single-cell gene regulatory network inference analysis |
| Find out the significant the regulons (TFs) and the target genes of each regulon across cell types for different disease states |
| TF | Cell Type | Tissue | Disease Stage | Target Gene | RSS | Regulon Activity |
| ∗The dot plots of a searched regulon are shown for all cell subpopulations in each disease state of each tissue based on the regulon specific score inferred using pySCENIC and by calculating the average expression. |
| Page: 1 |
Top |
Somatic mutation of malignant transformation related genes |
| Annotation of somatic variants for genes involved in malignant transformation |
| Hugo Symbol | Variant Class | Variant Classification | dbSNP RS | HGVSc | HGVSp | HGVSp Short | SWISSPROT | BIOTYPE | SIFT | PolyPhen | Tumor Sample Barcode | Tissue | Histology | Sex | Age | Stage | Therapy Types | Drugs | Outcome |
| UBE2C | insertion | Frame_Shift_Ins | novel | c.493_494insCCTCACGCCCTGCTATC | p.Tyr165SerfsTer38 | p.Y165Sfs*38 | O00762 | protein_coding | TCGA-A2-A0D1-01 | Breast | breast invasive carcinoma | Female | >=65 | I/II | Chemotherapy | taxotere | SD | ||
| UBE2C | insertion | Nonsense_Mutation | novel | c.340_341insTCATATAGTGAAATGTTCTACA | p.Cys114PhefsTer3 | p.C114Ffs*3 | O00762 | protein_coding | TCGA-AN-A0FY-01 | Breast | breast invasive carcinoma | Female | <65 | I/II | Unknown | Unknown | SD | ||
| UBE2C | SNV | Missense_Mutation | rs757572822 | c.374N>C | p.Leu125Pro | p.L125P | O00762 | protein_coding | deleterious(0.04) | probably_damaging(0.948) | TCGA-AA-3977-01 | Colorectum | colon adenocarcinoma | Male | >=65 | I/II | Unknown | Unknown | SD |
| UBE2C | SNV | Missense_Mutation | c.500A>G | p.Gln167Arg | p.Q167R | O00762 | protein_coding | tolerated(0.54) | benign(0.003) | TCGA-DM-A1HB-01 | Colorectum | colon adenocarcinoma | Male | >=65 | III/IV | Unknown | Unknown | SD | |
| UBE2C | SNV | Missense_Mutation | novel | c.122N>T | p.Thr41Ile | p.T41I | O00762 | protein_coding | deleterious(0.05) | benign(0.082) | TCGA-A5-A1OF-01 | Endometrium | uterine corpus endometrioid carcinoma | Female | <65 | I/II | Unknown | Unknown | SD |
| UBE2C | SNV | Missense_Mutation | novel | c.371N>T | p.Ala124Val | p.A124V | O00762 | protein_coding | tolerated(0.07) | benign(0.223) | TCGA-AP-A1DK-01 | Endometrium | uterine corpus endometrioid carcinoma | Female | <65 | I/II | Unknown | Unknown | SD |
| UBE2C | SNV | Missense_Mutation | rs763209065 | c.245C>T | p.Ser82Leu | p.S82L | O00762 | protein_coding | tolerated(0.09) | benign(0.403) | TCGA-AP-A1DV-01 | Endometrium | uterine corpus endometrioid carcinoma | Female | <65 | I/II | Unknown | Unknown | SD |
| UBE2C | SNV | Missense_Mutation | novel | c.278C>T | p.Ala93Val | p.A93V | O00762 | protein_coding | tolerated(0.07) | benign(0.161) | TCGA-B5-A3FA-01 | Endometrium | uterine corpus endometrioid carcinoma | Female | >=65 | I/II | Unknown | Unknown | SD |
| UBE2C | SNV | Missense_Mutation | novel | c.193N>G | p.Thr65Ala | p.T65A | O00762 | protein_coding | deleterious(0.02) | possibly_damaging(0.863) | TCGA-BG-A221-01 | Endometrium | uterine corpus endometrioid carcinoma | Female | >=65 | I/II | Unknown | Unknown | SD |
| UBE2C | SNV | Missense_Mutation | rs773029038 | c.299C>T | p.Thr100Met | p.T100M | O00762 | protein_coding | deleterious(0.01) | probably_damaging(0.994) | TCGA-D1-A15X-01 | Endometrium | uterine corpus endometrioid carcinoma | Female | <65 | I/II | Unknown | Unknown | SD |
| Page: 1 2 |
Top |
Related drugs of malignant transformation related genes |
| Identification of chemicals and drugs interact with genes involved in malignant transfromation |
| (DGIdb 4.0) |
| Entrez ID | Symbol | Category | Interaction Types | Drug Claim Name | Drug Name | PMIDs |
| Page: 1 |

Copyright 2023-Present -The University of Texas Health Science Center at Houston |