
|
|||||
|
 | |
| |
| |
| |
| |
| |
|
Gene: UBE2A |
Gene summary for UBE2A |
| Gene information | Species | Human | Gene symbol | UBE2A | Gene ID | 7319 |
| Gene name | ubiquitin conjugating enzyme E2 A | |
| Gene Alias | HHR6A | |
| Cytomap | Xq24 | |
| Gene Type | protein-coding | GO ID | GO:0000003 | UniProtAcc | A0A0D9SG71 |
Top |
Malignant transformation analysis |
| Identification of the aberrant gene expression in precancerous and cancerous lesions by comparing the gene expression of stem-like cells in diseased tissues with normal stem cells |
| Entrez ID | Symbol | Replicates | Species | Organ | Tissue | Adj P-value | Log2FC | Malignancy |
| 7319 | UBE2A | CA_HPV_1 | Human | Cervix | CC | 1.31e-05 | 2.29e-03 | 0.0264 |
| 7319 | UBE2A | CCII_1 | Human | Cervix | CC | 7.51e-09 | -3.70e-01 | 0.3249 |
| 7319 | UBE2A | Tumor | Human | Cervix | CC | 2.90e-19 | 5.27e-01 | 0.1241 |
| 7319 | UBE2A | sample3 | Human | Cervix | CC | 3.13e-20 | 4.68e-01 | 0.1387 |
| 7319 | UBE2A | T3 | Human | Cervix | CC | 1.18e-22 | 5.15e-01 | 0.1389 |
| 7319 | UBE2A | LZE2D | Human | Esophagus | HGIN | 2.85e-04 | 2.57e-01 | 0.0642 |
| 7319 | UBE2A | LZE4T | Human | Esophagus | ESCC | 1.34e-18 | 8.15e-01 | 0.0811 |
| 7319 | UBE2A | LZE5T | Human | Esophagus | ESCC | 2.39e-03 | 5.57e-01 | 0.0514 |
| 7319 | UBE2A | LZE7T | Human | Esophagus | ESCC | 3.78e-11 | 1.34e+00 | 0.0667 |
| 7319 | UBE2A | LZE8T | Human | Esophagus | ESCC | 1.78e-05 | 4.58e-01 | 0.067 |
| 7319 | UBE2A | LZE20T | Human | Esophagus | ESCC | 9.77e-08 | 4.92e-01 | 0.0662 |
| 7319 | UBE2A | LZE22D1 | Human | Esophagus | HGIN | 2.30e-03 | 1.47e-01 | 0.0595 |
| 7319 | UBE2A | LZE22T | Human | Esophagus | ESCC | 1.86e-05 | 1.00e+00 | 0.068 |
| 7319 | UBE2A | LZE24T | Human | Esophagus | ESCC | 5.24e-37 | 1.50e+00 | 0.0596 |
| 7319 | UBE2A | LZE22D3 | Human | Esophagus | HGIN | 2.29e-02 | 1.61e-01 | 0.0653 |
| 7319 | UBE2A | LZE21T | Human | Esophagus | ESCC | 4.51e-04 | 4.47e-01 | 0.0655 |
| 7319 | UBE2A | LZE6T | Human | Esophagus | ESCC | 9.27e-19 | 1.32e+00 | 0.0845 |
| 7319 | UBE2A | P1T-E | Human | Esophagus | ESCC | 2.44e-06 | 7.53e-01 | 0.0875 |
| 7319 | UBE2A | P2T-E | Human | Esophagus | ESCC | 1.11e-47 | 1.11e+00 | 0.1177 |
| 7319 | UBE2A | P4T-E | Human | Esophagus | ESCC | 1.09e-53 | 1.46e+00 | 0.1323 |
| Page: 1 2 3 4 5 6 7 |
| Tissue | Expression Dynamics | Abbreviation |
| Cervix | 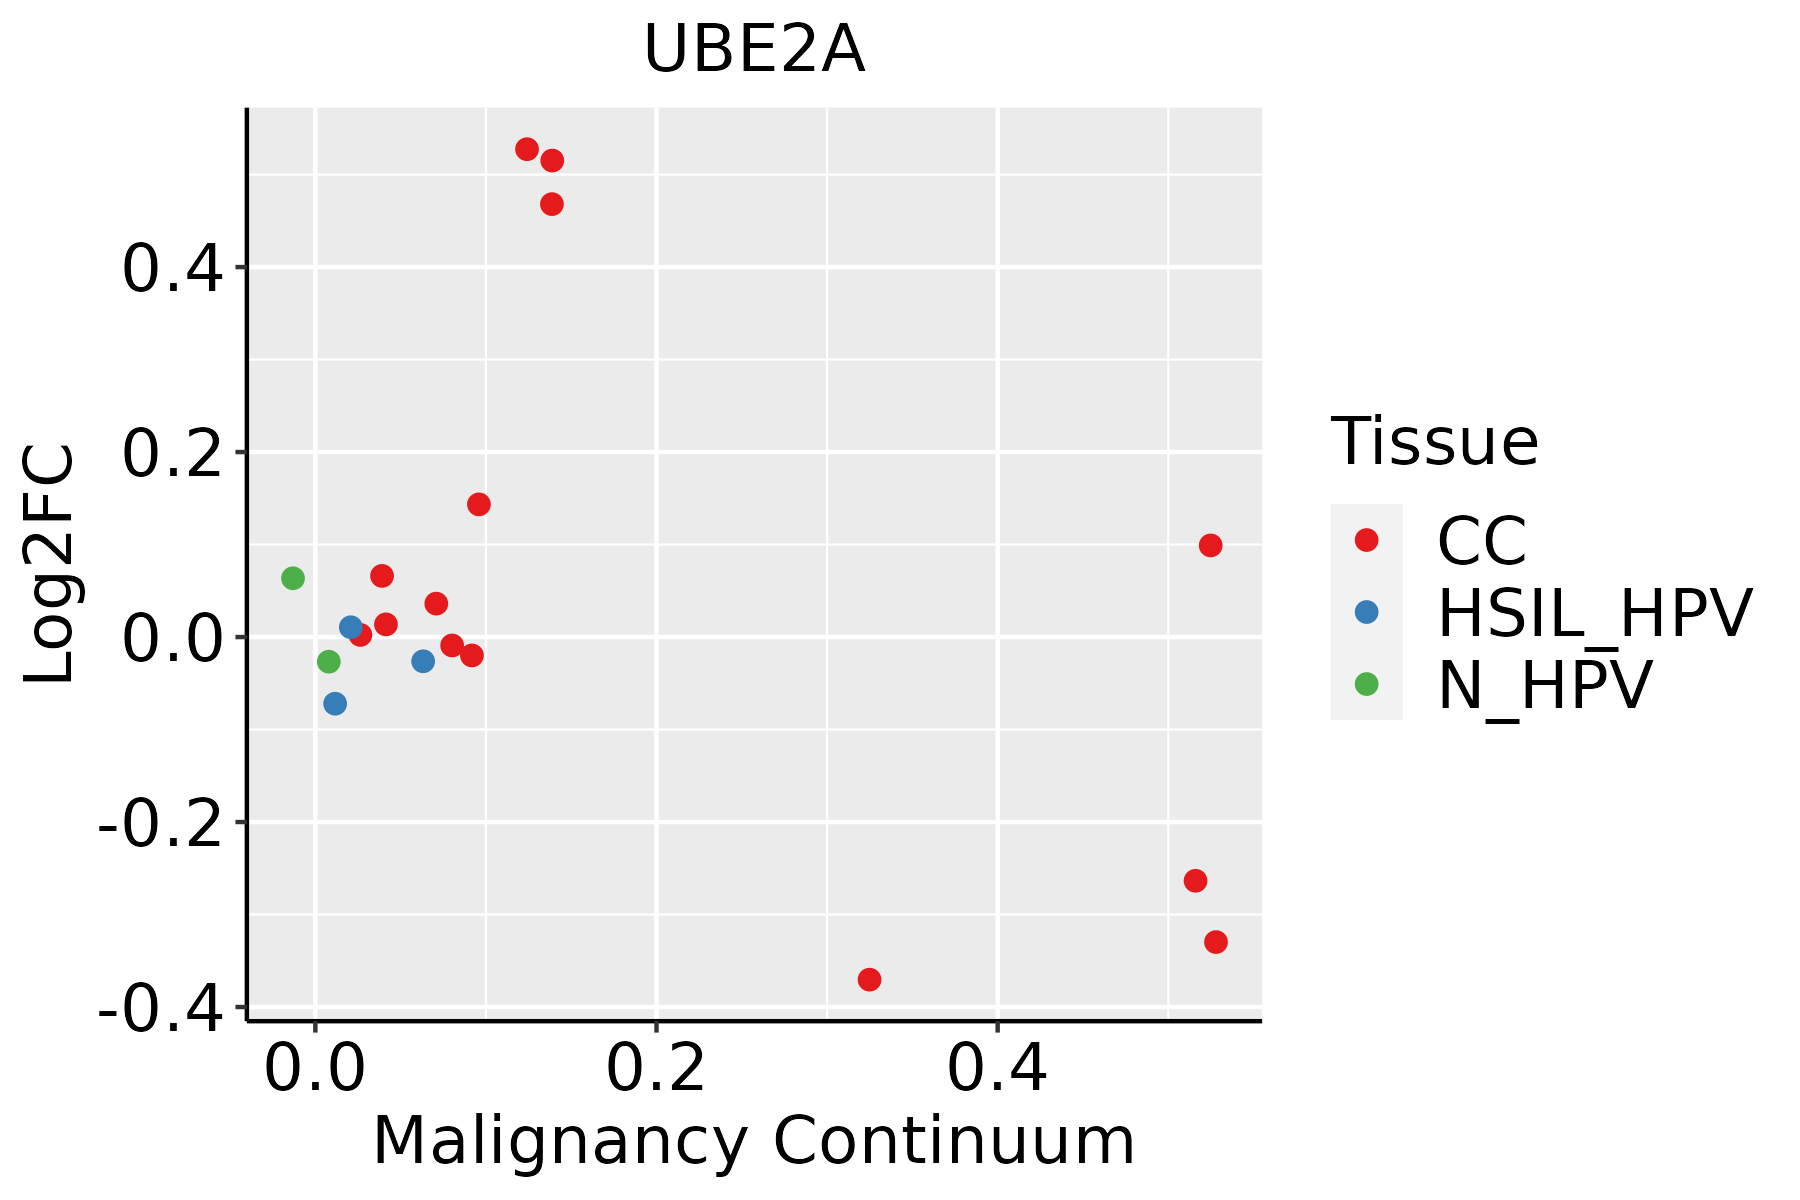 | CC: Cervix cancer |
| HSIL_HPV: HPV-infected high-grade squamous intraepithelial lesions | ||
| N_HPV: HPV-infected normal cervix | ||
| Esophagus | 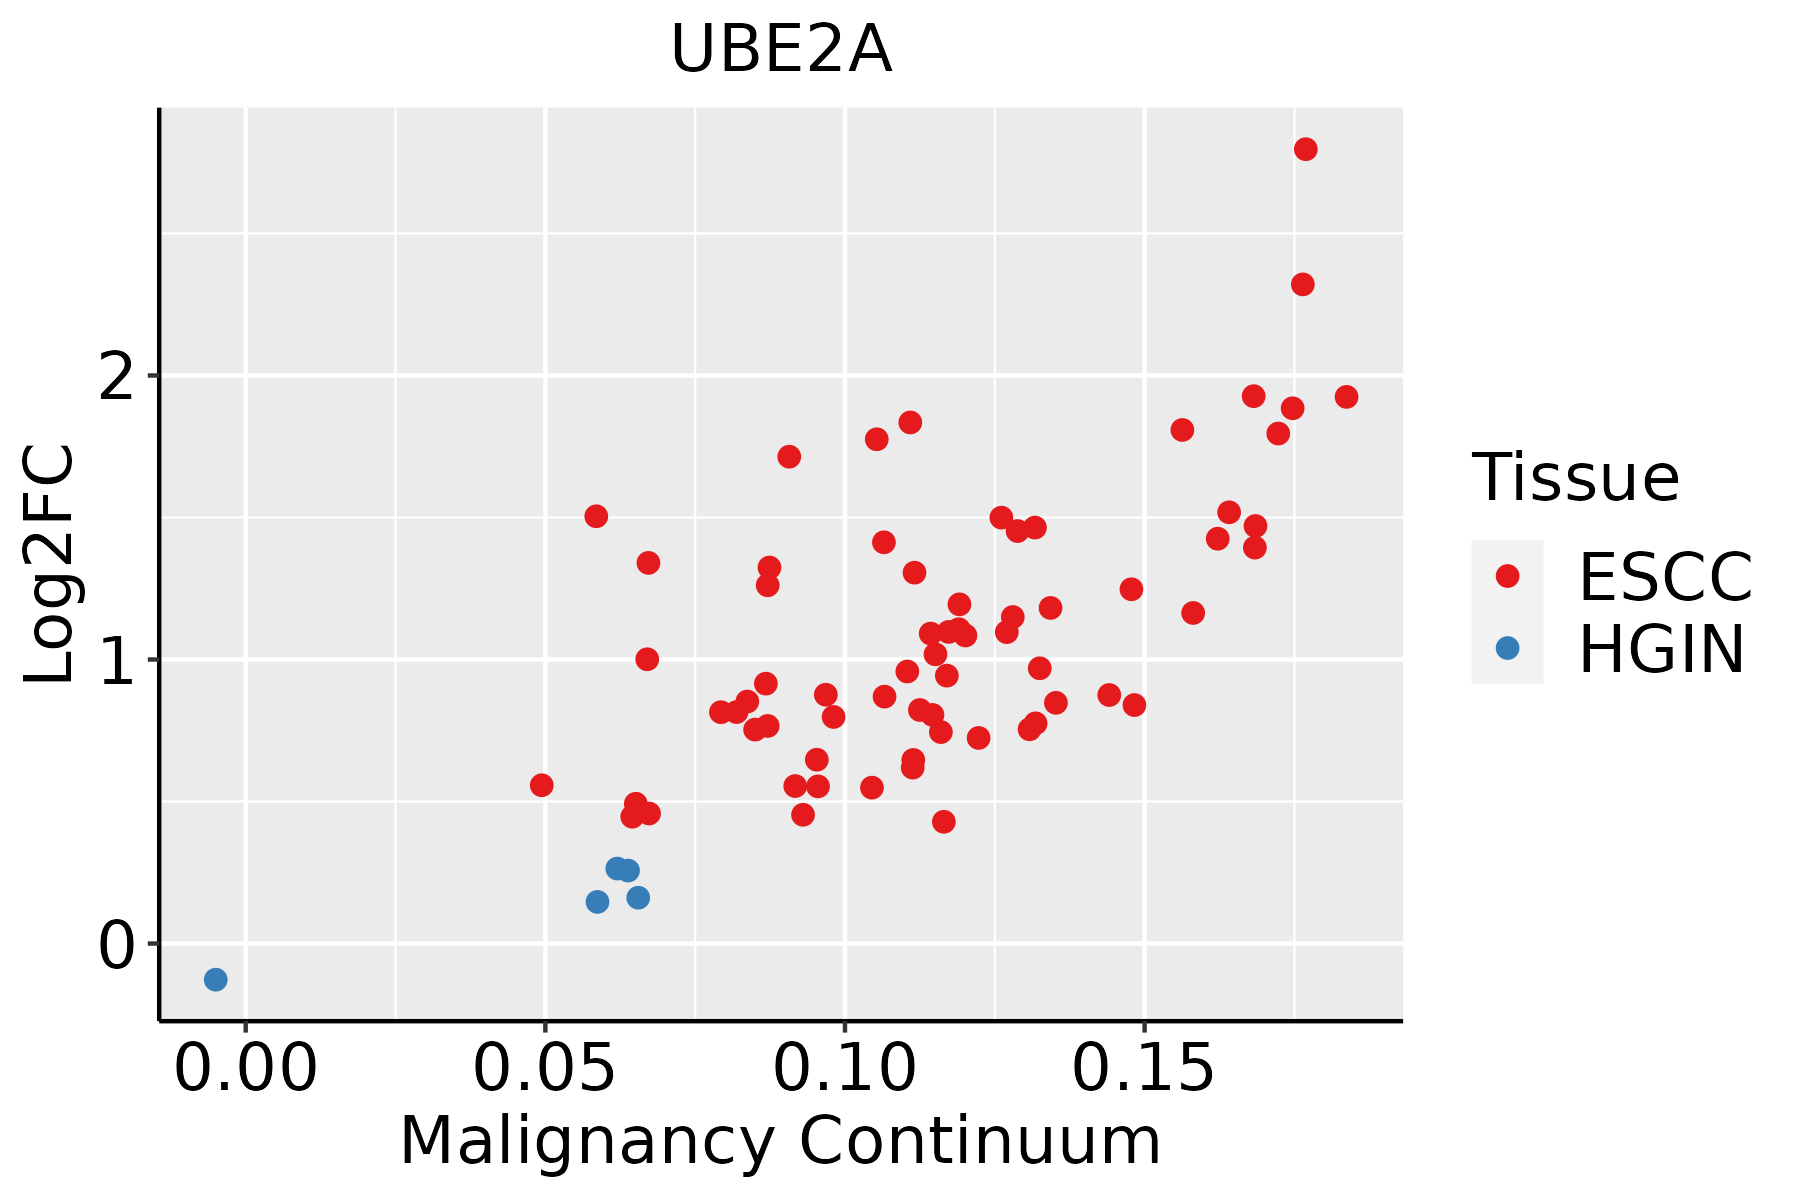 | ESCC: Esophageal squamous cell carcinoma |
| HGIN: High-grade intraepithelial neoplasias | ||
| LGIN: Low-grade intraepithelial neoplasias | ||
| Liver | 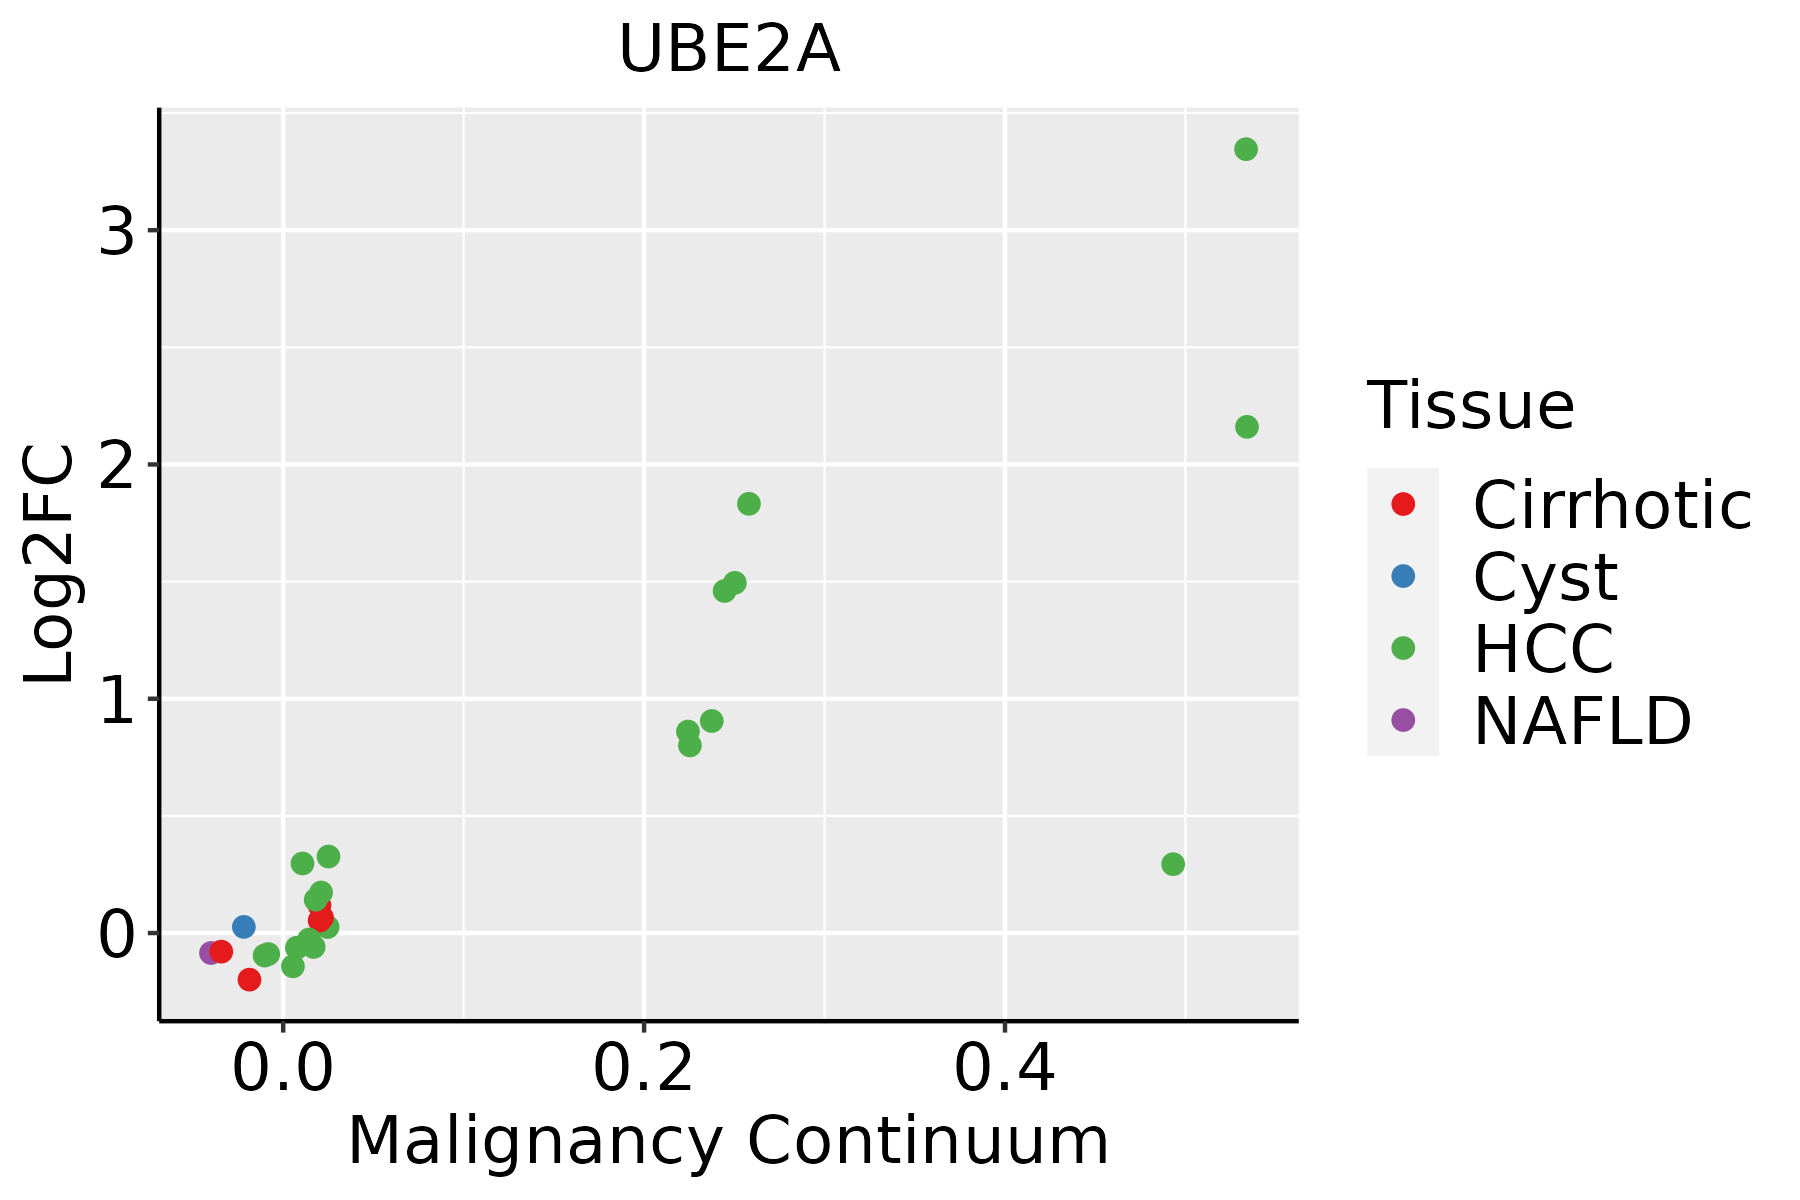 | HCC: Hepatocellular carcinoma |
| NAFLD: Non-alcoholic fatty liver disease | ||
| Oral Cavity | 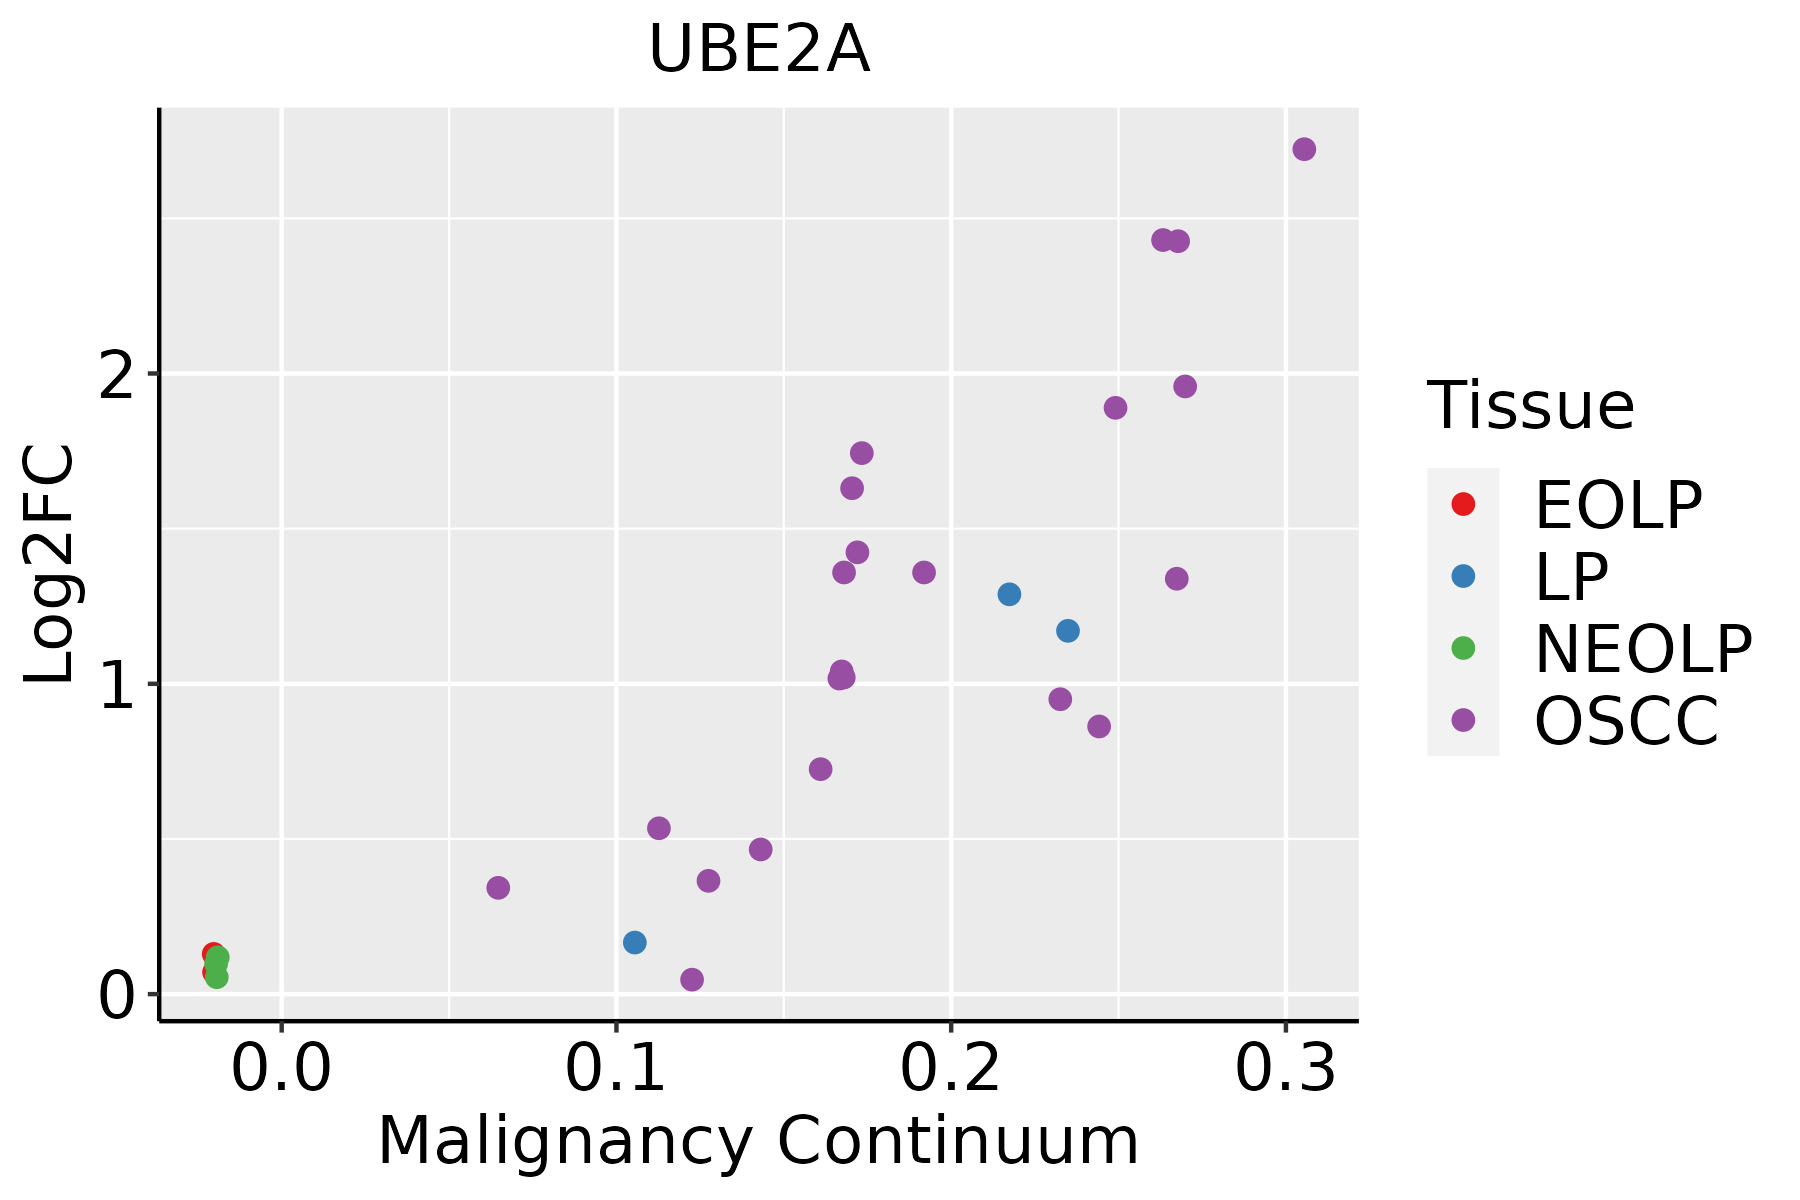 | EOLP: Erosive Oral lichen planus |
| LP: leukoplakia | ||
| NEOLP: Non-erosive oral lichen planus | ||
| OSCC: Oral squamous cell carcinoma | ||
| Skin |  | AK: Actinic keratosis |
| cSCC: Cutaneous squamous cell carcinoma | ||
| SCCIS:squamous cell carcinoma in situ | ||
| Thyroid | 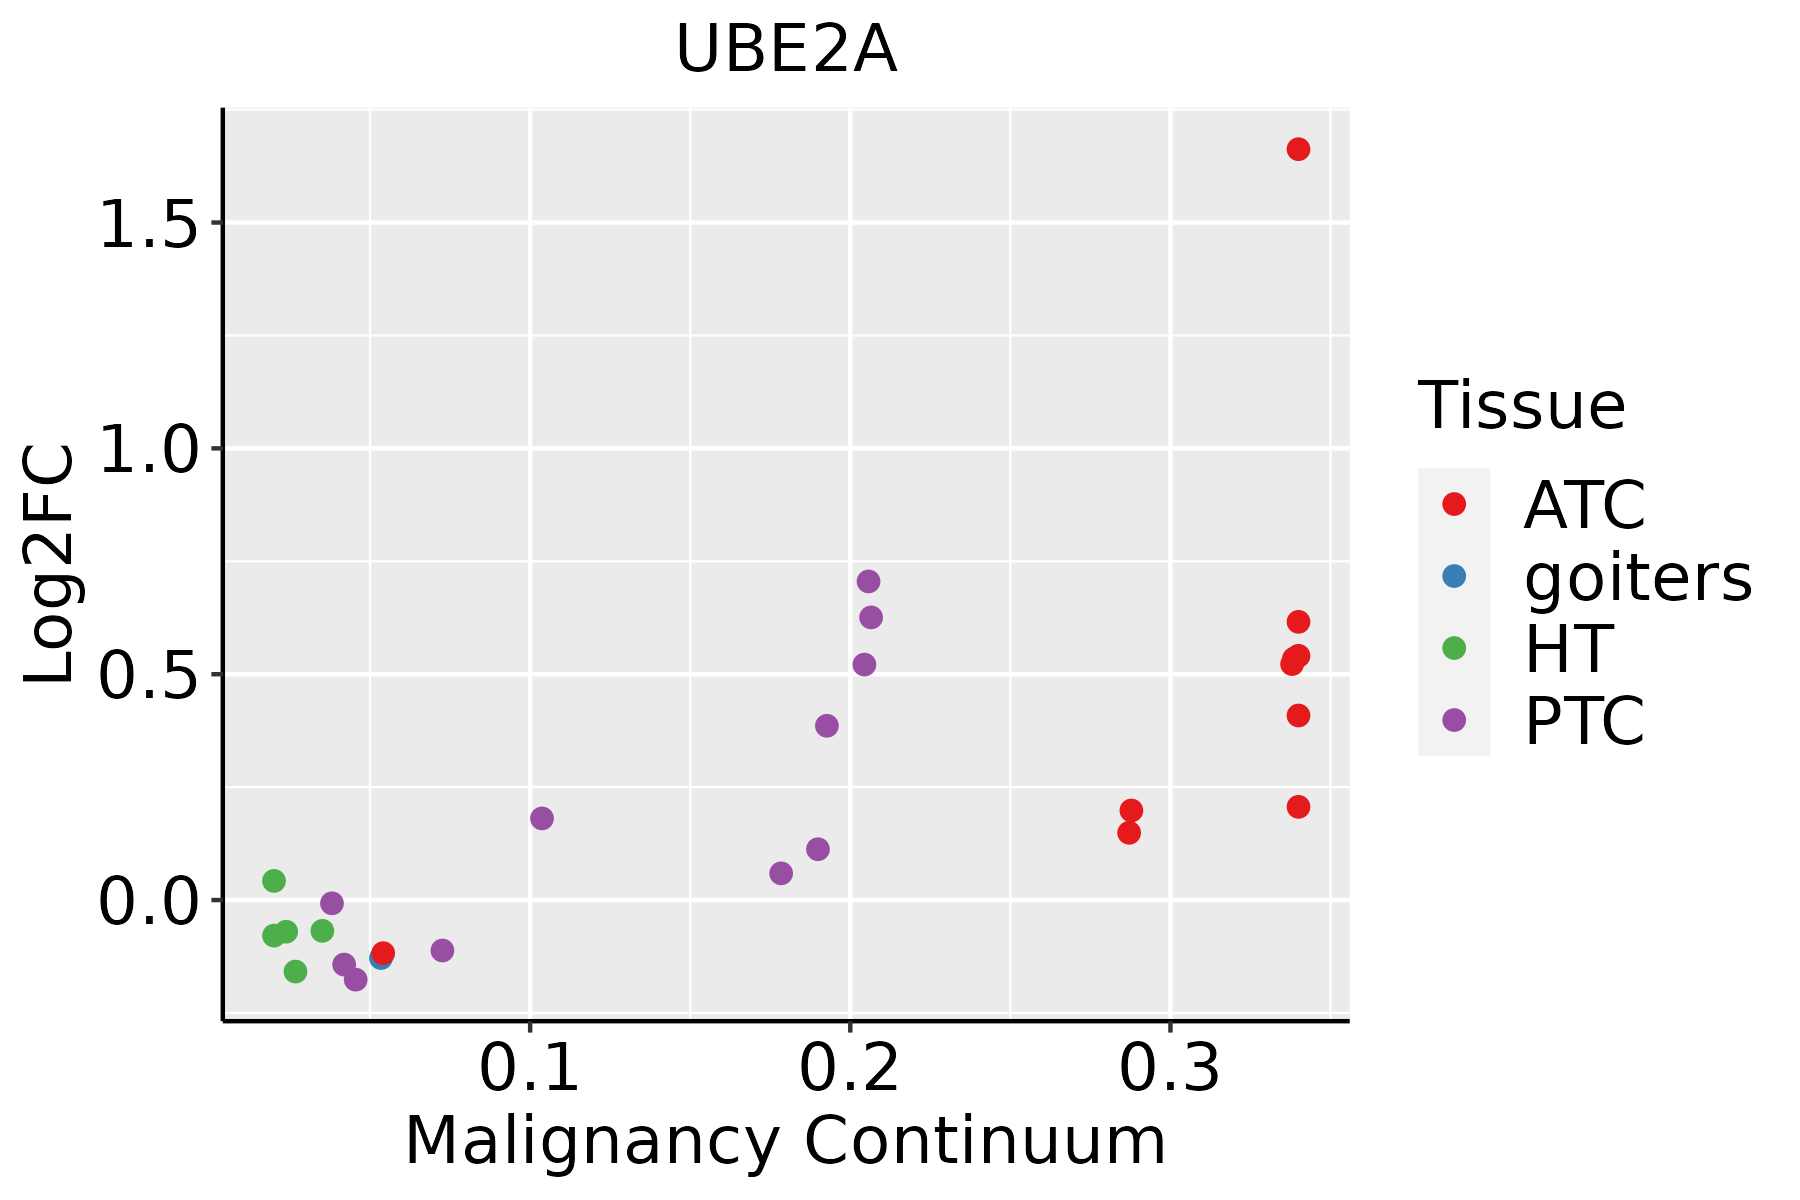 | ATC: Anaplastic thyroid cancer |
| HT: Hashimoto's thyroiditis | ||
| PTC: Papillary thyroid cancer |
| ∗log2FC in expression of this searched gene in stem-like cells from each diseased tissue sample relative to stem-like cells in normal samples in each tissue plotted against the malignancy continuum. Samples are colored based on if they are from different disease stage. |
Top |
Malignant transformation related pathway analysis |
| Find out the enriched GO biological processes and KEGG pathways involved in transition from healthy to precancer to cancer |
| Tissue | Disease Stage | Enriched GO biological Processes |
| Colorectum | AD |  |
| Colorectum | SER |  |
| Colorectum | MSS |  |
| Colorectum | MSI-H |  |
| Colorectum | FAP |  |
| ∗Top 15 enriched GO BP terms are showed in the bar plot of each disease state in each tissue. Each row represents a significant GO biological process which is colored according to the -log10(p.adjust). |
| Page: 1 2 3 4 5 6 7 8 9 |
| GO ID | Tissue | Disease Stage | Description | Gene Ratio | Bg Ratio | pvalue | p.adjust | Count |
| GO:001049810 | Cervix | CC | proteasomal protein catabolic process | 111/2311 | 490/18723 | 8.98e-11 | 1.58e-08 | 111 |
| GO:004316110 | Cervix | CC | proteasome-mediated ubiquitin-dependent protein catabolic process | 91/2311 | 412/18723 | 1.65e-08 | 1.25e-06 | 91 |
| GO:00002097 | Cervix | CC | protein polyubiquitination | 58/2311 | 236/18723 | 1.57e-07 | 7.41e-06 | 58 |
| GO:00709366 | Cervix | CC | protein K48-linked ubiquitination | 22/2311 | 65/18723 | 5.56e-06 | 1.38e-04 | 22 |
| GO:00093149 | Cervix | CC | response to radiation | 86/2311 | 456/18723 | 3.50e-05 | 5.63e-04 | 86 |
| GO:00017018 | Cervix | CC | in utero embryonic development | 71/2311 | 367/18723 | 7.21e-05 | 1.00e-03 | 71 |
| GO:00075654 | Cervix | CC | female pregnancy | 43/2311 | 193/18723 | 7.62e-05 | 1.04e-03 | 43 |
| GO:00165705 | Cervix | CC | histone modification | 84/2311 | 463/18723 | 1.70e-04 | 2.01e-03 | 84 |
| GO:00447064 | Cervix | CC | multi-multicellular organism process | 45/2311 | 220/18723 | 4.14e-04 | 4.21e-03 | 45 |
| GO:00094112 | Cervix | CC | response to UV | 33/2311 | 149/18723 | 5.51e-04 | 5.29e-03 | 33 |
| GO:00518656 | Cervix | CC | protein autoubiquitination | 17/2311 | 73/18723 | 6.71e-03 | 3.70e-02 | 17 |
| GO:00601353 | Cervix | CC | maternal process involved in female pregnancy | 15/2311 | 62/18723 | 7.30e-03 | 3.92e-02 | 15 |
| GO:00094163 | Cervix | CC | response to light stimulus | 54/2311 | 320/18723 | 1.03e-02 | 4.97e-02 | 54 |
| GO:001049826 | Esophagus | HGIN | proteasomal protein catabolic process | 139/2587 | 490/18723 | 1.20e-17 | 3.41e-15 | 139 |
| GO:004316126 | Esophagus | HGIN | proteasome-mediated ubiquitin-dependent protein catabolic process | 114/2587 | 412/18723 | 7.00e-14 | 1.20e-11 | 114 |
| GO:007093610 | Esophagus | HGIN | protein K48-linked ubiquitination | 24/2587 | 65/18723 | 2.69e-06 | 9.49e-05 | 24 |
| GO:000020916 | Esophagus | HGIN | protein polyubiquitination | 58/2587 | 236/18723 | 6.29e-06 | 1.97e-04 | 58 |
| GO:000170118 | Esophagus | HGIN | in utero embryonic development | 77/2587 | 367/18723 | 9.56e-05 | 2.05e-03 | 77 |
| GO:00165708 | Esophagus | HGIN | histone modification | 92/2587 | 463/18723 | 1.70e-04 | 3.30e-03 | 92 |
| GO:00165747 | Esophagus | HGIN | histone ubiquitination | 16/2587 | 47/18723 | 3.61e-04 | 5.68e-03 | 16 |
| Page: 1 2 3 4 5 6 7 8 |
| Pathway ID | Tissue | Disease Stage | Description | Gene Ratio | Bg Ratio | pvalue | p.adjust | qvalue | Count |
| hsa0412014 | Cervix | CC | Ubiquitin mediated proteolysis | 49/1267 | 142/8465 | 4.26e-09 | 7.68e-08 | 4.54e-08 | 49 |
| hsa0412015 | Cervix | CC | Ubiquitin mediated proteolysis | 49/1267 | 142/8465 | 4.26e-09 | 7.68e-08 | 4.54e-08 | 49 |
| hsa0412026 | Esophagus | HGIN | Ubiquitin mediated proteolysis | 49/1383 | 142/8465 | 7.78e-08 | 1.33e-06 | 1.06e-06 | 49 |
| hsa04120111 | Esophagus | HGIN | Ubiquitin mediated proteolysis | 49/1383 | 142/8465 | 7.78e-08 | 1.33e-06 | 1.06e-06 | 49 |
| hsa0412027 | Esophagus | ESCC | Ubiquitin mediated proteolysis | 122/4205 | 142/8465 | 6.53e-20 | 7.29e-18 | 3.74e-18 | 122 |
| hsa0412036 | Esophagus | ESCC | Ubiquitin mediated proteolysis | 122/4205 | 142/8465 | 6.53e-20 | 7.29e-18 | 3.74e-18 | 122 |
| hsa0412021 | Liver | Cirrhotic | Ubiquitin mediated proteolysis | 72/2530 | 142/8465 | 1.32e-07 | 1.97e-06 | 1.21e-06 | 72 |
| hsa0412031 | Liver | Cirrhotic | Ubiquitin mediated proteolysis | 72/2530 | 142/8465 | 1.32e-07 | 1.97e-06 | 1.21e-06 | 72 |
| hsa0412041 | Liver | HCC | Ubiquitin mediated proteolysis | 110/4020 | 142/8465 | 1.67e-13 | 3.74e-12 | 2.08e-12 | 110 |
| hsa0412051 | Liver | HCC | Ubiquitin mediated proteolysis | 110/4020 | 142/8465 | 1.67e-13 | 3.74e-12 | 2.08e-12 | 110 |
| hsa0412020 | Oral cavity | OSCC | Ubiquitin mediated proteolysis | 105/3704 | 142/8465 | 1.83e-13 | 4.37e-12 | 2.23e-12 | 105 |
| hsa04120110 | Oral cavity | OSCC | Ubiquitin mediated proteolysis | 105/3704 | 142/8465 | 1.83e-13 | 4.37e-12 | 2.23e-12 | 105 |
| hsa0412025 | Oral cavity | LP | Ubiquitin mediated proteolysis | 66/2418 | 142/8465 | 3.74e-06 | 3.46e-05 | 2.23e-05 | 66 |
| hsa0412035 | Oral cavity | LP | Ubiquitin mediated proteolysis | 66/2418 | 142/8465 | 3.74e-06 | 3.46e-05 | 2.23e-05 | 66 |
| Page: 1 |
Top |
Cell-cell communication analysis |
| Identification of potential cell-cell interactions between two cell types and their ligand-receptor pairs for different disease states |
| Ligand | Receptor | LRpair | Pathway | Tissue | Disease Stage |
| Page: 1 |
Top |
Single-cell gene regulatory network inference analysis |
| Find out the significant the regulons (TFs) and the target genes of each regulon across cell types for different disease states |
| TF | Cell Type | Tissue | Disease Stage | Target Gene | RSS | Regulon Activity |
| ∗The dot plots of a searched regulon are shown for all cell subpopulations in each disease state of each tissue based on the regulon specific score inferred using pySCENIC and by calculating the average expression. |
| Page: 1 |
Top |
Somatic mutation of malignant transformation related genes |
| Annotation of somatic variants for genes involved in malignant transformation |
| Hugo Symbol | Variant Class | Variant Classification | dbSNP RS | HGVSc | HGVSp | HGVSp Short | SWISSPROT | BIOTYPE | SIFT | PolyPhen | Tumor Sample Barcode | Tissue | Histology | Sex | Age | Stage | Therapy Types | Drugs | Outcome |
| UBE2A | SNV | Missense_Mutation | c.419N>T | p.Arg140Leu | p.R140L | P49459 | protein_coding | deleterious(0.04) | possibly_damaging(0.47) | TCGA-A2-A3XU-01 | Breast | breast invasive carcinoma | Female | <65 | I/II | Hormone Therapy | arimidex | PD | |
| UBE2A | SNV | Missense_Mutation | rs750065927 | c.418N>T | p.Arg140Cys | p.R140C | P49459 | protein_coding | deleterious(0.02) | probably_damaging(0.938) | TCGA-AA-3492-01 | Colorectum | colon adenocarcinoma | Female | >=65 | I/II | Unknown | Unknown | SD |
| UBE2A | SNV | Missense_Mutation | novel | c.177N>A | p.Phe59Leu | p.F59L | P49459 | protein_coding | deleterious(0.01) | probably_damaging(0.996) | TCGA-AA-3984-01 | Colorectum | colon adenocarcinoma | Female | <65 | I/II | Unknown | Unknown | SD |
| UBE2A | SNV | Missense_Mutation | rs760267258 | c.419N>A | p.Arg140His | p.R140H | P49459 | protein_coding | deleterious(0) | possibly_damaging(0.82) | TCGA-AA-A02R-01 | Colorectum | colon adenocarcinoma | Female | >=65 | I/II | Unknown | Unknown | PD |
| UBE2A | SNV | Missense_Mutation | novel | c.356N>C | p.Asn119Thr | p.N119T | P49459 | protein_coding | tolerated(0.06) | benign(0.097) | TCGA-CA-6718-01 | Colorectum | colon adenocarcinoma | Male | <65 | I/II | Unknown | Unknown | PD |
| UBE2A | SNV | Missense_Mutation | c.284G>A | p.Arg95His | p.R95H | P49459 | protein_coding | tolerated(0.06) | benign(0.007) | TCGA-DC-6682-01 | Colorectum | rectum adenocarcinoma | Male | <65 | I/II | Unknown | Unknown | SD | |
| UBE2A | SNV | Missense_Mutation | novel | c.112G>A | p.Ala38Thr | p.A38T | P49459 | protein_coding | deleterious(0.01) | benign(0.015) | TCGA-EF-5831-01 | Colorectum | rectum adenocarcinoma | Male | >=65 | I/II | Unknown | Unknown | SD |
| UBE2A | SNV | Missense_Mutation | c.17N>A | p.Arg6Gln | p.R6Q | P49459 | protein_coding | tolerated(0.24) | benign(0) | TCGA-EI-6510-01 | Colorectum | rectum adenocarcinoma | Female | >=65 | I/II | Unknown | Unknown | SD | |
| UBE2A | SNV | Missense_Mutation | novel | c.392A>G | p.Gln131Arg | p.Q131R | P49459 | protein_coding | tolerated(0.58) | benign(0.03) | TCGA-A5-A0G1-01 | Endometrium | uterine corpus endometrioid carcinoma | Female | >=65 | I/II | Unknown | Unknown | SD |
| UBE2A | SNV | Missense_Mutation | c.404N>A | p.Arg135Gln | p.R135Q | P49459 | protein_coding | tolerated(0.27) | possibly_damaging(0.821) | TCGA-AJ-A3EK-01 | Endometrium | uterine corpus endometrioid carcinoma | Female | <65 | I/II | Chemotherapy | carboplatin | CR |
| Page: 1 2 3 |
Top |
Related drugs of malignant transformation related genes |
| Identification of chemicals and drugs interact with genes involved in malignant transfromation |
| (DGIdb 4.0) |
| Entrez ID | Symbol | Category | Interaction Types | Drug Claim Name | Drug Name | PMIDs |
| Page: 1 |

Copyright 2023-Present -The University of Texas Health Science Center at Houston |