
|
|||||
|
 | |
| |
| |
| |
| |
| |
|
Gene: UBD |
Gene summary for UBD |
| Gene information | Species | Human | Gene symbol | UBD | Gene ID | 10537 |
| Gene name | ubiquitin D | |
| Gene Alias | FAT10 | |
| Cytomap | 6p22.1 | |
| Gene Type | protein-coding | GO ID | GO:0000278 | UniProtAcc | A0A1U9X8S6 |
Top |
Malignant transformation analysis |
| Identification of the aberrant gene expression in precancerous and cancerous lesions by comparing the gene expression of stem-like cells in diseased tissues with normal stem cells |
| Entrez ID | Symbol | Replicates | Species | Organ | Tissue | Adj P-value | Log2FC | Malignancy |
| 10537 | UBD | LZE5T | Human | Esophagus | ESCC | 1.57e-03 | 2.80e-01 | 0.0514 |
| 10537 | UBD | LZE8T | Human | Esophagus | ESCC | 2.92e-30 | 1.29e+00 | 0.067 |
| 10537 | UBD | LZE20T | Human | Esophagus | ESCC | 7.90e-04 | 1.15e+00 | 0.0662 |
| 10537 | UBD | LZE24T | Human | Esophagus | ESCC | 1.38e-30 | 1.70e+00 | 0.0596 |
| 10537 | UBD | P1T-E | Human | Esophagus | ESCC | 8.77e-17 | 1.46e+00 | 0.0875 |
| 10537 | UBD | P2T-E | Human | Esophagus | ESCC | 3.09e-102 | 3.01e+00 | 0.1177 |
| 10537 | UBD | P4T-E | Human | Esophagus | ESCC | 5.16e-10 | 4.04e-01 | 0.1323 |
| 10537 | UBD | P8T-E | Human | Esophagus | ESCC | 2.03e-57 | 2.38e+00 | 0.0889 |
| 10537 | UBD | P9T-E | Human | Esophagus | ESCC | 1.45e-04 | 6.60e-01 | 0.1131 |
| 10537 | UBD | P11T-E | Human | Esophagus | ESCC | 4.80e-15 | 2.26e+00 | 0.1426 |
| 10537 | UBD | P15T-E | Human | Esophagus | ESCC | 8.45e-04 | 4.76e-01 | 0.1149 |
| 10537 | UBD | P16T-E | Human | Esophagus | ESCC | 4.41e-07 | 3.22e-01 | 0.1153 |
| 10537 | UBD | P17T-E | Human | Esophagus | ESCC | 5.25e-15 | 2.11e+00 | 0.1278 |
| 10537 | UBD | P21T-E | Human | Esophagus | ESCC | 4.41e-07 | 1.01e+00 | 0.1617 |
| 10537 | UBD | P23T-E | Human | Esophagus | ESCC | 1.04e-34 | 2.05e+00 | 0.108 |
| 10537 | UBD | P24T-E | Human | Esophagus | ESCC | 1.00e-103 | 4.32e+00 | 0.1287 |
| 10537 | UBD | P26T-E | Human | Esophagus | ESCC | 3.97e-04 | 2.33e-01 | 0.1276 |
| 10537 | UBD | P27T-E | Human | Esophagus | ESCC | 4.24e-18 | 6.90e-01 | 0.1055 |
| 10537 | UBD | P36T-E | Human | Esophagus | ESCC | 2.15e-35 | 2.98e+00 | 0.1187 |
| 10537 | UBD | P37T-E | Human | Esophagus | ESCC | 8.87e-19 | 1.70e+00 | 0.1371 |
| Page: 1 2 3 4 |
| Tissue | Expression Dynamics | Abbreviation |
| Esophagus | 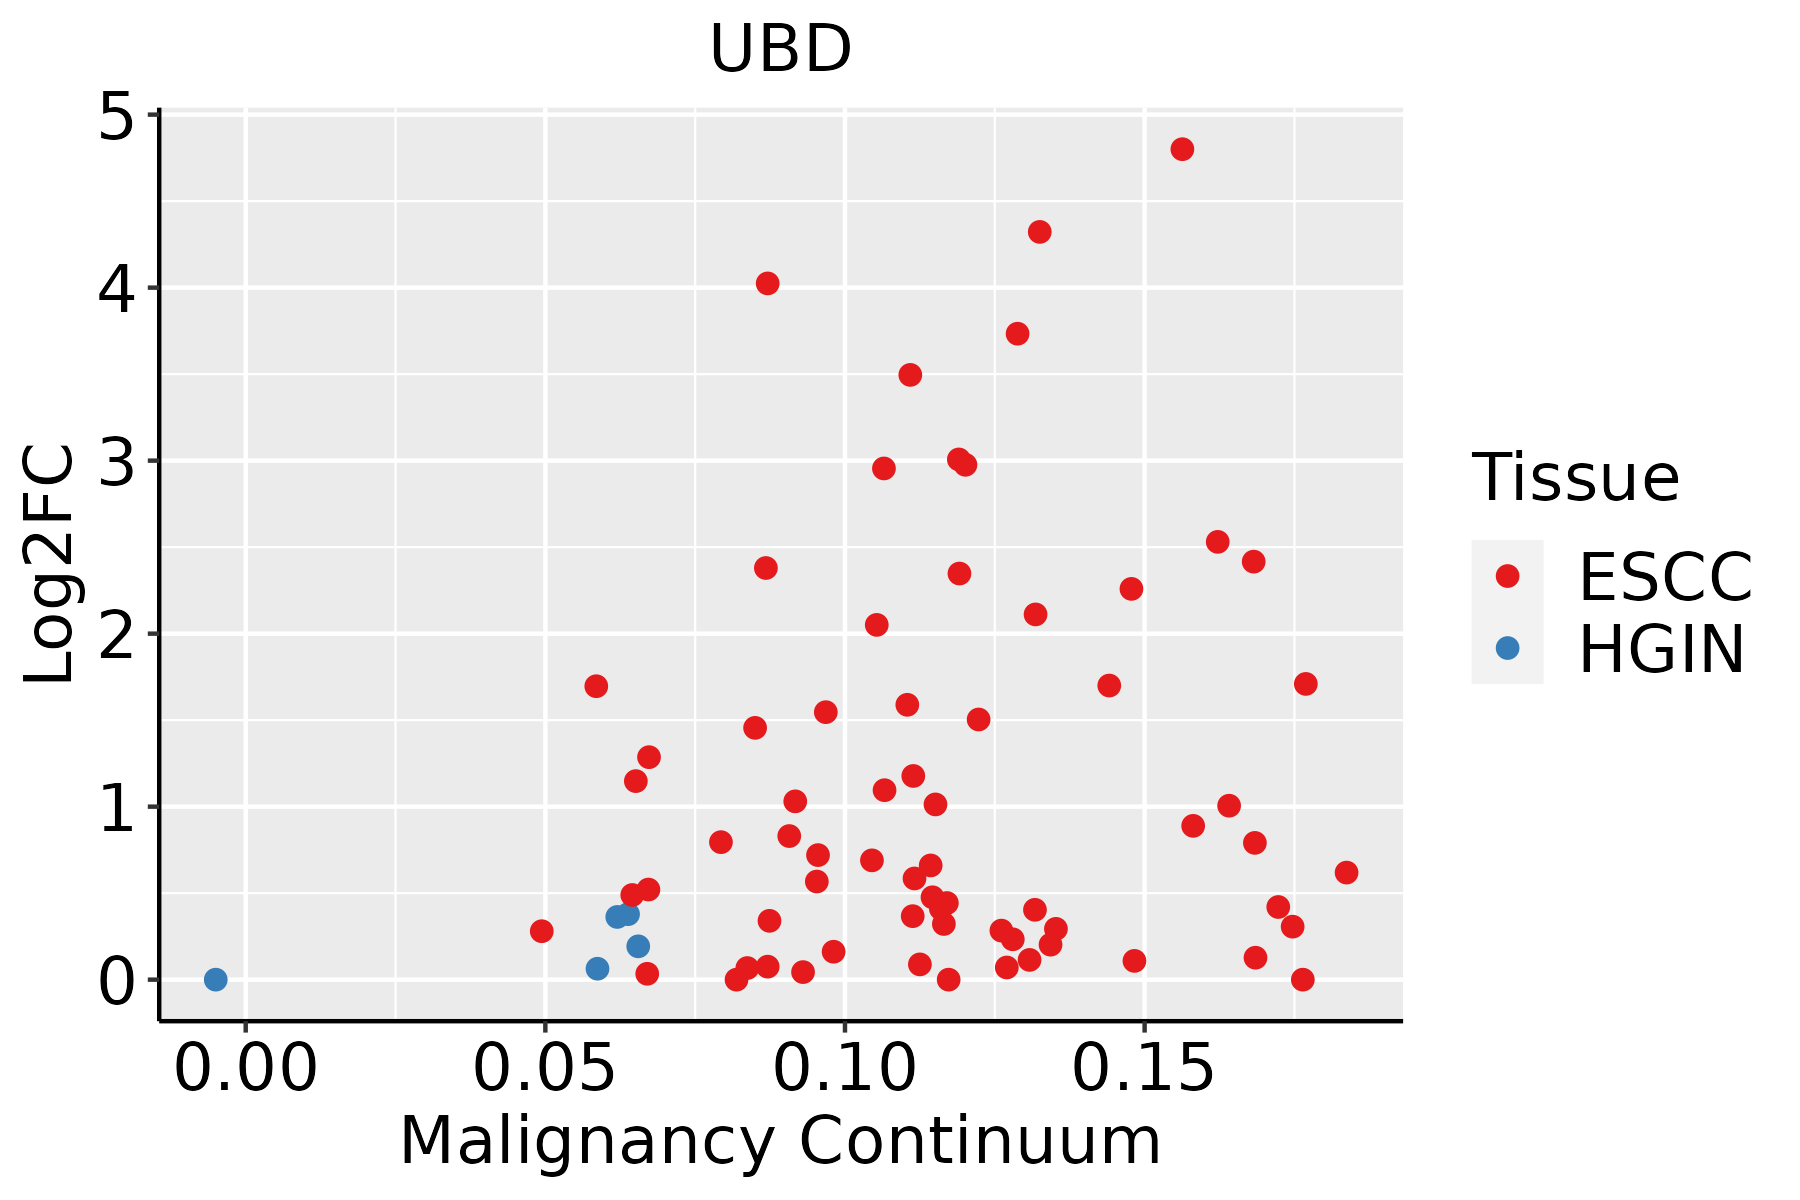 | ESCC: Esophageal squamous cell carcinoma |
| HGIN: High-grade intraepithelial neoplasias | ||
| LGIN: Low-grade intraepithelial neoplasias | ||
| Liver | 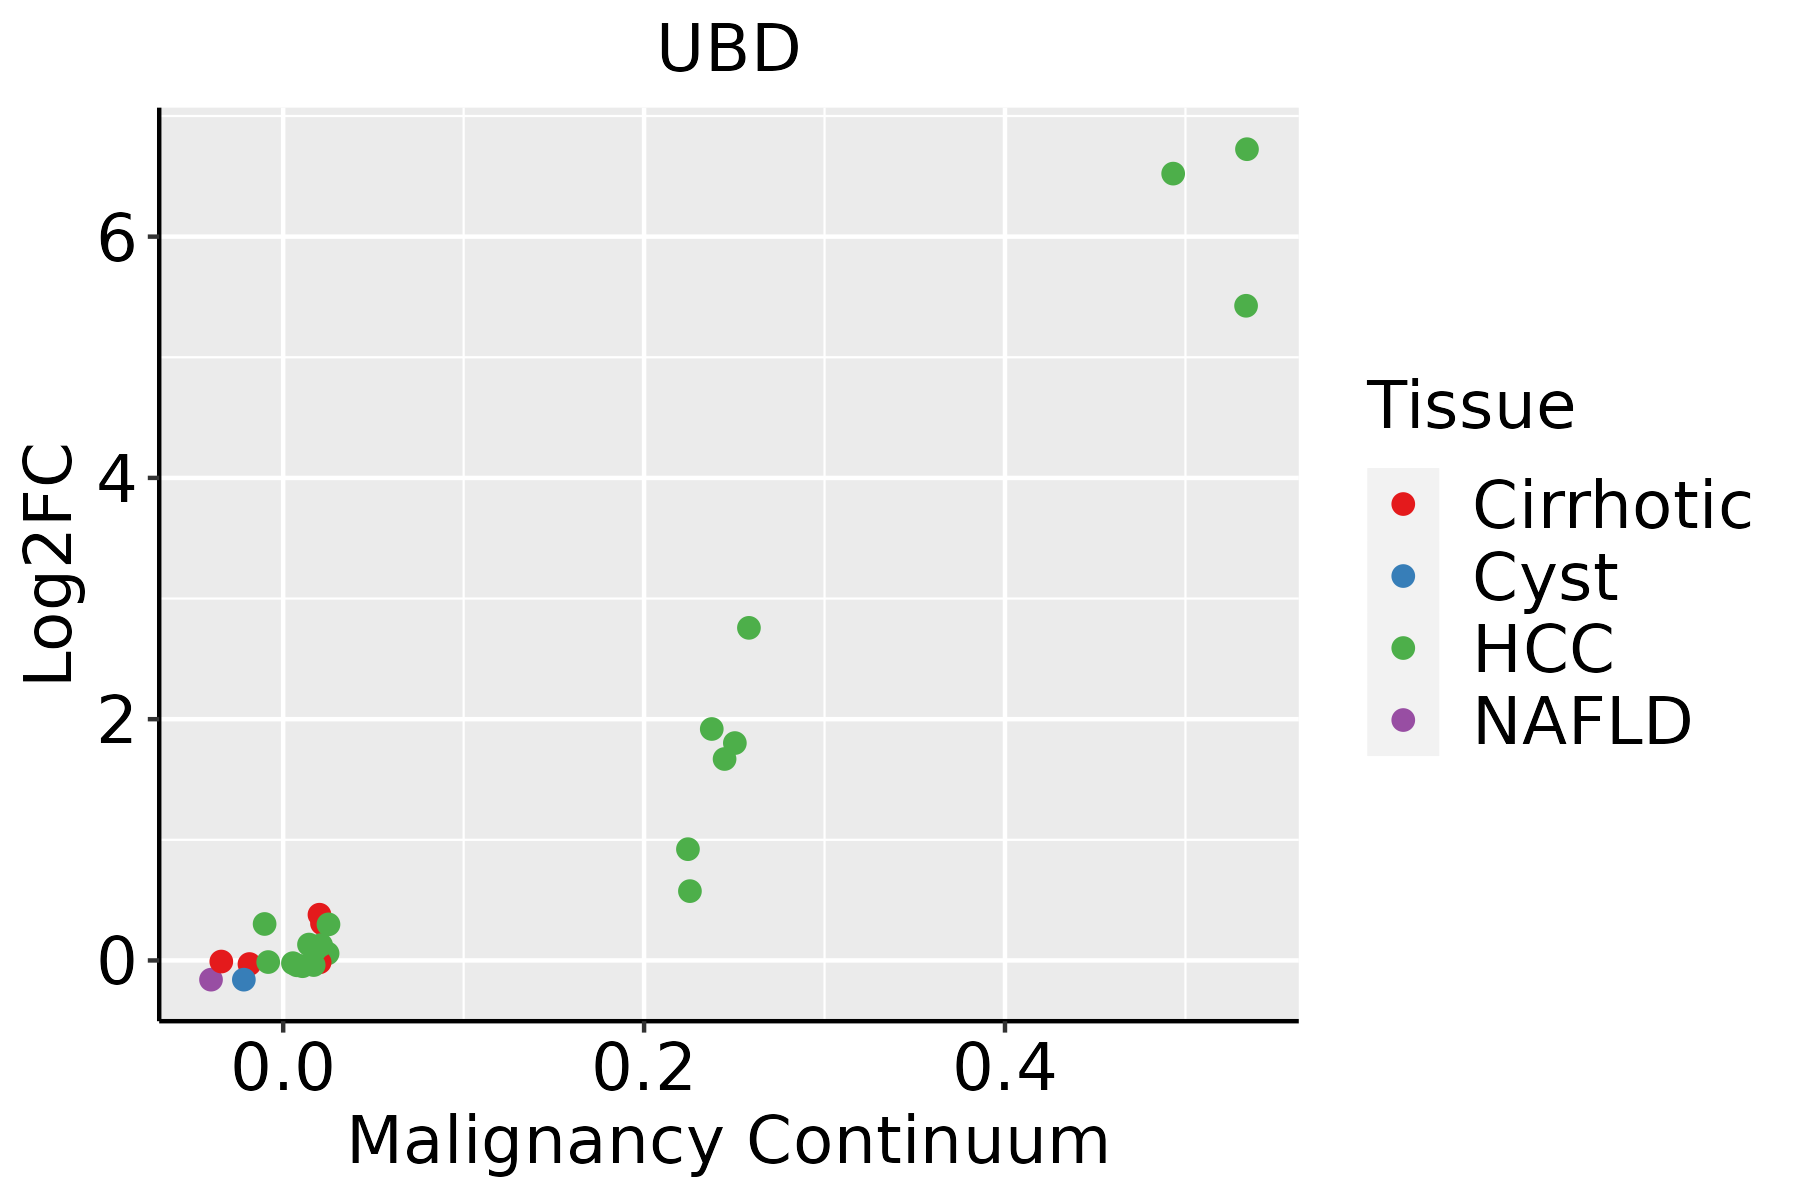 | HCC: Hepatocellular carcinoma |
| NAFLD: Non-alcoholic fatty liver disease | ||
| Oral Cavity |  | EOLP: Erosive Oral lichen planus |
| LP: leukoplakia | ||
| NEOLP: Non-erosive oral lichen planus | ||
| OSCC: Oral squamous cell carcinoma | ||
| Prostate | 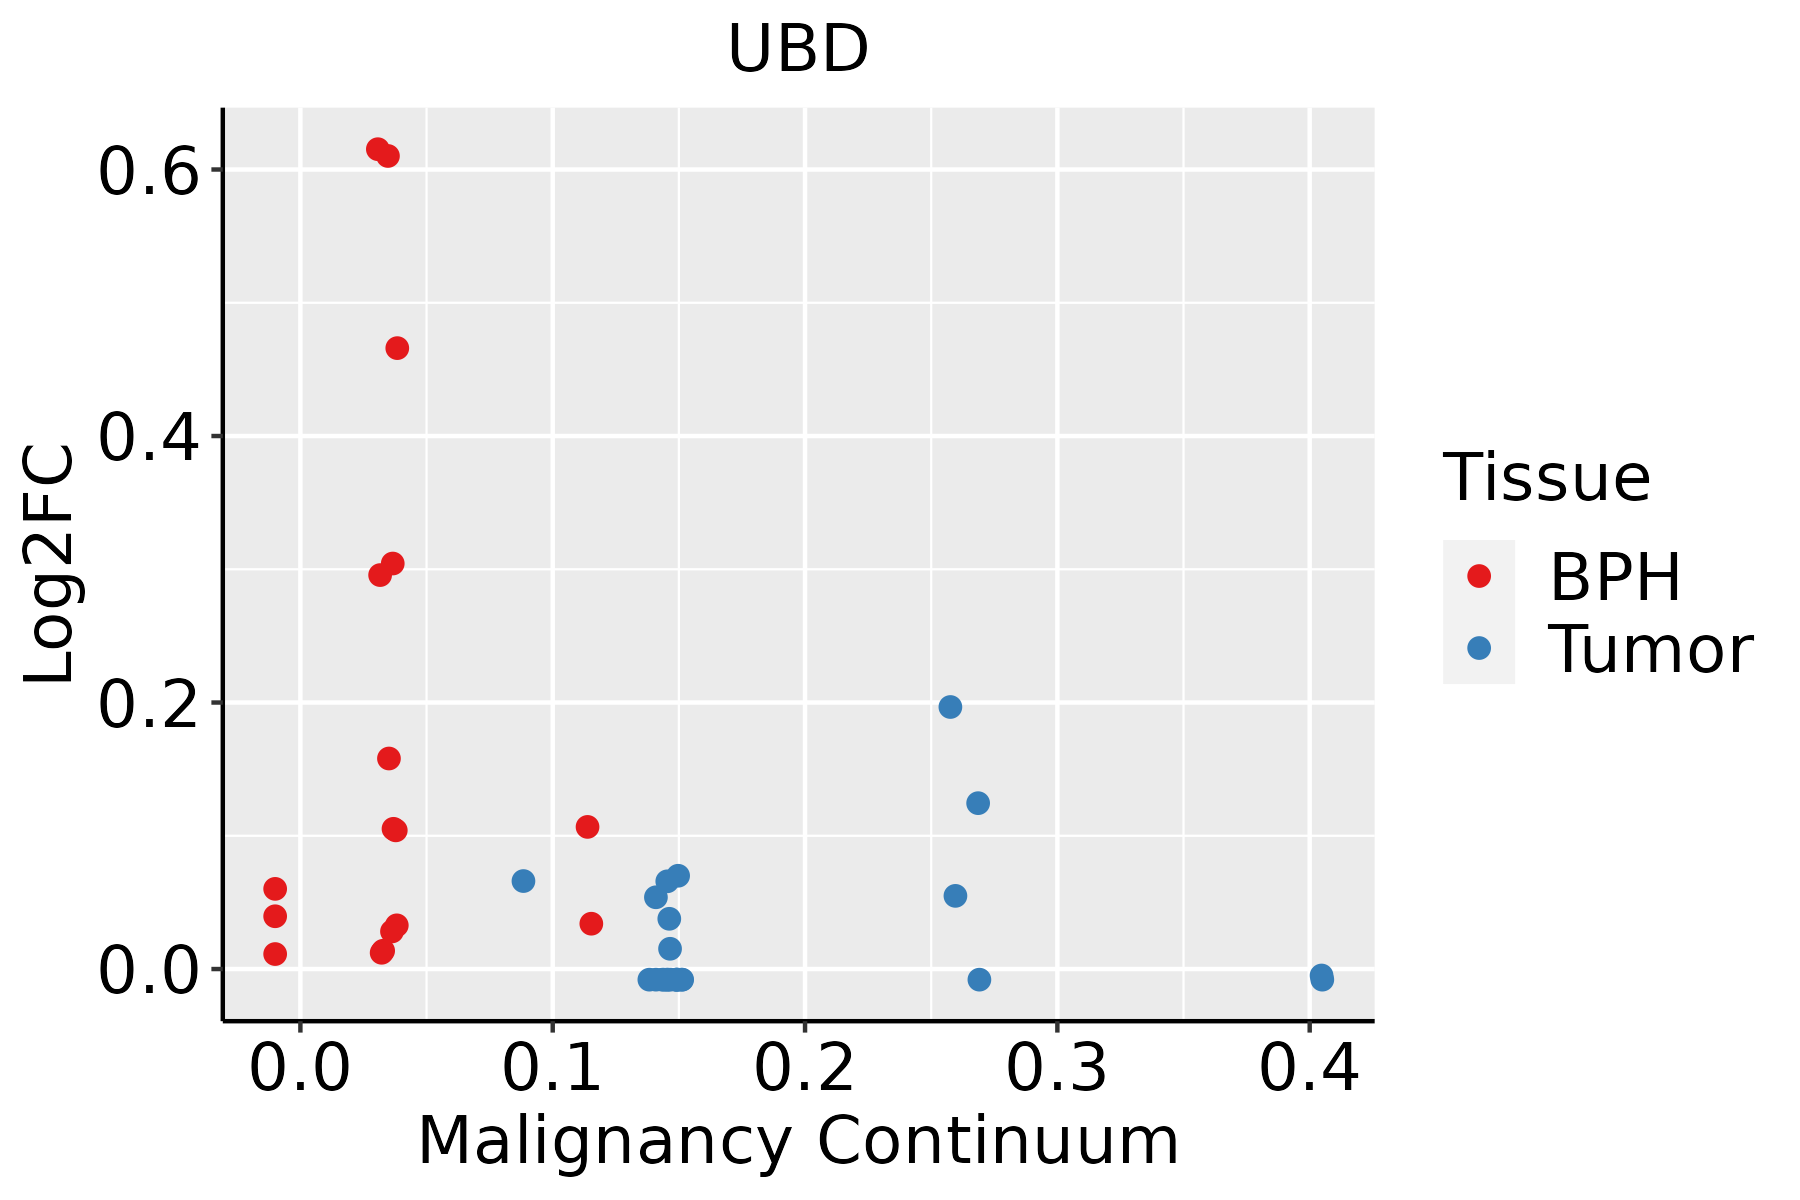 | BPH: Benign Prostatic Hyperplasia |
| ∗log2FC in expression of this searched gene in stem-like cells from each diseased tissue sample relative to stem-like cells in normal samples in each tissue plotted against the malignancy continuum. Samples are colored based on if they are from different disease stage. |
Top |
Malignant transformation related pathway analysis |
| Find out the enriched GO biological processes and KEGG pathways involved in transition from healthy to precancer to cancer |
| Tissue | Disease Stage | Enriched GO biological Processes |
| Colorectum | AD |  |
| Colorectum | SER |  |
| Colorectum | MSS |  |
| Colorectum | MSI-H |  |
| Colorectum | FAP |  |
| ∗Top 15 enriched GO BP terms are showed in the bar plot of each disease state in each tissue. Each row represents a significant GO biological process which is colored according to the -log10(p.adjust). |
| Page: 1 2 3 4 5 6 7 8 9 |
| GO ID | Tissue | Disease Stage | Description | Gene Ratio | Bg Ratio | pvalue | p.adjust | Count |
| GO:004477216 | Esophagus | ESCC | mitotic cell cycle phase transition | 281/8552 | 424/18723 | 4.63e-18 | 4.45e-16 | 281 |
| GO:000734615 | Esophagus | ESCC | regulation of mitotic cell cycle | 293/8552 | 457/18723 | 8.00e-16 | 5.64e-14 | 293 |
| GO:004312318 | Esophagus | ESCC | positive regulation of I-kappaB kinase/NF-kappaB signaling | 132/8552 | 186/18723 | 2.07e-12 | 8.58e-11 | 132 |
| GO:0043122110 | Esophagus | ESCC | regulation of I-kappaB kinase/NF-kappaB signaling | 167/8552 | 249/18723 | 6.11e-12 | 2.32e-10 | 167 |
| GO:000724919 | Esophagus | ESCC | I-kappaB kinase/NF-kappaB signaling | 183/8552 | 281/18723 | 3.02e-11 | 1.01e-09 | 183 |
| GO:190198713 | Esophagus | ESCC | regulation of cell cycle phase transition | 242/8552 | 390/18723 | 3.86e-11 | 1.26e-09 | 242 |
| GO:190199013 | Esophagus | ESCC | regulation of mitotic cell cycle phase transition | 191/8552 | 299/18723 | 1.35e-10 | 3.94e-09 | 191 |
| GO:0030099111 | Esophagus | ESCC | myeloid cell differentiation | 232/8552 | 381/18723 | 1.22e-09 | 2.90e-08 | 232 |
| GO:000257317 | Esophagus | ESCC | myeloid leukocyte differentiation | 128/8552 | 208/18723 | 2.75e-06 | 3.15e-05 | 128 |
| GO:003461220 | Esophagus | ESCC | response to tumor necrosis factor | 149/8552 | 253/18723 | 1.47e-05 | 1.33e-04 | 149 |
| GO:00343418 | Esophagus | ESCC | response to interferon-gamma | 86/8552 | 141/18723 | 1.74e-04 | 1.14e-03 | 86 |
| GO:19031317 | Esophagus | ESCC | mononuclear cell differentiation | 226/8552 | 426/18723 | 1.20e-03 | 5.88e-03 | 226 |
| GO:007084119 | Esophagus | ESCC | inclusion body assembly | 18/8552 | 24/18723 | 3.43e-03 | 1.41e-02 | 18 |
| GO:00072494 | Liver | Cirrhotic | I-kappaB kinase/NF-kappaB signaling | 108/4634 | 281/18723 | 2.21e-07 | 5.64e-06 | 108 |
| GO:00431225 | Liver | Cirrhotic | regulation of I-kappaB kinase/NF-kappaB signaling | 95/4634 | 249/18723 | 1.68e-06 | 3.22e-05 | 95 |
| GO:003009912 | Liver | Cirrhotic | myeloid cell differentiation | 135/4634 | 381/18723 | 1.69e-06 | 3.22e-05 | 135 |
| GO:00343413 | Liver | Cirrhotic | response to interferon-gamma | 60/4634 | 141/18723 | 2.57e-06 | 4.63e-05 | 60 |
| GO:00073463 | Liver | Cirrhotic | regulation of mitotic cell cycle | 154/4634 | 457/18723 | 8.73e-06 | 1.29e-04 | 154 |
| GO:00431234 | Liver | Cirrhotic | positive regulation of I-kappaB kinase/NF-kappaB signaling | 71/4634 | 186/18723 | 3.20e-05 | 3.97e-04 | 71 |
| GO:00447721 | Liver | Cirrhotic | mitotic cell cycle phase transition | 139/4634 | 424/18723 | 1.02e-04 | 1.06e-03 | 139 |
| Page: 1 2 3 4 |
| Pathway ID | Tissue | Disease Stage | Description | Gene Ratio | Bg Ratio | pvalue | p.adjust | qvalue | Count |
| Page: 1 |
Top |
Cell-cell communication analysis |
| Identification of potential cell-cell interactions between two cell types and their ligand-receptor pairs for different disease states |
| Ligand | Receptor | LRpair | Pathway | Tissue | Disease Stage |
| Page: 1 |
Top |
Single-cell gene regulatory network inference analysis |
| Find out the significant the regulons (TFs) and the target genes of each regulon across cell types for different disease states |
| TF | Cell Type | Tissue | Disease Stage | Target Gene | RSS | Regulon Activity |
| ∗The dot plots of a searched regulon are shown for all cell subpopulations in each disease state of each tissue based on the regulon specific score inferred using pySCENIC and by calculating the average expression. |
| Page: 1 |
Top |
Somatic mutation of malignant transformation related genes |
| Annotation of somatic variants for genes involved in malignant transformation |
| Hugo Symbol | Variant Class | Variant Classification | dbSNP RS | HGVSc | HGVSp | HGVSp Short | SWISSPROT | BIOTYPE | SIFT | PolyPhen | Tumor Sample Barcode | Tissue | Histology | Sex | Age | Stage | Therapy Types | Drugs | Outcome |
| UBD | SNV | Missense_Mutation | c.332N>T | p.Ser111Leu | p.S111L | O15205 | protein_coding | deleterious(0.01) | benign(0.304) | TCGA-JW-A5VL-01 | Cervix | cervical & endocervical cancer | Female | <65 | I/II | Unknown | Unknown | SD | |
| UBD | SNV | Missense_Mutation | rs370066296 | c.43N>A | p.Glu15Lys | p.E15K | O15205 | protein_coding | tolerated(0.25) | benign(0.184) | TCGA-A6-2686-01 | Colorectum | colon adenocarcinoma | Female | >=65 | I/II | Unknown | Unknown | SD |
| UBD | SNV | Missense_Mutation | rs764791738 | c.178N>T | p.Arg60Trp | p.R60W | O15205 | protein_coding | deleterious(0.01) | benign(0.127) | TCGA-CK-5916-01 | Colorectum | colon adenocarcinoma | Female | >=65 | I/II | Unknown | Unknown | PD |
| UBD | deletion | Frame_Shift_Del | c.97delN | p.Ile33SerfsTer25 | p.I33Sfs*25 | O15205 | protein_coding | TCGA-AA-3663-01 | Colorectum | colon adenocarcinoma | Male | <65 | I/II | Unknown | Unknown | SD | |||
| UBD | deletion | Frame_Shift_Del | c.97delN | p.Ile33SerfsTer25 | p.I33Sfs*25 | O15205 | protein_coding | TCGA-AD-5900-01 | Colorectum | colon adenocarcinoma | Male | >=65 | I/II | Unknown | Unknown | SD | |||
| UBD | SNV | Missense_Mutation | novel | c.421G>T | p.Asp141Tyr | p.D141Y | O15205 | protein_coding | deleterious(0.02) | probably_damaging(0.995) | TCGA-AJ-A3EK-01 | Endometrium | uterine corpus endometrioid carcinoma | Female | <65 | I/II | Chemotherapy | carboplatin | CR |
| UBD | SNV | Missense_Mutation | novel | c.397N>G | p.Thr133Ala | p.T133A | O15205 | protein_coding | tolerated(0.11) | benign(0.001) | TCGA-AJ-A5DW-01 | Endometrium | uterine corpus endometrioid carcinoma | Female | <65 | I/II | Unknown | Unknown | SD |
| UBD | SNV | Missense_Mutation | novel | c.148C>A | p.Leu50Ile | p.L50I | O15205 | protein_coding | deleterious(0) | probably_damaging(0.993) | TCGA-AP-A1DV-01 | Endometrium | uterine corpus endometrioid carcinoma | Female | <65 | I/II | Unknown | Unknown | SD |
| UBD | SNV | Missense_Mutation | novel | c.200G>A | p.Gly67Asp | p.G67D | O15205 | protein_coding | deleterious(0.02) | benign(0.149) | TCGA-AX-A0J1-01 | Endometrium | uterine corpus endometrioid carcinoma | Female | >=65 | I/II | Unknown | Unknown | SD |
| UBD | SNV | Missense_Mutation | novel | c.427A>G | p.Lys143Glu | p.K143E | O15205 | protein_coding | deleterious(0) | benign(0.079) | TCGA-B5-A3FA-01 | Endometrium | uterine corpus endometrioid carcinoma | Female | >=65 | I/II | Unknown | Unknown | SD |
| Page: 1 2 |
Top |
Related drugs of malignant transformation related genes |
| Identification of chemicals and drugs interact with genes involved in malignant transfromation |
| (DGIdb 4.0) |
| Entrez ID | Symbol | Category | Interaction Types | Drug Claim Name | Drug Name | PMIDs |
| Page: 1 |

Copyright 2023-Present -The University of Texas Health Science Center at Houston |