
|
|||||
|
 | |
| |
| |
| |
| |
| |
|
Gene: UBASH3B |
Gene summary for UBASH3B |
| Gene information | Species | Human | Gene symbol | UBASH3B | Gene ID | 84959 |
| Gene name | ubiquitin associated and SH3 domain containing B | |
| Gene Alias | STS-1 | |
| Cytomap | 11q24.1 | |
| Gene Type | protein-coding | GO ID | GO:0001775 | UniProtAcc | Q8TF42 |
Top |
Malignant transformation analysis |
| Identification of the aberrant gene expression in precancerous and cancerous lesions by comparing the gene expression of stem-like cells in diseased tissues with normal stem cells |
| Entrez ID | Symbol | Replicates | Species | Organ | Tissue | Adj P-value | Log2FC | Malignancy |
| 84959 | UBASH3B | EEC-subject2 | Human | Endometrium | EEC | 6.56e-04 | 2.14e-01 | -0.2607 |
| 84959 | UBASH3B | HCC1_Meng | Human | Liver | HCC | 3.82e-05 | 9.78e-03 | 0.0246 |
| 84959 | UBASH3B | HCC2_Meng | Human | Liver | HCC | 1.25e-02 | 1.04e-02 | 0.0107 |
| 84959 | UBASH3B | S027 | Human | Liver | HCC | 2.32e-07 | 6.12e-01 | 0.2446 |
| 84959 | UBASH3B | S028 | Human | Liver | HCC | 7.99e-17 | 7.77e-01 | 0.2503 |
| 84959 | UBASH3B | S029 | Human | Liver | HCC | 4.67e-15 | 7.31e-01 | 0.2581 |
| 84959 | UBASH3B | GSM5252131_BPH340PrSF_Via | Human | Prostate | BPH | 3.36e-03 | 1.71e-01 | -0.2126 |
| 84959 | UBASH3B | GSM5252132_BPH389PrGF | Human | Prostate | BPH | 1.81e-02 | 2.24e-01 | -0.2247 |
| 84959 | UBASH3B | 047563_1562-all-cells | Human | Prostate | BPH | 5.93e-04 | 2.98e-01 | 0.0791 |
| 84959 | UBASH3B | 048752_1579-all-cells | Human | Prostate | BPH | 1.31e-30 | 6.80e-01 | 0.1008 |
| 84959 | UBASH3B | 052095_1628-all-cells | Human | Prostate | BPH | 1.11e-13 | 3.63e-01 | 0.1032 |
| 84959 | UBASH3B | 052097_1595-all-cells | Human | Prostate | BPH | 1.67e-20 | 4.49e-01 | 0.0972 |
| 84959 | UBASH3B | 052099_1652-all-cells | Human | Prostate | BPH | 4.66e-26 | 5.68e-01 | 0.1038 |
| Page: 1 |
| Tissue | Expression Dynamics | Abbreviation |
| Endometrium |  | AEH: Atypical endometrial hyperplasia |
| EEC: Endometrioid Cancer | ||
| Liver | 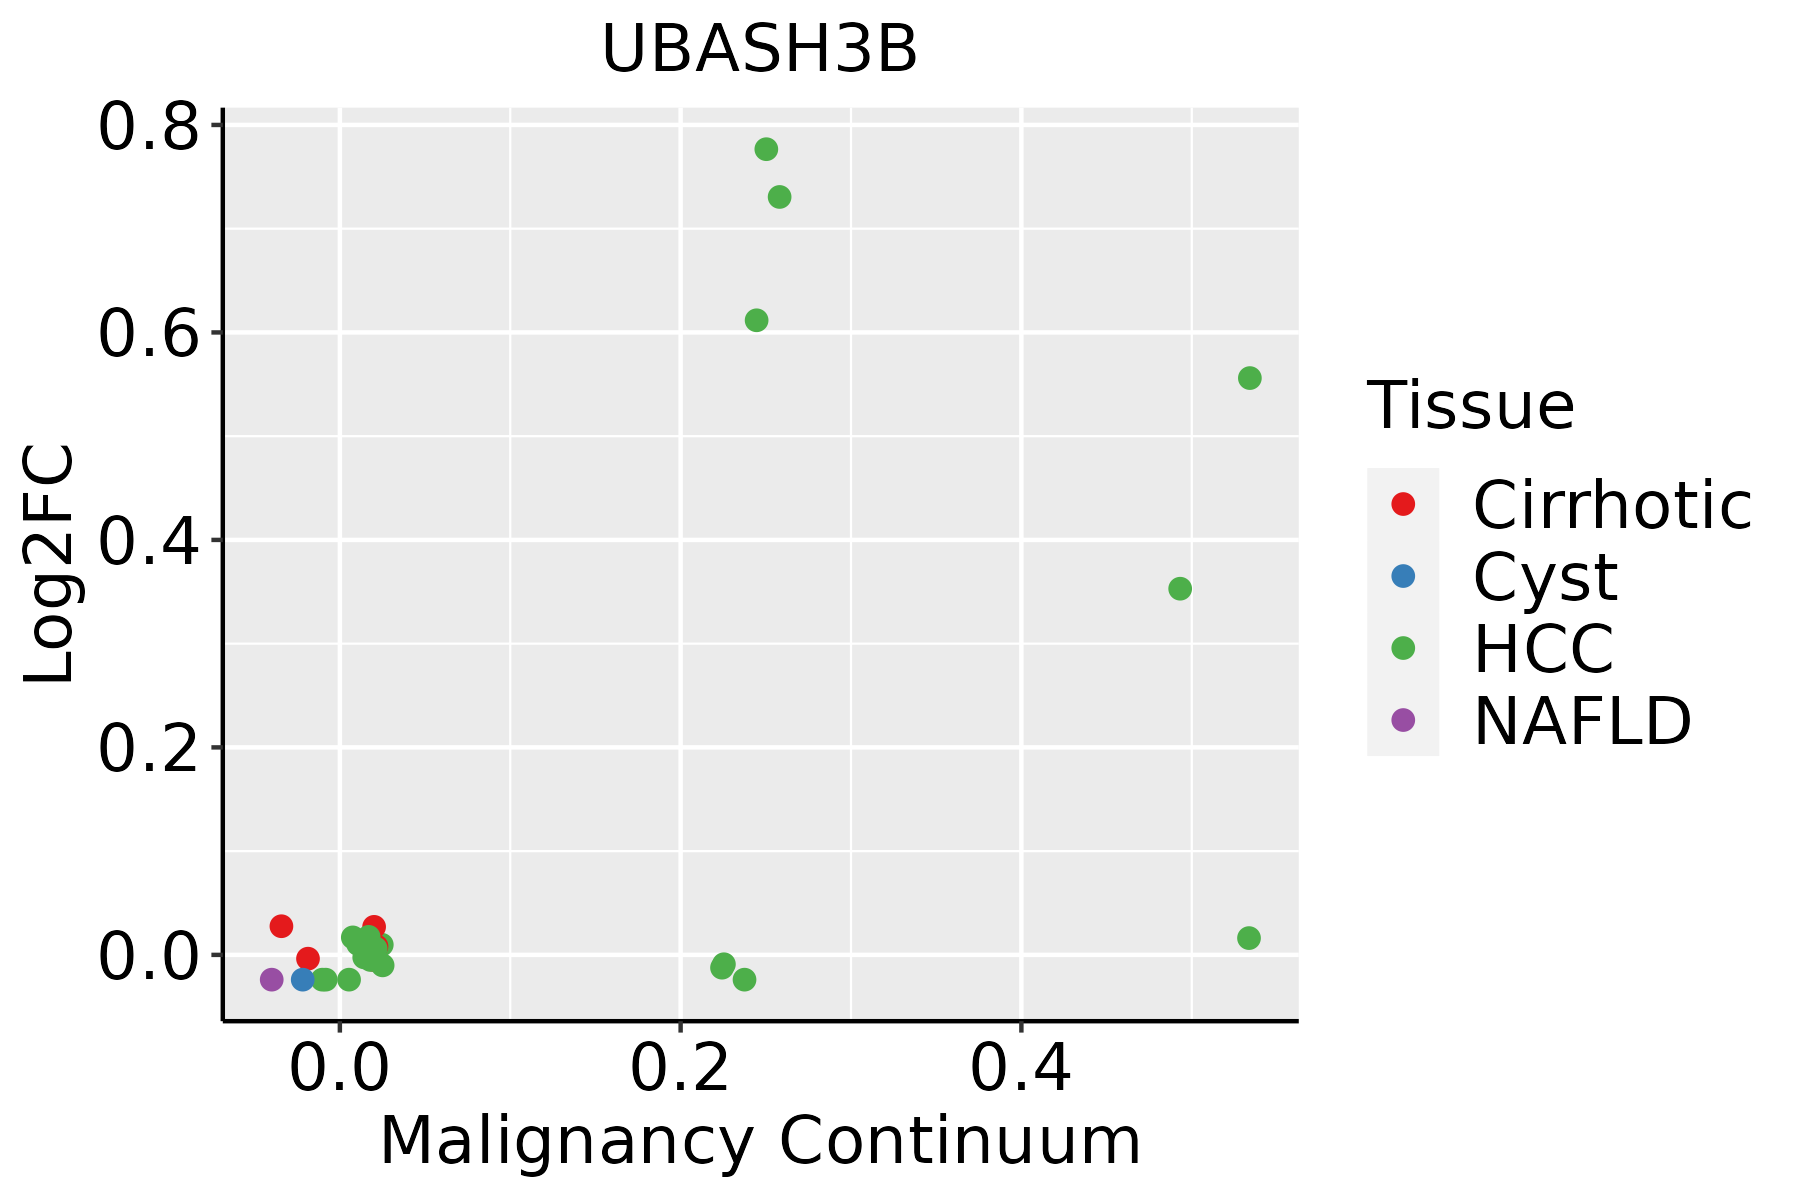 | HCC: Hepatocellular carcinoma |
| NAFLD: Non-alcoholic fatty liver disease | ||
| Prostate | 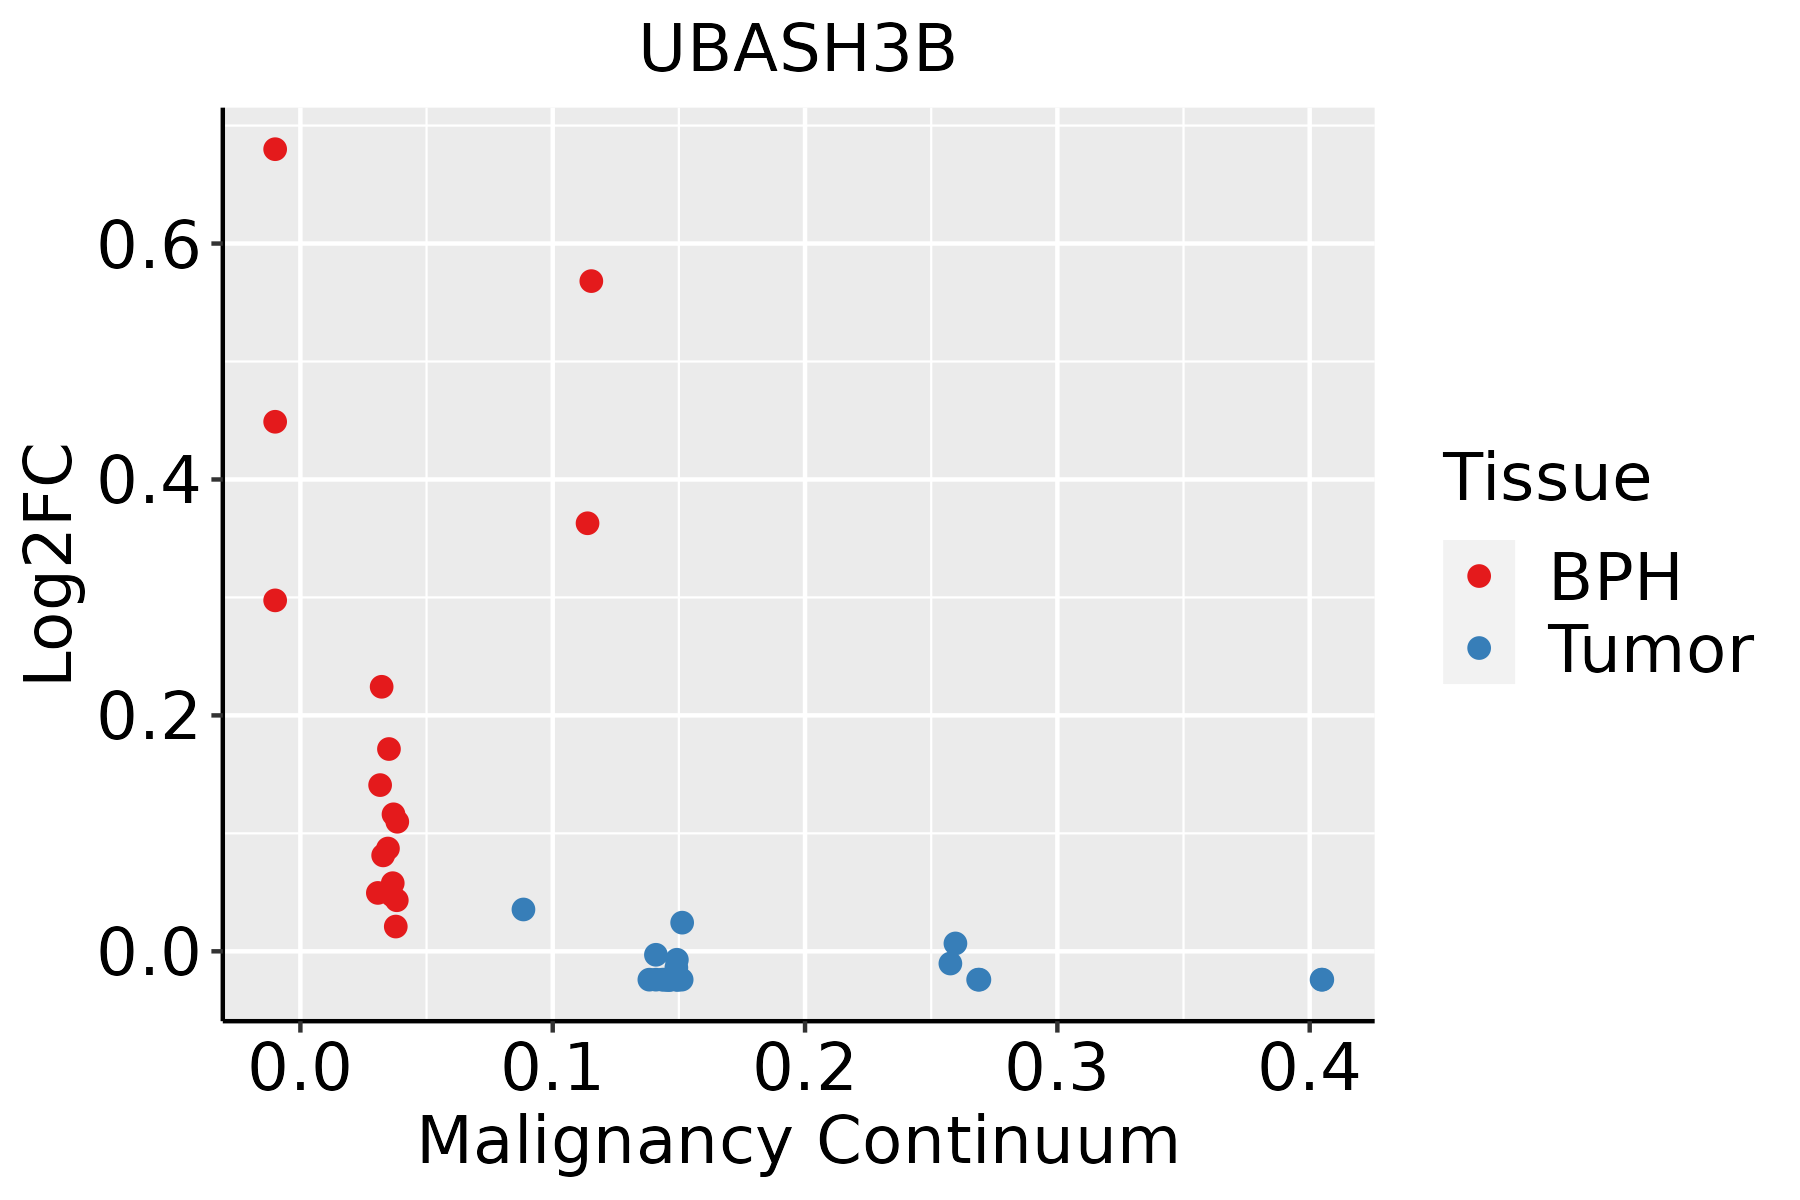 | BPH: Benign Prostatic Hyperplasia |
| ∗log2FC in expression of this searched gene in stem-like cells from each diseased tissue sample relative to stem-like cells in normal samples in each tissue plotted against the malignancy continuum. Samples are colored based on if they are from different disease stage. |
Top |
Malignant transformation related pathway analysis |
| Find out the enriched GO biological processes and KEGG pathways involved in transition from healthy to precancer to cancer |
| Tissue | Disease Stage | Enriched GO biological Processes |
| Colorectum | AD |  |
| Colorectum | SER |  |
| Colorectum | MSS |  |
| Colorectum | MSI-H |  |
| Colorectum | FAP |  |
| ∗Top 15 enriched GO BP terms are showed in the bar plot of each disease state in each tissue. Each row represents a significant GO biological process which is colored according to the -log10(p.adjust). |
| Page: 1 2 3 4 5 6 7 8 9 |
| GO ID | Tissue | Disease Stage | Description | Gene Ratio | Bg Ratio | pvalue | p.adjust | Count |
| GO:005109817 | Endometrium | EEC | regulation of binding | 83/2168 | 363/18723 | 6.72e-10 | 6.61e-08 | 83 |
| GO:004206017 | Endometrium | EEC | wound healing | 92/2168 | 422/18723 | 1.12e-09 | 9.58e-08 | 92 |
| GO:004339315 | Endometrium | EEC | regulation of protein binding | 46/2168 | 196/18723 | 1.94e-06 | 5.80e-05 | 46 |
| GO:002240715 | Endometrium | EEC | regulation of cell-cell adhesion | 84/2168 | 448/18723 | 4.98e-06 | 1.24e-04 | 84 |
| GO:005123515 | Endometrium | EEC | maintenance of location | 62/2168 | 327/18723 | 5.92e-05 | 9.13e-04 | 62 |
| GO:003410916 | Endometrium | EEC | homotypic cell-cell adhesion | 24/2168 | 90/18723 | 6.35e-05 | 9.48e-04 | 24 |
| GO:190370615 | Endometrium | EEC | regulation of hemopoiesis | 67/2168 | 367/18723 | 1.01e-04 | 1.40e-03 | 67 |
| GO:005165117 | Endometrium | EEC | maintenance of location in cell | 44/2168 | 214/18723 | 1.02e-04 | 1.41e-03 | 44 |
| GO:005134817 | Endometrium | EEC | negative regulation of transferase activity | 52/2168 | 268/18723 | 1.23e-04 | 1.64e-03 | 52 |
| GO:000759613 | Endometrium | EEC | blood coagulation | 44/2168 | 217/18723 | 1.42e-04 | 1.84e-03 | 44 |
| GO:004593617 | Endometrium | EEC | negative regulation of phosphate metabolic process | 77/2168 | 441/18723 | 1.45e-04 | 1.87e-03 | 77 |
| GO:001056317 | Endometrium | EEC | negative regulation of phosphorus metabolic process | 77/2168 | 442/18723 | 1.56e-04 | 1.97e-03 | 77 |
| GO:190303415 | Endometrium | EEC | regulation of response to wounding | 36/2168 | 167/18723 | 1.58e-04 | 1.99e-03 | 36 |
| GO:000189415 | Endometrium | EEC | tissue homeostasis | 51/2168 | 268/18723 | 2.34e-04 | 2.75e-03 | 51 |
| GO:000759913 | Endometrium | EEC | hemostasis | 44/2168 | 222/18723 | 2.43e-04 | 2.85e-03 | 44 |
| GO:005081713 | Endometrium | EEC | coagulation | 44/2168 | 222/18723 | 2.43e-04 | 2.85e-03 | 44 |
| GO:004563717 | Endometrium | EEC | regulation of myeloid cell differentiation | 42/2168 | 210/18723 | 2.72e-04 | 3.09e-03 | 42 |
| GO:001095914 | Endometrium | EEC | regulation of metal ion transport | 70/2168 | 406/18723 | 4.12e-04 | 4.35e-03 | 70 |
| GO:006024914 | Endometrium | EEC | anatomical structure homeostasis | 56/2168 | 314/18723 | 6.52e-04 | 6.35e-03 | 56 |
| GO:000647013 | Endometrium | EEC | protein dephosphorylation | 51/2168 | 281/18723 | 7.38e-04 | 7.01e-03 | 51 |
| Page: 1 2 3 4 5 |
| Pathway ID | Tissue | Disease Stage | Description | Gene Ratio | Bg Ratio | pvalue | p.adjust | qvalue | Count |
| Page: 1 |
Top |
Cell-cell communication analysis |
| Identification of potential cell-cell interactions between two cell types and their ligand-receptor pairs for different disease states |
| Ligand | Receptor | LRpair | Pathway | Tissue | Disease Stage |
| Page: 1 |
Top |
Single-cell gene regulatory network inference analysis |
| Find out the significant the regulons (TFs) and the target genes of each regulon across cell types for different disease states |
| TF | Cell Type | Tissue | Disease Stage | Target Gene | RSS | Regulon Activity |
| ∗The dot plots of a searched regulon are shown for all cell subpopulations in each disease state of each tissue based on the regulon specific score inferred using pySCENIC and by calculating the average expression. |
| Page: 1 |
Top |
Somatic mutation of malignant transformation related genes |
| Annotation of somatic variants for genes involved in malignant transformation |
| Hugo Symbol | Variant Class | Variant Classification | dbSNP RS | HGVSc | HGVSp | HGVSp Short | SWISSPROT | BIOTYPE | SIFT | PolyPhen | Tumor Sample Barcode | Tissue | Histology | Sex | Age | Stage | Therapy Types | Drugs | Outcome |
| UBASH3B | SNV | Missense_Mutation | c.1582G>A | p.Asp528Asn | p.D528N | Q8TF42 | protein_coding | tolerated(0.08) | probably_damaging(0.993) | TCGA-AC-A23H-01 | Breast | breast invasive carcinoma | Female | >=65 | I/II | Unknown | Unknown | PD | |
| UBASH3B | SNV | Missense_Mutation | c.920N>A | p.Gly307Glu | p.G307E | Q8TF42 | protein_coding | deleterious(0) | probably_damaging(1) | TCGA-BH-A0HF-01 | Breast | breast invasive carcinoma | Female | >=65 | I/II | Hormone Therapy | arimidex | SD | |
| UBASH3B | insertion | Nonsense_Mutation | novel | c.684_685insTGTTCAGGCAGCATGTGACTGGTTGGTATGAGATAAAT | p.Lys229CysfsTer6 | p.K229Cfs*6 | Q8TF42 | protein_coding | TCGA-A2-A0EY-01 | Breast | breast invasive carcinoma | Female | <65 | I/II | Chemotherapy | adriamycin | SD | ||
| UBASH3B | insertion | Nonsense_Mutation | novel | c.1774_1775insATTAAGACCAGCCTGGCCAAGATGGTGAAACCCCAT | p.Pro592delinsHisTerAspGlnProGlyGlnAspGlyGluThrProSer | p.P592delinsH*DQPGQDGETPS | Q8TF42 | protein_coding | TCGA-A8-A07O-01 | Breast | breast invasive carcinoma | Female | <65 | I/II | Chemotherapy | CR | |||
| UBASH3B | insertion | Frame_Shift_Ins | novel | c.484_485insCAAAAGACTGTGGCAAGTGCGTTTATCAAGTCAA | p.Leu162ProfsTer41 | p.L162Pfs*41 | Q8TF42 | protein_coding | TCGA-AN-A0FN-01 | Breast | breast invasive carcinoma | Female | <65 | I/II | Unknown | Unknown | SD | ||
| UBASH3B | insertion | Frame_Shift_Ins | novel | c.775_776insACATC | p.Leu259TyrfsTer45 | p.L259Yfs*45 | Q8TF42 | protein_coding | TCGA-AR-A0TY-01 | Breast | breast invasive carcinoma | Female | <65 | I/II | Unspecific | Paclitaxel | PD | ||
| UBASH3B | insertion | Frame_Shift_Ins | novel | c.778_779insTCAGGGCCTGC | p.Gln260LeufsTer46 | p.Q260Lfs*46 | Q8TF42 | protein_coding | TCGA-AR-A0TY-01 | Breast | breast invasive carcinoma | Female | <65 | I/II | Unspecific | Paclitaxel | PD | ||
| UBASH3B | SNV | Missense_Mutation | c.1724N>T | p.Ala575Val | p.A575V | Q8TF42 | protein_coding | deleterious(0) | possibly_damaging(0.752) | TCGA-FU-A3HZ-01 | Cervix | cervical & endocervical cancer | Female | <65 | I/II | Chemotherapy | cisplatin | CR | |
| UBASH3B | SNV | Missense_Mutation | c.1057G>A | p.Glu353Lys | p.E353K | Q8TF42 | protein_coding | tolerated(0.6) | benign(0.031) | TCGA-JX-A3Q0-01 | Cervix | cervical & endocervical cancer | Female | <65 | III/IV | Unknown | Unknown | SD | |
| UBASH3B | SNV | Missense_Mutation | c.1930G>C | p.Glu644Gln | p.E644Q | Q8TF42 | protein_coding | tolerated(0.14) | benign(0.086) | TCGA-UC-A7PF-01 | Cervix | cervical & endocervical cancer | Female | <65 | I/II | Unknown | Unknown | SD |
| Page: 1 2 3 4 5 6 7 8 9 |
Top |
Related drugs of malignant transformation related genes |
| Identification of chemicals and drugs interact with genes involved in malignant transfromation |
| (DGIdb 4.0) |
| Entrez ID | Symbol | Category | Interaction Types | Drug Claim Name | Drug Name | PMIDs |
| Page: 1 |

Copyright 2023-Present -The University of Texas Health Science Center at Houston |