| Tissue | Expression Dynamics | Abbreviation |
| Cervix | 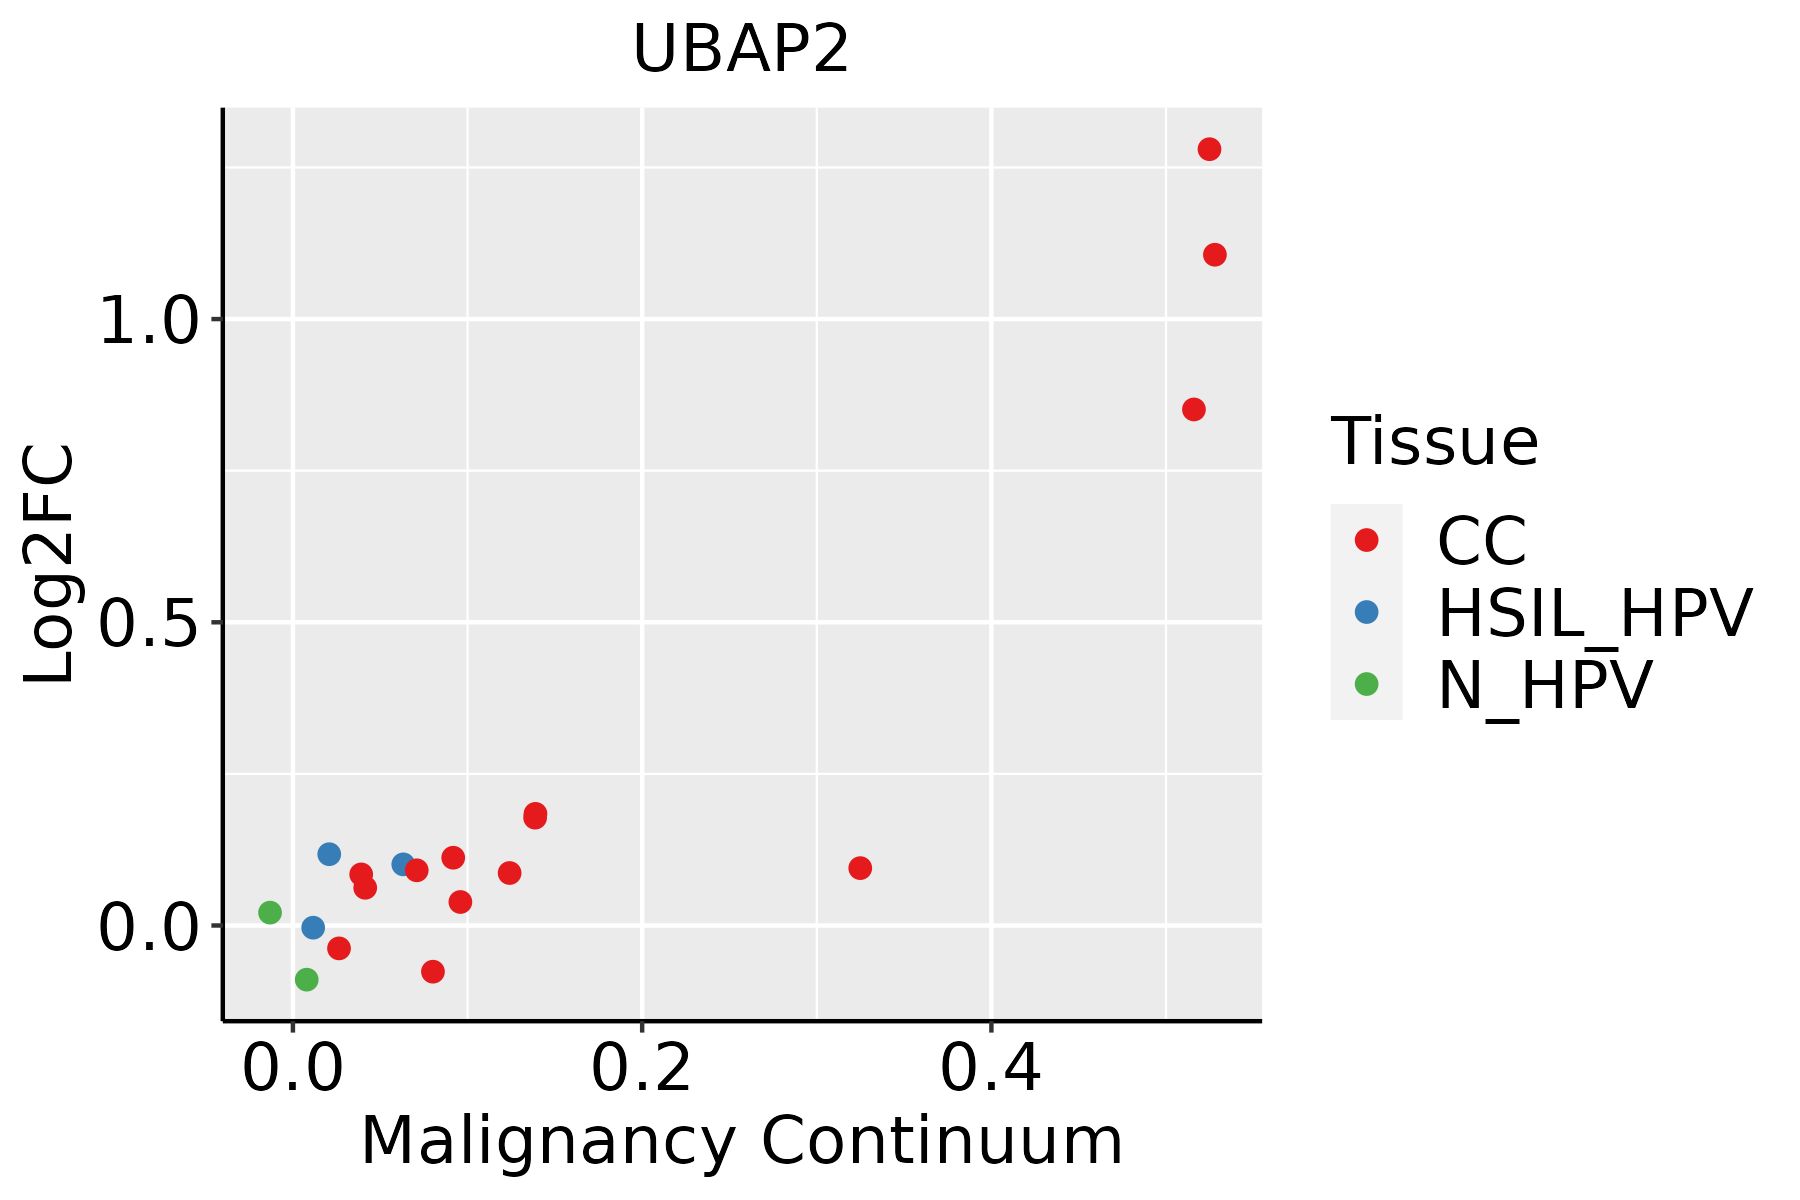 | CC: Cervix cancer |
| HSIL_HPV: HPV-infected high-grade squamous intraepithelial lesions |
| N_HPV: HPV-infected normal cervix |
| Colorectum (GSE201348) | 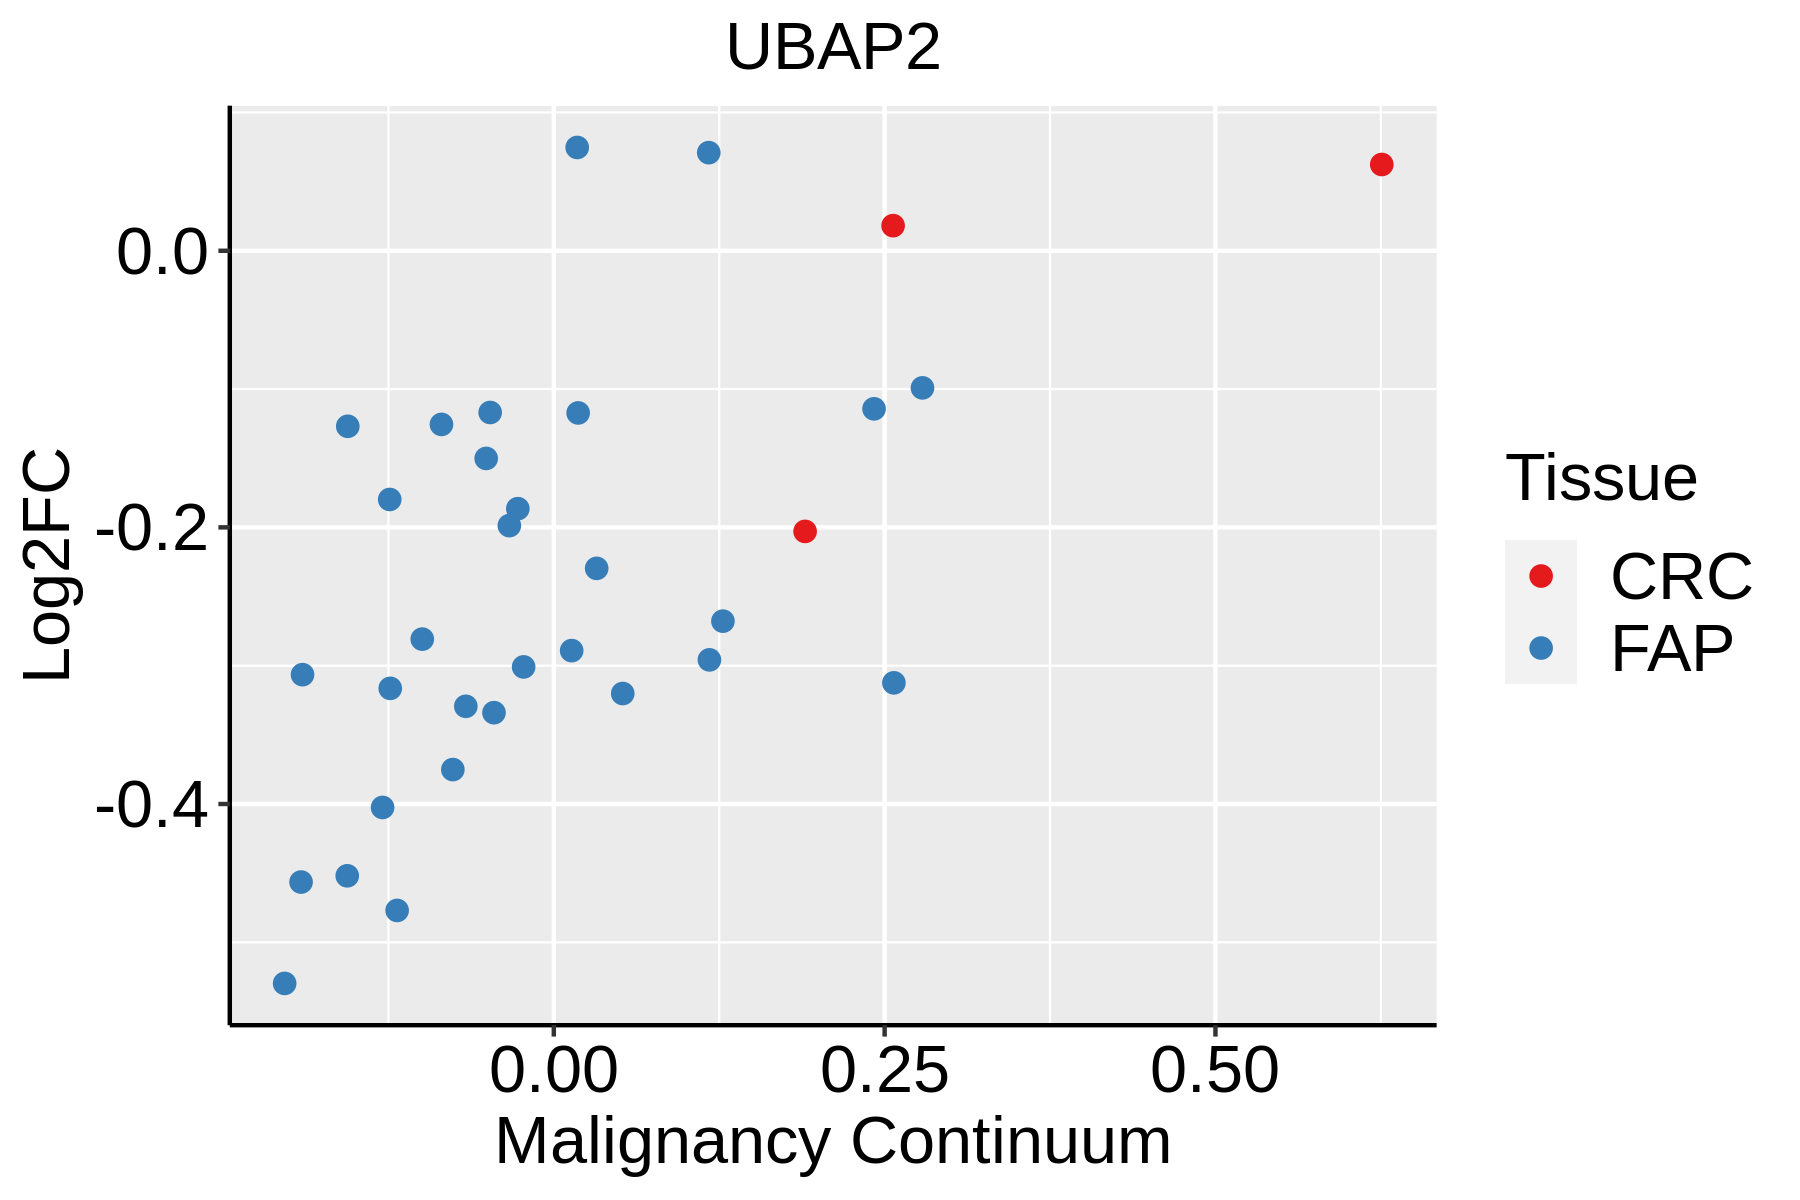 | FAP: Familial adenomatous polyposis |
| CRC: Colorectal cancer |
| Colorectum (HTA11) |  | AD: Adenomas |
| SER: Sessile serrated lesions |
| MSI-H: Microsatellite-high colorectal cancer |
| MSS: Microsatellite stable colorectal cancer |
| Endometrium |  | AEH: Atypical endometrial hyperplasia |
| EEC: Endometrioid Cancer |
| Esophagus | 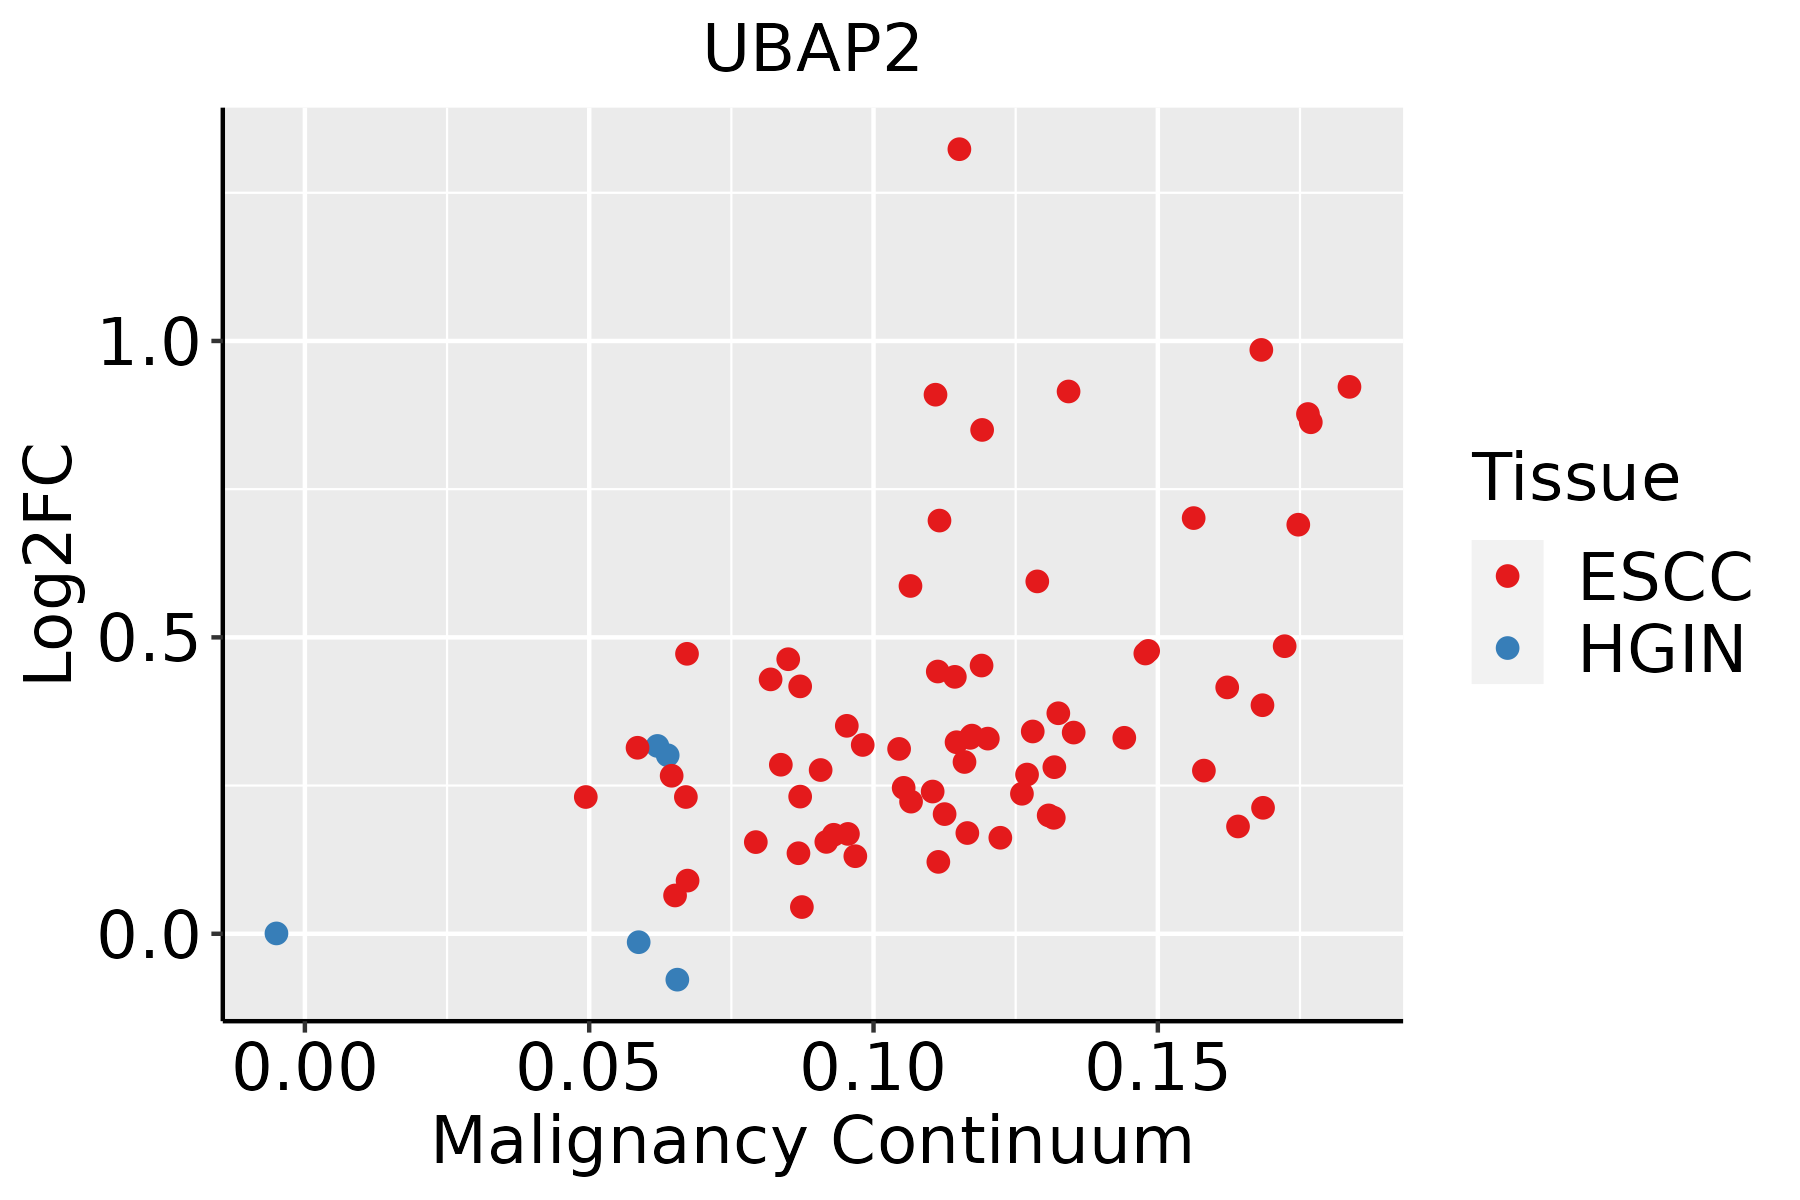 | ESCC: Esophageal squamous cell carcinoma |
| HGIN: High-grade intraepithelial neoplasias |
| LGIN: Low-grade intraepithelial neoplasias |
| Liver | 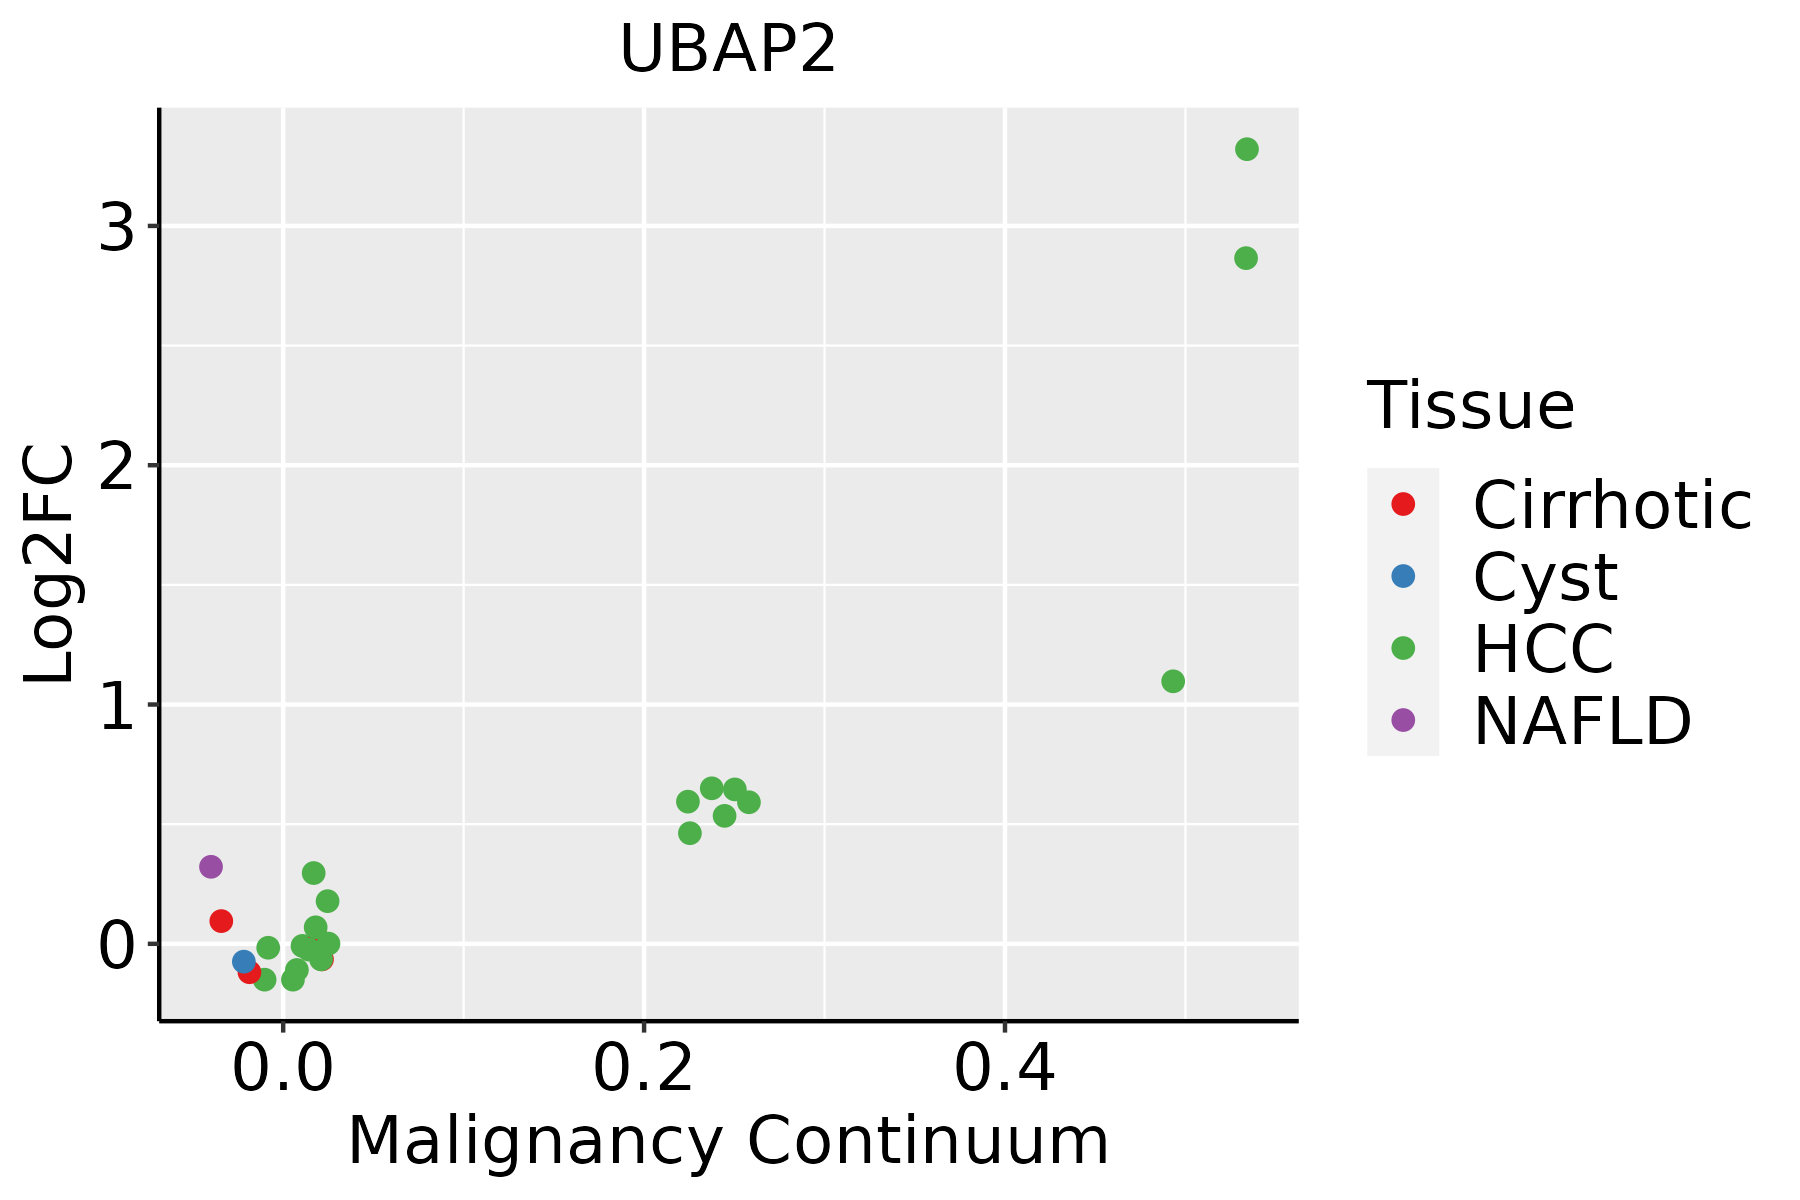 | HCC: Hepatocellular carcinoma |
| NAFLD: Non-alcoholic fatty liver disease |
| Oral Cavity |  | EOLP: Erosive Oral lichen planus |
| LP: leukoplakia |
| NEOLP: Non-erosive oral lichen planus |
| OSCC: Oral squamous cell carcinoma |
| Prostate |  | BPH: Benign Prostatic Hyperplasia |
| Thyroid |  | ATC: Anaplastic thyroid cancer |
| HT: Hashimoto's thyroiditis |
| PTC: Papillary thyroid cancer |
| GO ID | Tissue | Disease Stage | Description | Gene Ratio | Bg Ratio | pvalue | p.adjust | Count |
| GO:0048872111 | Esophagus | ESCC | homeostasis of number of cells | 163/8552 | 272/18723 | 1.40e-06 | 1.69e-05 | 163 |
| GO:003406315 | Esophagus | ESCC | stress granule assembly | 23/8552 | 26/18723 | 6.82e-06 | 6.90e-05 | 23 |
| GO:00340633 | Liver | NAFLD | stress granule assembly | 9/1882 | 26/18723 | 6.56e-04 | 8.50e-03 | 9 |
| GO:00488727 | Liver | NAFLD | homeostasis of number of cells | 43/1882 | 272/18723 | 1.86e-03 | 1.91e-02 | 43 |
| GO:00340632 | Liver | HCC | stress granule assembly | 24/7958 | 26/18723 | 1.35e-07 | 2.57e-06 | 24 |
| GO:004887222 | Liver | HCC | homeostasis of number of cells | 147/7958 | 272/18723 | 7.48e-05 | 6.70e-04 | 147 |
| GO:004887220 | Oral cavity | OSCC | homeostasis of number of cells | 152/7305 | 272/18723 | 1.08e-08 | 2.23e-07 | 152 |
| GO:00340637 | Oral cavity | OSCC | stress granule assembly | 21/7305 | 26/18723 | 1.66e-05 | 1.64e-04 | 21 |
| GO:003406314 | Oral cavity | LP | stress granule assembly | 14/4623 | 26/18723 | 1.33e-03 | 1.07e-02 | 14 |
| GO:0048872110 | Oral cavity | LP | homeostasis of number of cells | 87/4623 | 272/18723 | 3.75e-03 | 2.47e-02 | 87 |
| GO:004887218 | Prostate | BPH | homeostasis of number of cells | 79/3107 | 272/18723 | 1.79e-07 | 3.99e-06 | 79 |
| GO:00340636 | Prostate | BPH | stress granule assembly | 15/3107 | 26/18723 | 2.37e-06 | 3.83e-05 | 15 |
| GO:004887219 | Prostate | Tumor | homeostasis of number of cells | 86/3246 | 272/18723 | 5.29e-09 | 2.11e-07 | 86 |
| GO:003406313 | Prostate | Tumor | stress granule assembly | 15/3246 | 26/18723 | 4.17e-06 | 6.64e-05 | 15 |
| GO:004887229 | Skin | cSCC | homeostasis of number of cells | 104/4864 | 272/18723 | 5.34e-06 | 7.71e-05 | 104 |
| GO:003406316 | Skin | cSCC | stress granule assembly | 17/4864 | 26/18723 | 2.77e-05 | 3.11e-04 | 17 |
| GO:003406317 | Thyroid | PTC | stress granule assembly | 21/5968 | 26/18723 | 3.95e-07 | 6.55e-06 | 21 |
| GO:0048872113 | Thyroid | PTC | homeostasis of number of cells | 125/5968 | 272/18723 | 7.25e-07 | 1.14e-05 | 125 |
| GO:00614841 | Thyroid | PTC | hematopoietic stem cell homeostasis | 11/5968 | 18/18723 | 1.00e-02 | 4.07e-02 | 11 |
| GO:0048872210 | Thyroid | ATC | homeostasis of number of cells | 135/6293 | 272/18723 | 2.92e-08 | 5.50e-07 | 135 |
| Hugo Symbol | Variant Class | Variant Classification | dbSNP RS | HGVSc | HGVSp | HGVSp Short | SWISSPROT | BIOTYPE | SIFT | PolyPhen | Tumor Sample Barcode | Tissue | Histology | Sex | Age | Stage | Therapy Types | Drugs | Outcome |
| UBAP2 | SNV | Missense_Mutation | | c.560N>T | p.Ser187Leu | p.S187L | Q5T6F2 | protein_coding | deleterious(0) | probably_damaging(0.997) | TCGA-A2-A0CX-01 | Breast | breast invasive carcinoma | Female | <65 | I/II | Chemotherapy | adriamycin | SD |
| UBAP2 | SNV | Missense_Mutation | | c.1852N>C | p.Asp618His | p.D618H | Q5T6F2 | protein_coding | deleterious(0) | probably_damaging(0.987) | TCGA-A7-A13F-01 | Breast | breast invasive carcinoma | Female | <65 | III/IV | Chemotherapy | doxorubicin | SD |
| UBAP2 | SNV | Missense_Mutation | | c.558N>G | p.Phe186Leu | p.F186L | Q5T6F2 | protein_coding | deleterious(0.04) | benign(0.261) | TCGA-AC-A23H-01 | Breast | breast invasive carcinoma | Female | >=65 | I/II | Unknown | Unknown | PD |
| UBAP2 | insertion | Frame_Shift_Ins | novel | c.2976_2977insTTTTATT | p.Lys993PhefsTer3 | p.K993Ffs*3 | Q5T6F2 | protein_coding | | | TCGA-A8-A09C-01 | Breast | breast invasive carcinoma | Female | >=65 | I/II | Unknown | Unknown | SD |
| UBAP2 | insertion | Nonsense_Mutation | novel | c.2975_2976insAAGGTAAGTGTCTACAGGTAAAATTAGGA | p.Asn992LysfsTer3 | p.N992Kfs*3 | Q5T6F2 | protein_coding | | | TCGA-A8-A09C-01 | Breast | breast invasive carcinoma | Female | >=65 | I/II | Unknown | Unknown | SD |
| UBAP2 | insertion | Nonsense_Mutation | novel | c.578_579insGTGAATAATTG | p.Phe194Ter | p.F194* | Q5T6F2 | protein_coding | | | TCGA-A8-A09D-01 | Breast | breast invasive carcinoma | Female | <65 | I/II | Chemotherapy | doxorubicin | CR |
| UBAP2 | insertion | Frame_Shift_Ins | novel | c.577_578insGATCATCAAGGGAAGGTGAGAA | p.Thr193ArgfsTer10 | p.T193Rfs*10 | Q5T6F2 | protein_coding | | | TCGA-A8-A09D-01 | Breast | breast invasive carcinoma | Female | <65 | I/II | Chemotherapy | doxorubicin | CR |
| UBAP2 | insertion | Nonsense_Mutation | novel | c.2798_2799insGTGAACCTAGGAGGCGGAGCTTGCAGTGAGCCGAGATCTCGCC | p.Pro934Ter | p.P934* | Q5T6F2 | protein_coding | | | TCGA-AO-A0JF-01 | Breast | breast invasive carcinoma | Female | >=65 | I/II | Chemotherapy | doxorubicin | SD |
| UBAP2 | deletion | Frame_Shift_Del | novel | c.2287_2299delNNNNNNNNNNNNN | p.Asn763AlafsTer22 | p.N763Afs*22 | Q5T6F2 | protein_coding | | | TCGA-B6-A3ZX-01 | Breast | breast invasive carcinoma | Female | <65 | III/IV | Chemotherapy | cyclophosphamide | PD |
| UBAP2 | insertion | In_Frame_Ins | novel | c.2748_2749insCCC | p.Pro916dup | p.P916dup | Q5T6F2 | protein_coding | | | TCGA-D8-A1JF-01 | Breast | breast invasive carcinoma | Female | >=65 | III/IV | Unknown | Unknown | SD |


