
|
|||||
|
 | |
| |
| |
| |
| |
| |
|
Gene: UBAP1 |
Gene summary for UBAP1 |
| Gene information | Species | Human | Gene symbol | UBAP1 | Gene ID | 51271 |
| Gene name | ubiquitin associated protein 1 | |
| Gene Alias | NAG20 | |
| Cytomap | 9p13.3 | |
| Gene Type | protein-coding | GO ID | GO:0006508 | UniProtAcc | Q9NZ09 |
Top |
Malignant transformation analysis |
| Identification of the aberrant gene expression in precancerous and cancerous lesions by comparing the gene expression of stem-like cells in diseased tissues with normal stem cells |
| Entrez ID | Symbol | Replicates | Species | Organ | Tissue | Adj P-value | Log2FC | Malignancy |
| 51271 | UBAP1 | CCI_1 | Human | Cervix | CC | 4.25e-08 | 6.79e-01 | 0.528 |
| 51271 | UBAP1 | CCI_2 | Human | Cervix | CC | 4.23e-13 | 1.11e+00 | 0.5249 |
| 51271 | UBAP1 | CCI_3 | Human | Cervix | CC | 3.35e-08 | 6.44e-01 | 0.516 |
| 51271 | UBAP1 | AEH-subject1 | Human | Endometrium | AEH | 5.33e-16 | 4.97e-01 | -0.3059 |
| 51271 | UBAP1 | AEH-subject2 | Human | Endometrium | AEH | 1.69e-06 | 3.21e-01 | -0.2525 |
| 51271 | UBAP1 | AEH-subject3 | Human | Endometrium | AEH | 1.86e-07 | 3.30e-01 | -0.2576 |
| 51271 | UBAP1 | AEH-subject4 | Human | Endometrium | AEH | 6.94e-15 | 5.30e-01 | -0.2657 |
| 51271 | UBAP1 | AEH-subject5 | Human | Endometrium | AEH | 2.31e-28 | 6.79e-01 | -0.2953 |
| 51271 | UBAP1 | EEC-subject1 | Human | Endometrium | EEC | 3.23e-12 | 4.61e-01 | -0.2682 |
| 51271 | UBAP1 | EEC-subject2 | Human | Endometrium | EEC | 3.77e-05 | 2.96e-01 | -0.2607 |
| 51271 | UBAP1 | EEC-subject3 | Human | Endometrium | EEC | 3.17e-04 | 2.05e-01 | -0.2525 |
| 51271 | UBAP1 | EEC-subject4 | Human | Endometrium | EEC | 2.44e-05 | 2.89e-01 | -0.2571 |
| 51271 | UBAP1 | EEC-subject5 | Human | Endometrium | EEC | 3.01e-17 | 5.00e-01 | -0.249 |
| 51271 | UBAP1 | GSM5276934 | Human | Endometrium | EEC | 6.09e-04 | 2.47e-01 | -0.0913 |
| 51271 | UBAP1 | GSM5276937 | Human | Endometrium | EEC | 7.12e-07 | 3.38e-01 | -0.0897 |
| 51271 | UBAP1 | GSM6177620_NYU_UCEC1_lib1_lib1 | Human | Endometrium | EEC | 5.18e-09 | 6.82e-02 | -0.1869 |
| 51271 | UBAP1 | GSM6177620_NYU_UCEC1_lib2_lib2 | Human | Endometrium | EEC | 3.11e-04 | 2.74e-02 | -0.1875 |
| 51271 | UBAP1 | GSM6177620_NYU_UCEC1_lib3_lib3 | Human | Endometrium | EEC | 1.59e-07 | 4.00e-03 | -0.1883 |
| 51271 | UBAP1 | GSM6177622_NYU_UCEC3_lib1_lib1 | Human | Endometrium | EEC | 4.20e-03 | -3.34e-02 | -0.1917 |
| 51271 | UBAP1 | GSM6177622_NYU_UCEC3_lib2_lib2 | Human | Endometrium | EEC | 4.32e-08 | -4.95e-03 | -0.1916 |
| Page: 1 2 3 4 5 6 7 8 |
| Tissue | Expression Dynamics | Abbreviation |
| Cervix |  | CC: Cervix cancer |
| HSIL_HPV: HPV-infected high-grade squamous intraepithelial lesions | ||
| N_HPV: HPV-infected normal cervix | ||
| Endometrium | 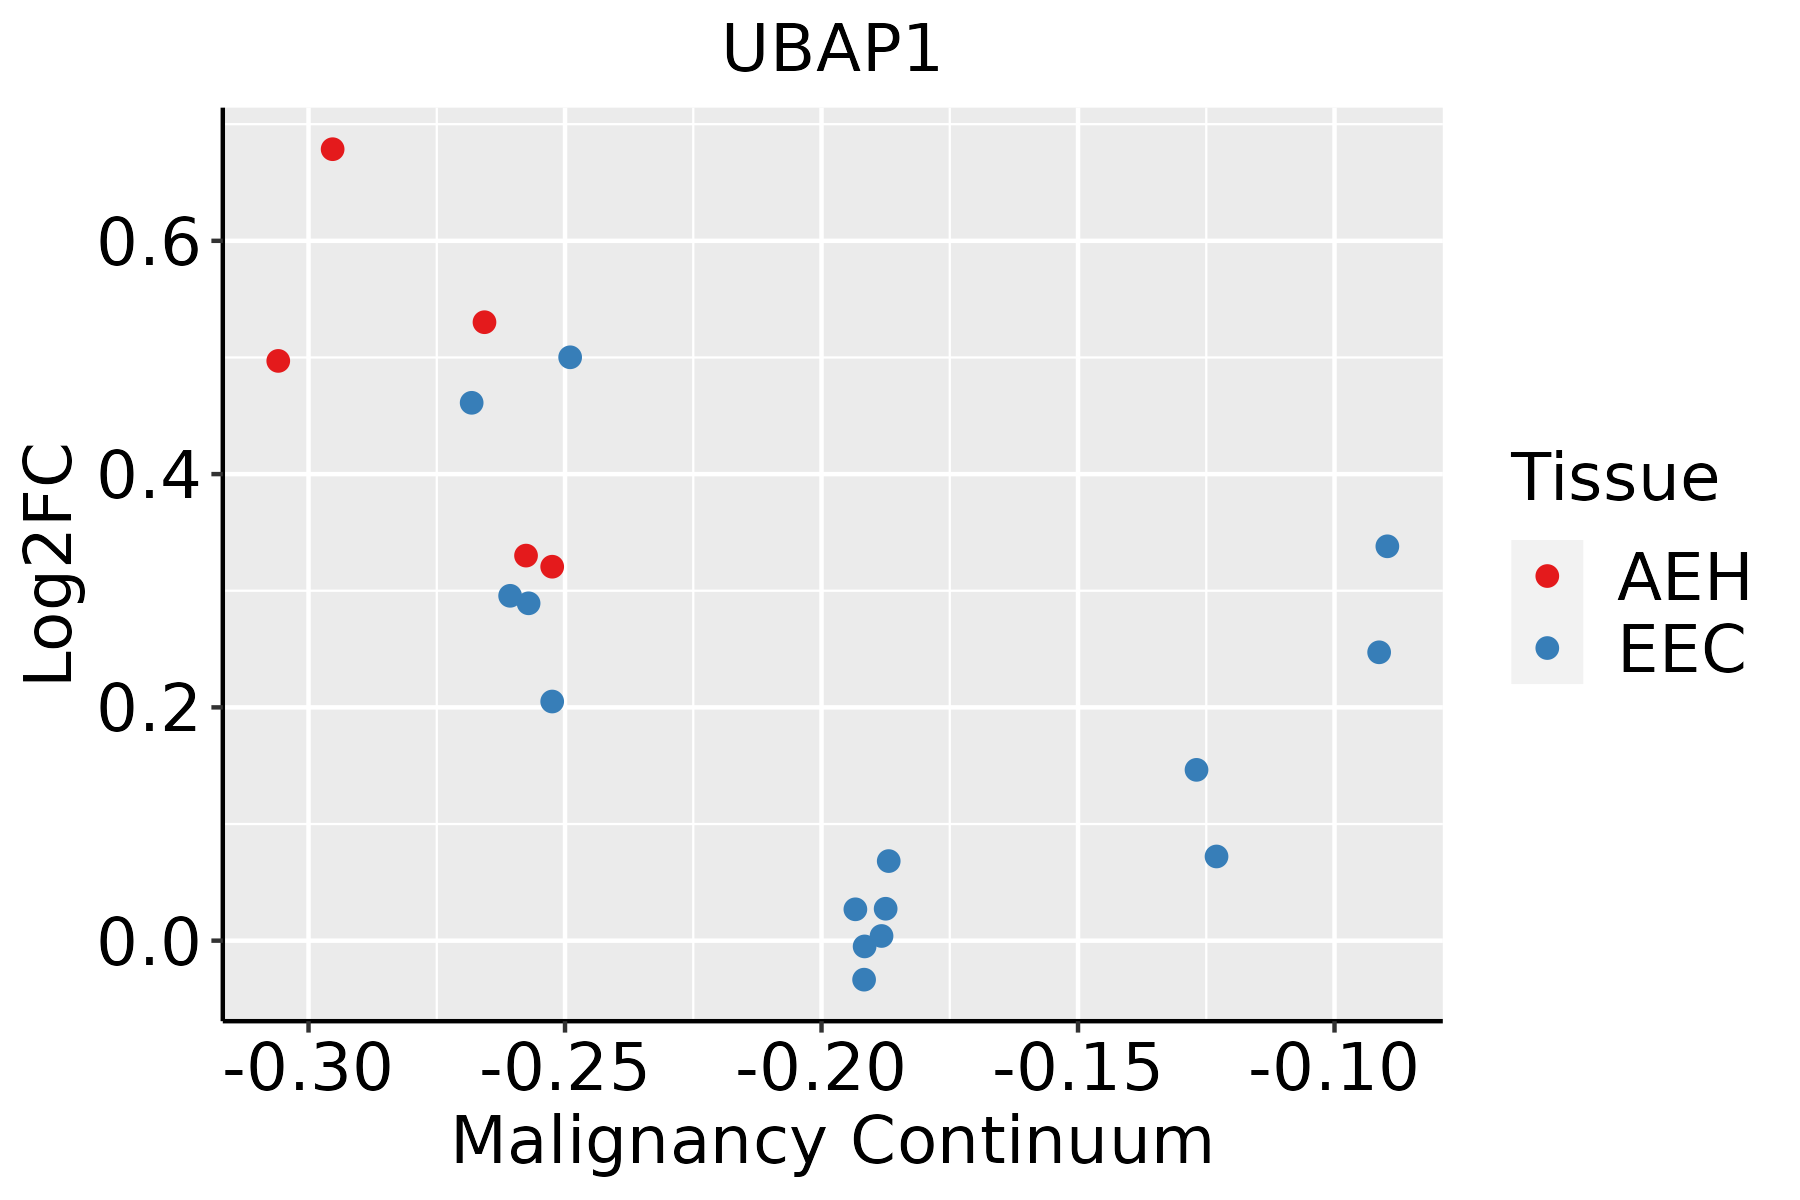 | AEH: Atypical endometrial hyperplasia |
| EEC: Endometrioid Cancer | ||
| Esophagus |  | ESCC: Esophageal squamous cell carcinoma |
| HGIN: High-grade intraepithelial neoplasias | ||
| LGIN: Low-grade intraepithelial neoplasias | ||
| Lung | 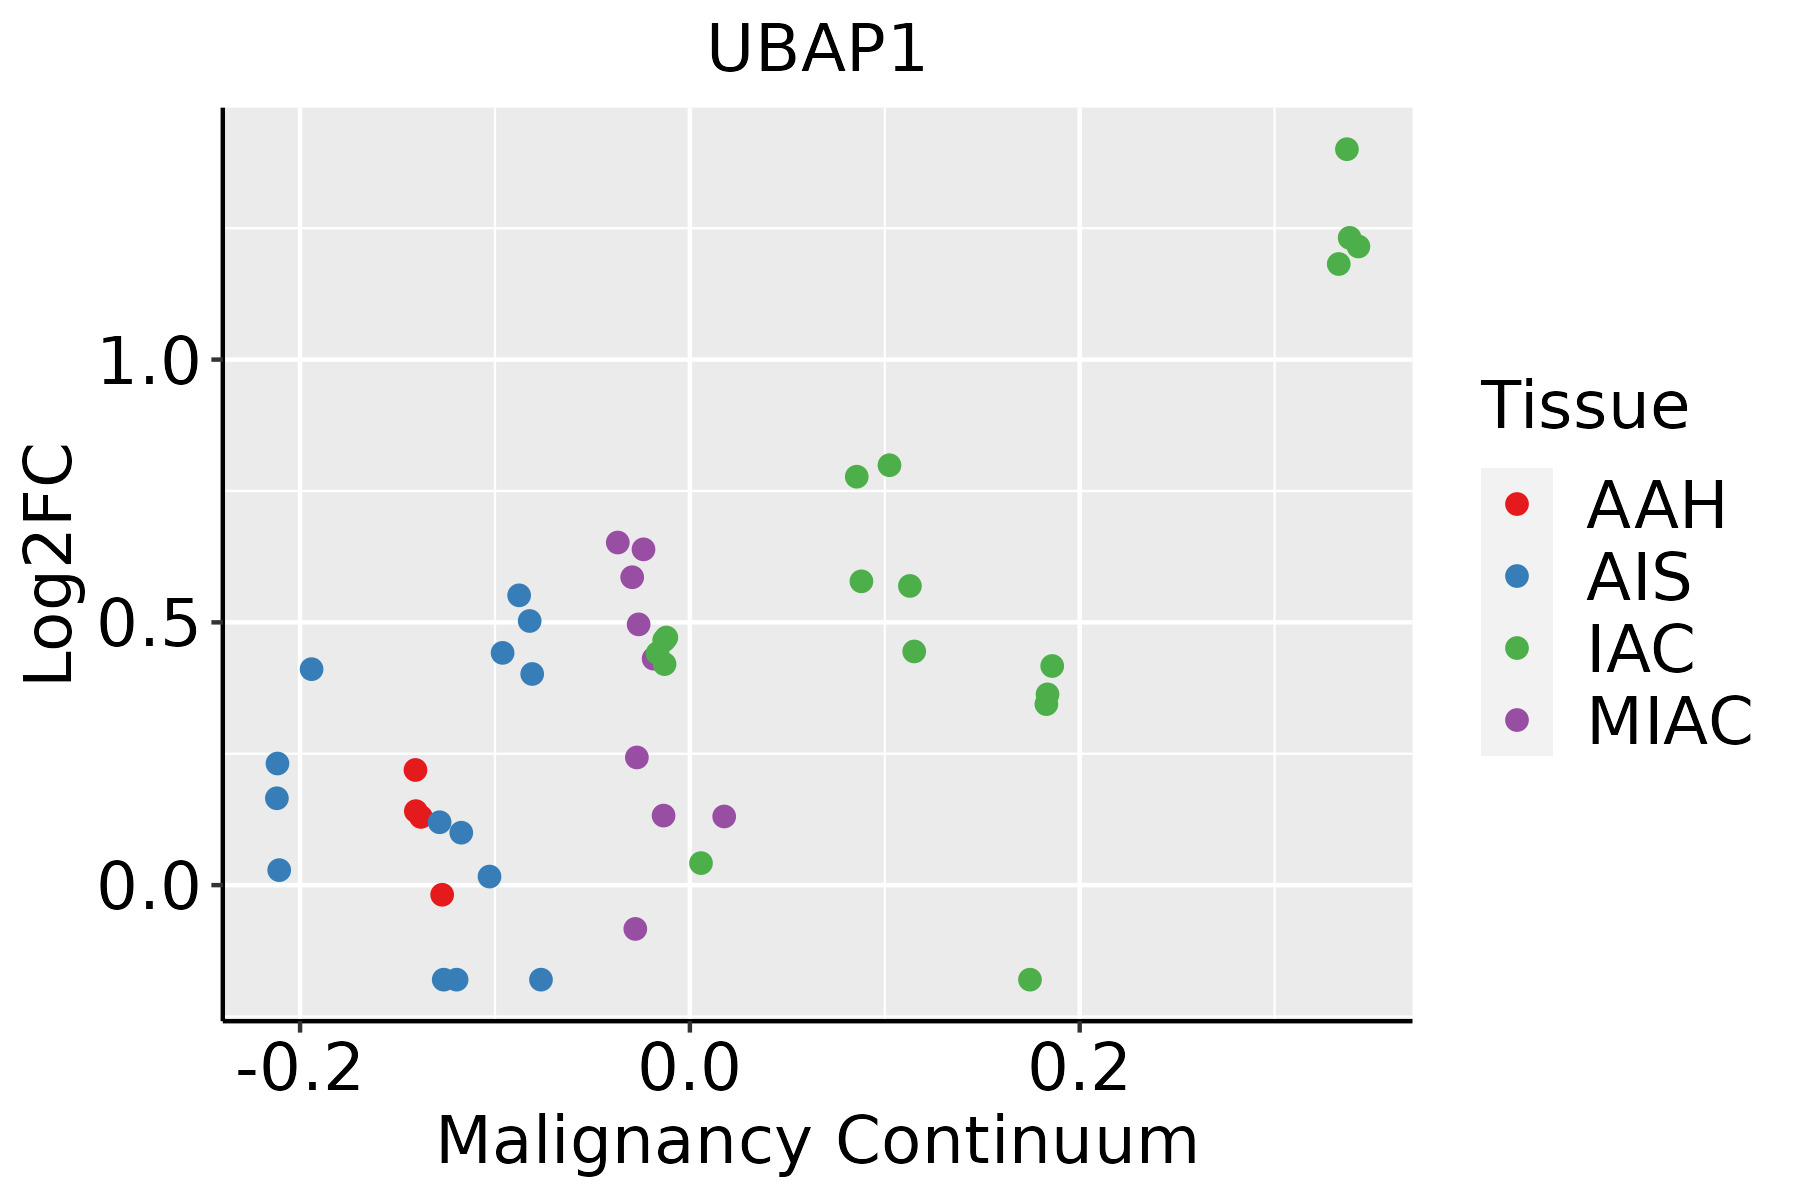 | AAH: Atypical adenomatous hyperplasia |
| AIS: Adenocarcinoma in situ | ||
| IAC: Invasive lung adenocarcinoma | ||
| MIA: Minimally invasive adenocarcinoma | ||
| Oral Cavity | 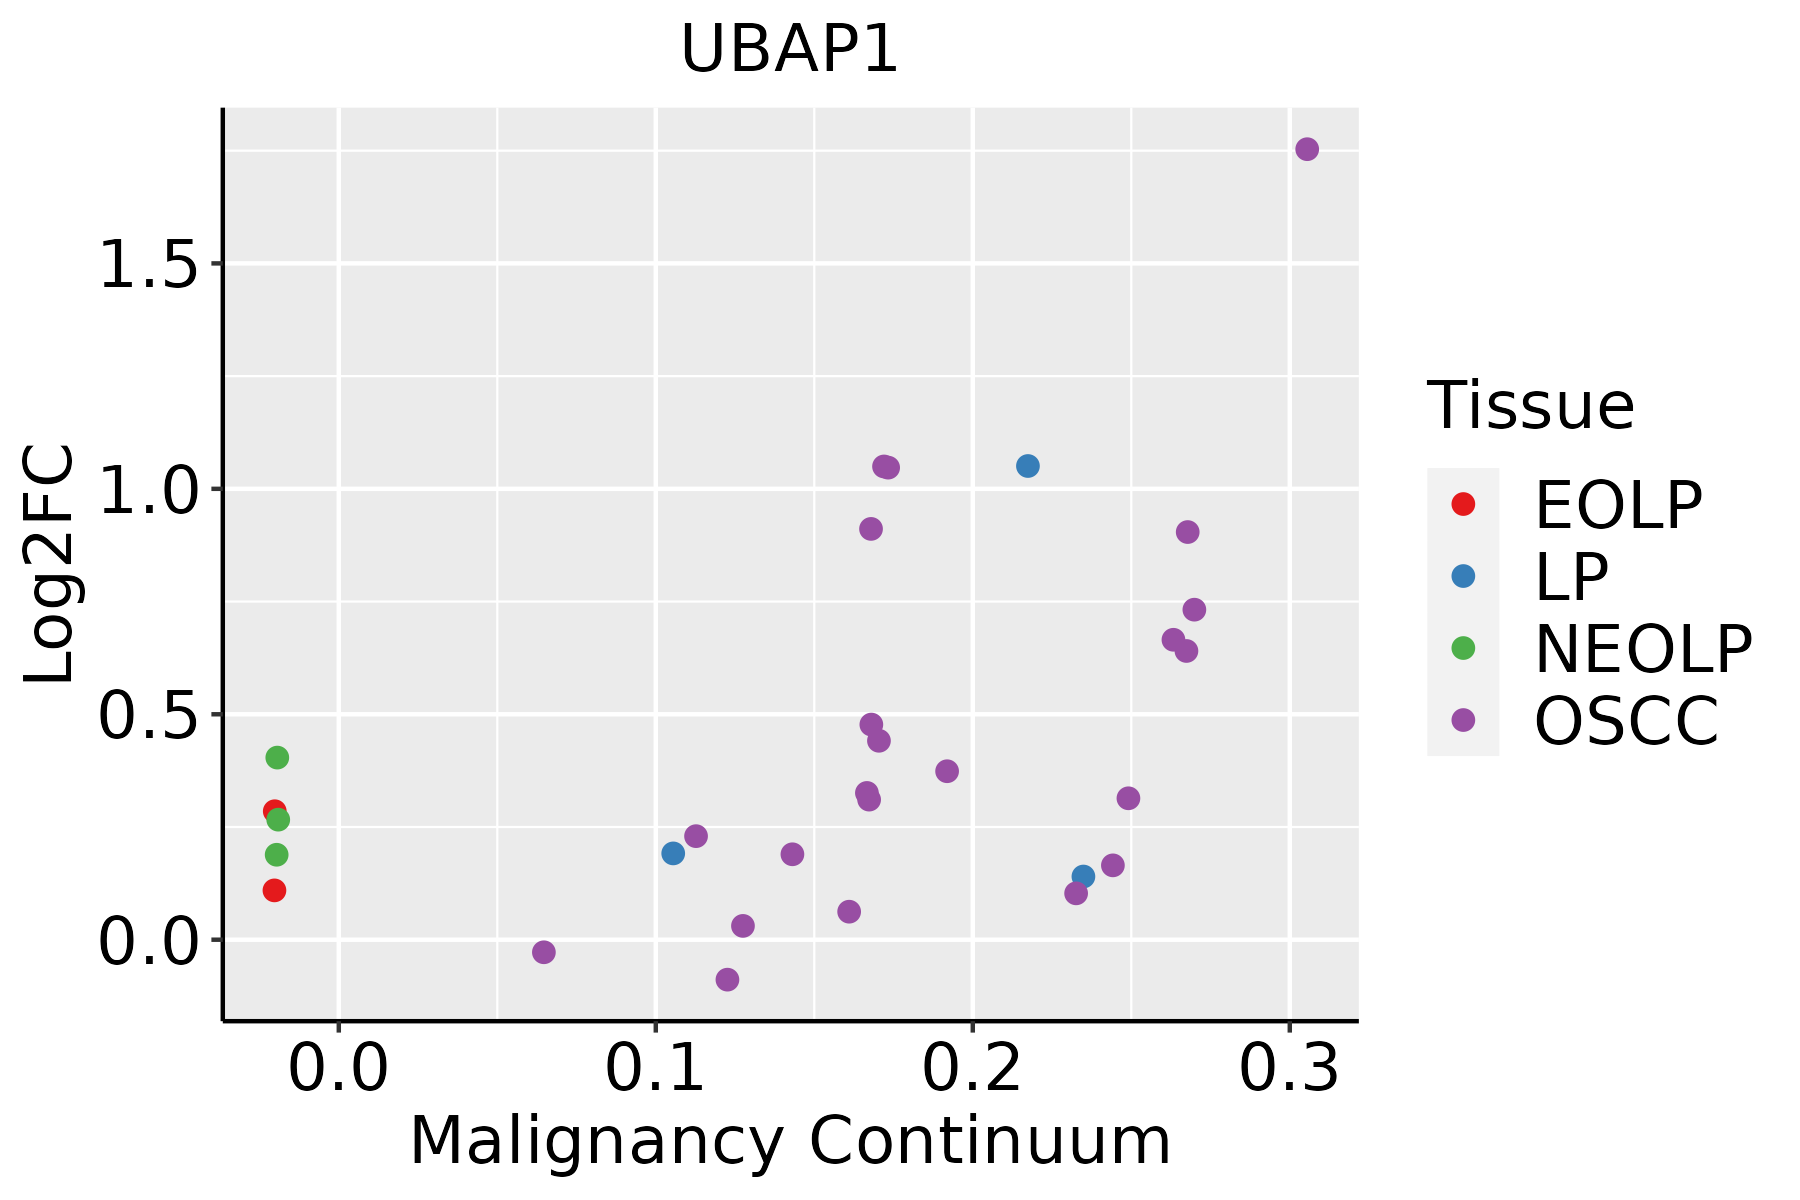 | EOLP: Erosive Oral lichen planus |
| LP: leukoplakia | ||
| NEOLP: Non-erosive oral lichen planus | ||
| OSCC: Oral squamous cell carcinoma | ||
| Prostate | 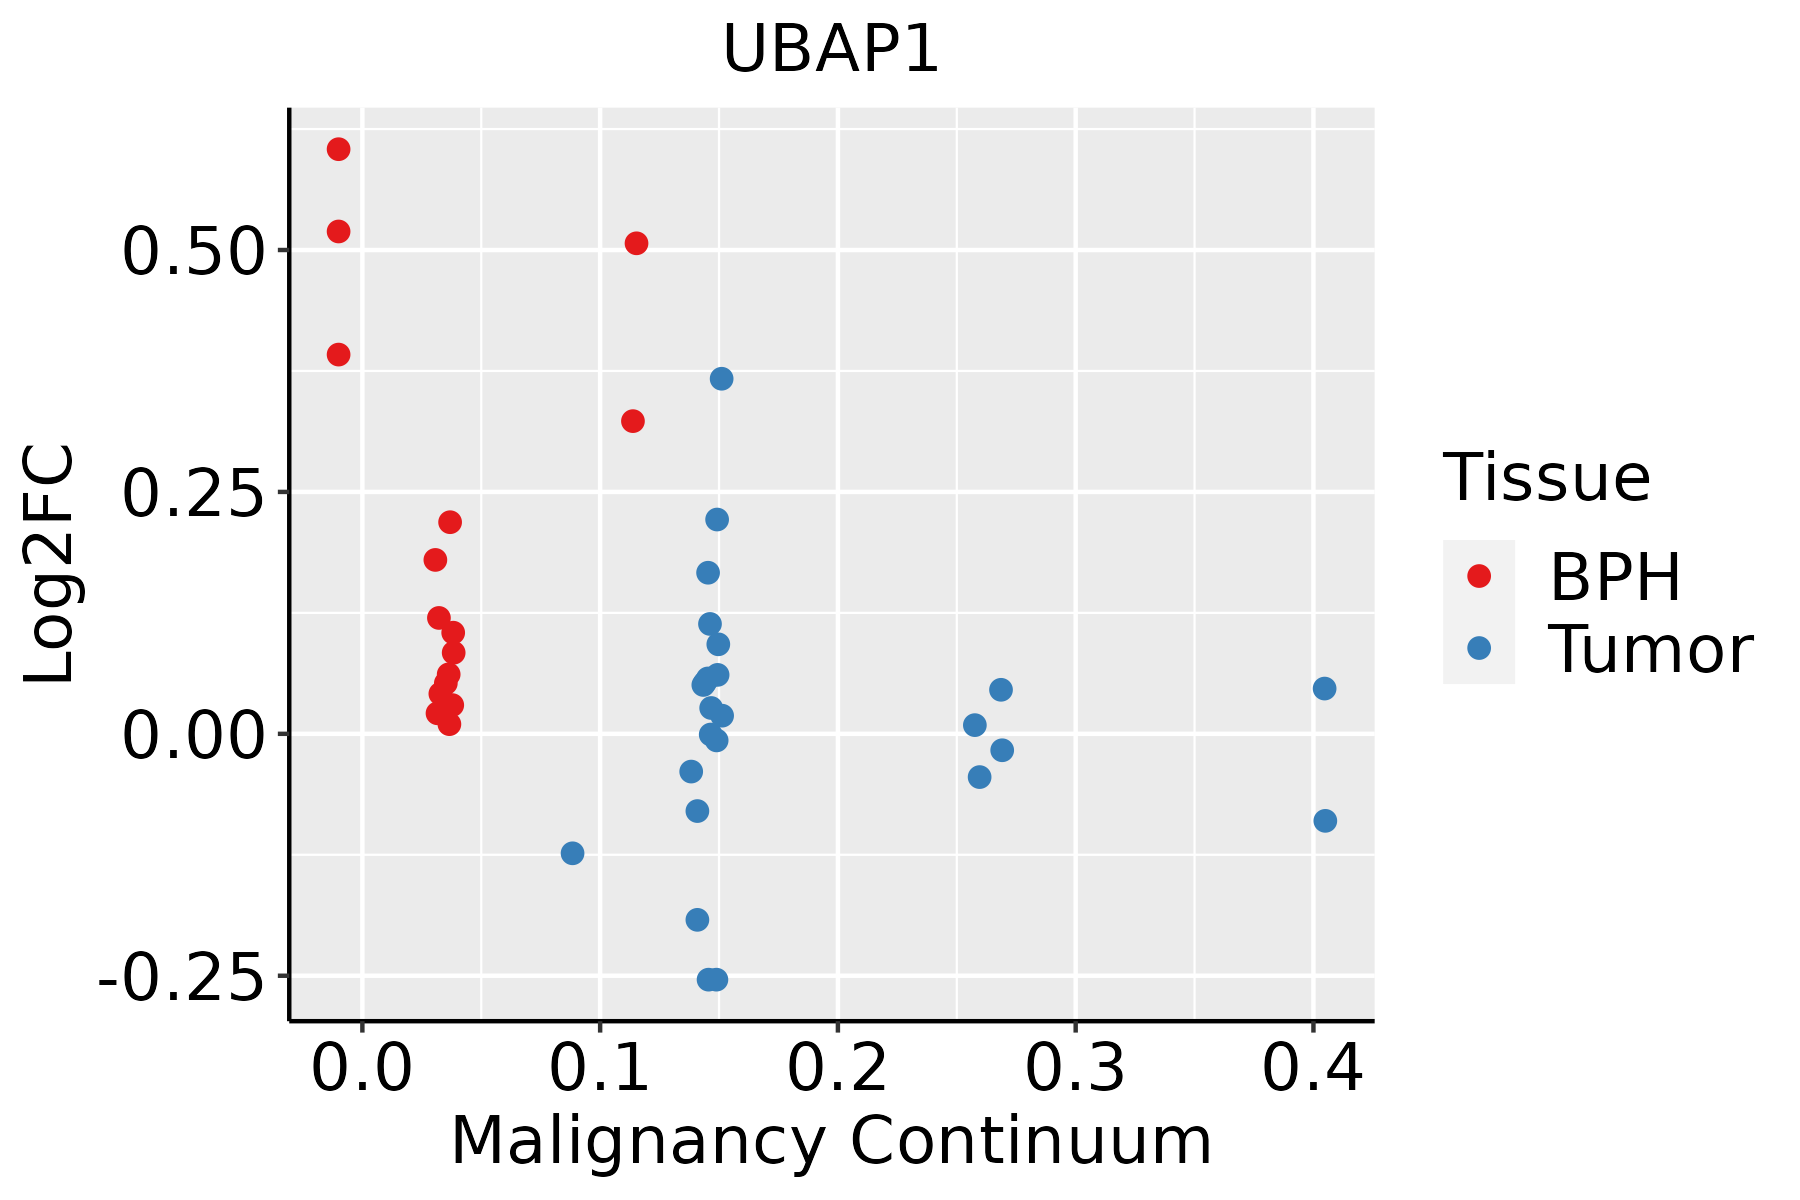 | BPH: Benign Prostatic Hyperplasia |
| Skin |  | AK: Actinic keratosis |
| cSCC: Cutaneous squamous cell carcinoma | ||
| SCCIS:squamous cell carcinoma in situ |
| ∗log2FC in expression of this searched gene in stem-like cells from each diseased tissue sample relative to stem-like cells in normal samples in each tissue plotted against the malignancy continuum. Samples are colored based on if they are from different disease stage. |
Top |
Malignant transformation related pathway analysis |
| Find out the enriched GO biological processes and KEGG pathways involved in transition from healthy to precancer to cancer |
| Tissue | Disease Stage | Enriched GO biological Processes |
| Colorectum | AD |  |
| Colorectum | SER |  |
| Colorectum | MSS |  |
| Colorectum | MSI-H |  |
| Colorectum | FAP |  |
| ∗Top 15 enriched GO BP terms are showed in the bar plot of each disease state in each tissue. Each row represents a significant GO biological process which is colored according to the -log10(p.adjust). |
| Page: 1 2 3 4 5 6 7 8 9 |
| GO ID | Tissue | Disease Stage | Description | Gene Ratio | Bg Ratio | pvalue | p.adjust | Count |
| GO:00431623 | Esophagus | ESCC | ubiquitin-dependent protein catabolic process via the multivesicular body sorting pathway | 19/8552 | 23/18723 | 3.12e-04 | 1.85e-03 | 19 |
| GO:00431622 | Oral cavity | OSCC | ubiquitin-dependent protein catabolic process via the multivesicular body sorting pathway | 17/7305 | 23/18723 | 7.28e-04 | 3.98e-03 | 17 |
| GO:004316211 | Oral cavity | LP | ubiquitin-dependent protein catabolic process via the multivesicular body sorting pathway | 13/4623 | 23/18723 | 1.09e-03 | 9.03e-03 | 13 |
| GO:00431624 | Skin | cSCC | ubiquitin-dependent protein catabolic process via the multivesicular body sorting pathway | 14/4864 | 23/18723 | 4.32e-04 | 3.34e-03 | 14 |
| Page: 1 |
| Pathway ID | Tissue | Disease Stage | Description | Gene Ratio | Bg Ratio | pvalue | p.adjust | qvalue | Count |
| Page: 1 |
Top |
Cell-cell communication analysis |
| Identification of potential cell-cell interactions between two cell types and their ligand-receptor pairs for different disease states |
| Ligand | Receptor | LRpair | Pathway | Tissue | Disease Stage |
| Page: 1 |
Top |
Single-cell gene regulatory network inference analysis |
| Find out the significant the regulons (TFs) and the target genes of each regulon across cell types for different disease states |
| TF | Cell Type | Tissue | Disease Stage | Target Gene | RSS | Regulon Activity |
| ∗The dot plots of a searched regulon are shown for all cell subpopulations in each disease state of each tissue based on the regulon specific score inferred using pySCENIC and by calculating the average expression. |
| Page: 1 |
Top |
Somatic mutation of malignant transformation related genes |
| Annotation of somatic variants for genes involved in malignant transformation |
| Hugo Symbol | Variant Class | Variant Classification | dbSNP RS | HGVSc | HGVSp | HGVSp Short | SWISSPROT | BIOTYPE | SIFT | PolyPhen | Tumor Sample Barcode | Tissue | Histology | Sex | Age | Stage | Therapy Types | Drugs | Outcome |
| UBAP1 | SNV | Missense_Mutation | novel | c.978T>A | p.Asn326Lys | p.N326K | Q9NZ09 | protein_coding | deleterious(0) | possibly_damaging(0.884) | TCGA-A8-A08H-01 | Breast | breast invasive carcinoma | Female | >=65 | I/II | Unknown | Unknown | SD |
| UBAP1 | SNV | Missense_Mutation | c.224N>T | p.Ser75Leu | p.S75L | Q9NZ09 | protein_coding | deleterious(0.02) | benign(0.349) | TCGA-AC-A23H-01 | Breast | breast invasive carcinoma | Female | >=65 | I/II | Unknown | Unknown | PD | |
| UBAP1 | SNV | Missense_Mutation | c.533N>T | p.Pro178Leu | p.P178L | Q9NZ09 | protein_coding | tolerated(0.05) | possibly_damaging(0.864) | TCGA-C8-A12Q-01 | Breast | breast invasive carcinoma | Female | >=65 | III/IV | Unknown | Unknown | PD | |
| UBAP1 | insertion | In_Frame_Ins | novel | c.780_781insCAACCTGTTCATCATAATCTAATAGATAGTGGTTTAAGA | p.Leu260_Asp261insGlnProValHisHisAsnLeuIleAspSerGlyLeuArg | p.L260_D261insQPVHHNLIDSGLR | Q9NZ09 | protein_coding | TCGA-A2-A0EO-01 | Breast | breast invasive carcinoma | Female | <65 | I/II | Hormone Therapy | tamoxiphen | SD | ||
| UBAP1 | insertion | Frame_Shift_Ins | novel | c.1097_1098insGATTAAGAAAATCGAAGAAGCCGAGCGGGAAGCAGAGTGCA | p.Lys367IlefsTer36 | p.K367Ifs*36 | Q9NZ09 | protein_coding | TCGA-A2-A0EY-01 | Breast | breast invasive carcinoma | Female | <65 | I/II | Chemotherapy | adriamycin | SD | ||
| UBAP1 | insertion | Frame_Shift_Ins | novel | c.1699_1700insCTAGAGACTTTGGGATAGAGTTAGCTCCAAAGTGG | p.Ter567SerfsTer50 | p.*567Sfs*50 | Q9NZ09 | protein_coding | TCGA-A8-A07J-01 | Breast | breast invasive carcinoma | Female | <65 | I/II | Chemotherapy | 5-fluorouracil | CR | ||
| UBAP1 | insertion | Frame_Shift_Ins | novel | c.980_981insTGCGGAAGCAGAAGCTAAAGTGAATTCTAAGAGTGGCC | p.Lys328AlafsTer52 | p.K328Afs*52 | Q9NZ09 | protein_coding | TCGA-A8-A08H-01 | Breast | breast invasive carcinoma | Female | >=65 | I/II | Unknown | Unknown | SD | ||
| UBAP1 | insertion | Frame_Shift_Ins | novel | c.576_577insCTCAATTTCTTCATCTGTAAAGGGAGGATGAGGATGATTAGCTTTTA | p.Ile193LeufsTer16 | p.I193Lfs*16 | Q9NZ09 | protein_coding | TCGA-A8-A09E-01 | Breast | breast invasive carcinoma | Female | >=65 | III/IV | Hormone Therapy | anastrozole | SD | ||
| UBAP1 | insertion | Frame_Shift_Ins | novel | c.588_589insTCCC | p.Thr197SerfsTer7 | p.T197Sfs*7 | Q9NZ09 | protein_coding | TCGA-A8-A0AB-01 | Breast | breast invasive carcinoma | Female | <65 | I/II | Chemotherapy | 5-fluorouracil | CR | ||
| UBAP1 | insertion | In_Frame_Ins | novel | c.590_591insACGCCTTAAATGCTGCCT | p.Arg198_Val199insLeuLysCysCysLeuArg | p.R198_V199insLKCCLR | Q9NZ09 | protein_coding | TCGA-A8-A0AB-01 | Breast | breast invasive carcinoma | Female | <65 | I/II | Chemotherapy | 5-fluorouracil | CR |
| Page: 1 2 3 4 5 6 7 |
Top |
Related drugs of malignant transformation related genes |
| Identification of chemicals and drugs interact with genes involved in malignant transfromation |
| (DGIdb 4.0) |
| Entrez ID | Symbol | Category | Interaction Types | Drug Claim Name | Drug Name | PMIDs |
| Page: 1 |

Copyright 2023-Present -The University of Texas Health Science Center at Houston |