
|
|||||
|
 | |
| |
| |
| |
| |
| |
|
Gene: UBAC1 |
Gene summary for UBAC1 |
| Gene information | Species | Human | Gene symbol | UBAC1 | Gene ID | 10422 |
| Gene name | UBA domain containing 1 | |
| Gene Alias | GBDR1 | |
| Cytomap | 9q34.3 | |
| Gene Type | protein-coding | GO ID | GO:0006464 | UniProtAcc | A0A140VK64 |
Top |
Malignant transformation analysis |
| Identification of the aberrant gene expression in precancerous and cancerous lesions by comparing the gene expression of stem-like cells in diseased tissues with normal stem cells |
| Entrez ID | Symbol | Replicates | Species | Organ | Tissue | Adj P-value | Log2FC | Malignancy |
| 10422 | UBAC1 | HTA11_347_2000001011 | Human | Colorectum | AD | 2.90e-04 | 2.90e-01 | -0.1954 |
| 10422 | UBAC1 | HTA11_83_2000001011 | Human | Colorectum | SER | 7.48e-05 | 3.75e-01 | -0.1526 |
| 10422 | UBAC1 | HTA11_7469_2000001011 | Human | Colorectum | AD | 1.32e-02 | 5.05e-01 | -0.0124 |
| 10422 | UBAC1 | A014-C-008 | Human | Colorectum | FAP | 3.72e-02 | -2.00e-01 | -0.191 |
| 10422 | UBAC1 | LZE2T | Human | Esophagus | ESCC | 3.66e-07 | 7.36e-01 | 0.082 |
| 10422 | UBAC1 | LZE4T | Human | Esophagus | ESCC | 1.36e-05 | 2.08e-01 | 0.0811 |
| 10422 | UBAC1 | LZE7T | Human | Esophagus | ESCC | 7.43e-03 | 2.53e-01 | 0.0667 |
| 10422 | UBAC1 | LZE8T | Human | Esophagus | ESCC | 6.14e-05 | 2.36e-01 | 0.067 |
| 10422 | UBAC1 | LZE20T | Human | Esophagus | ESCC | 1.71e-12 | 5.04e-01 | 0.0662 |
| 10422 | UBAC1 | LZE22T | Human | Esophagus | ESCC | 2.53e-02 | 3.84e-01 | 0.068 |
| 10422 | UBAC1 | LZE24T | Human | Esophagus | ESCC | 6.84e-06 | 2.42e-01 | 0.0596 |
| 10422 | UBAC1 | LZE21T | Human | Esophagus | ESCC | 2.47e-05 | 4.66e-01 | 0.0655 |
| 10422 | UBAC1 | LZE6T | Human | Esophagus | ESCC | 2.17e-03 | 3.56e-01 | 0.0845 |
| 10422 | UBAC1 | P1T-E | Human | Esophagus | ESCC | 1.83e-17 | 6.69e-01 | 0.0875 |
| 10422 | UBAC1 | P2T-E | Human | Esophagus | ESCC | 2.37e-27 | 5.09e-01 | 0.1177 |
| 10422 | UBAC1 | P4T-E | Human | Esophagus | ESCC | 7.28e-22 | 5.43e-01 | 0.1323 |
| 10422 | UBAC1 | P5T-E | Human | Esophagus | ESCC | 3.56e-27 | 4.95e-01 | 0.1327 |
| 10422 | UBAC1 | P8T-E | Human | Esophagus | ESCC | 2.49e-32 | 7.25e-01 | 0.0889 |
| 10422 | UBAC1 | P9T-E | Human | Esophagus | ESCC | 2.13e-20 | 5.01e-01 | 0.1131 |
| 10422 | UBAC1 | P10T-E | Human | Esophagus | ESCC | 4.22e-17 | 1.74e-01 | 0.116 |
| Page: 1 2 3 4 5 6 |
| Tissue | Expression Dynamics | Abbreviation |
| Colorectum (GSE201348) |  | FAP: Familial adenomatous polyposis |
| CRC: Colorectal cancer | ||
| Colorectum (HTA11) |  | AD: Adenomas |
| SER: Sessile serrated lesions | ||
| MSI-H: Microsatellite-high colorectal cancer | ||
| MSS: Microsatellite stable colorectal cancer | ||
| Esophagus | 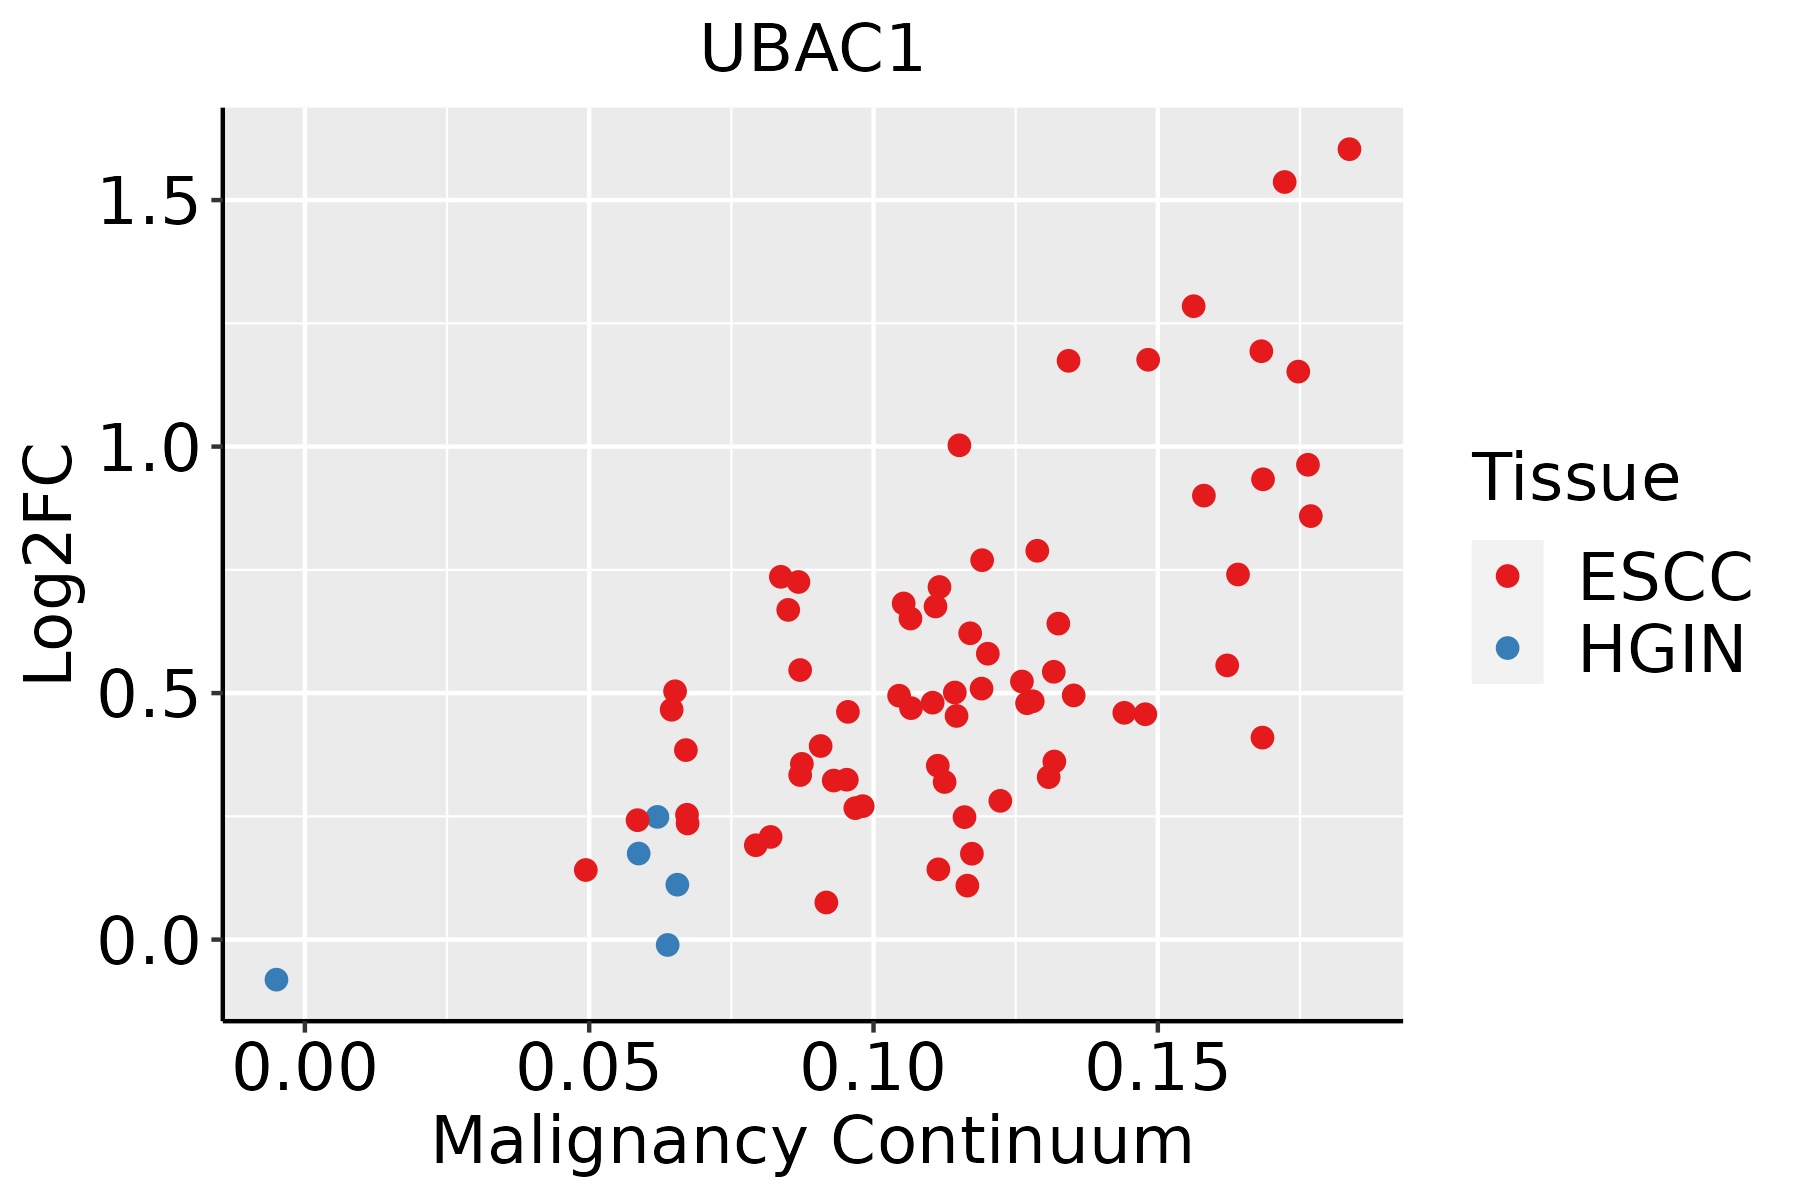 | ESCC: Esophageal squamous cell carcinoma |
| HGIN: High-grade intraepithelial neoplasias | ||
| LGIN: Low-grade intraepithelial neoplasias | ||
| Liver |  | HCC: Hepatocellular carcinoma |
| NAFLD: Non-alcoholic fatty liver disease | ||
| Oral Cavity | 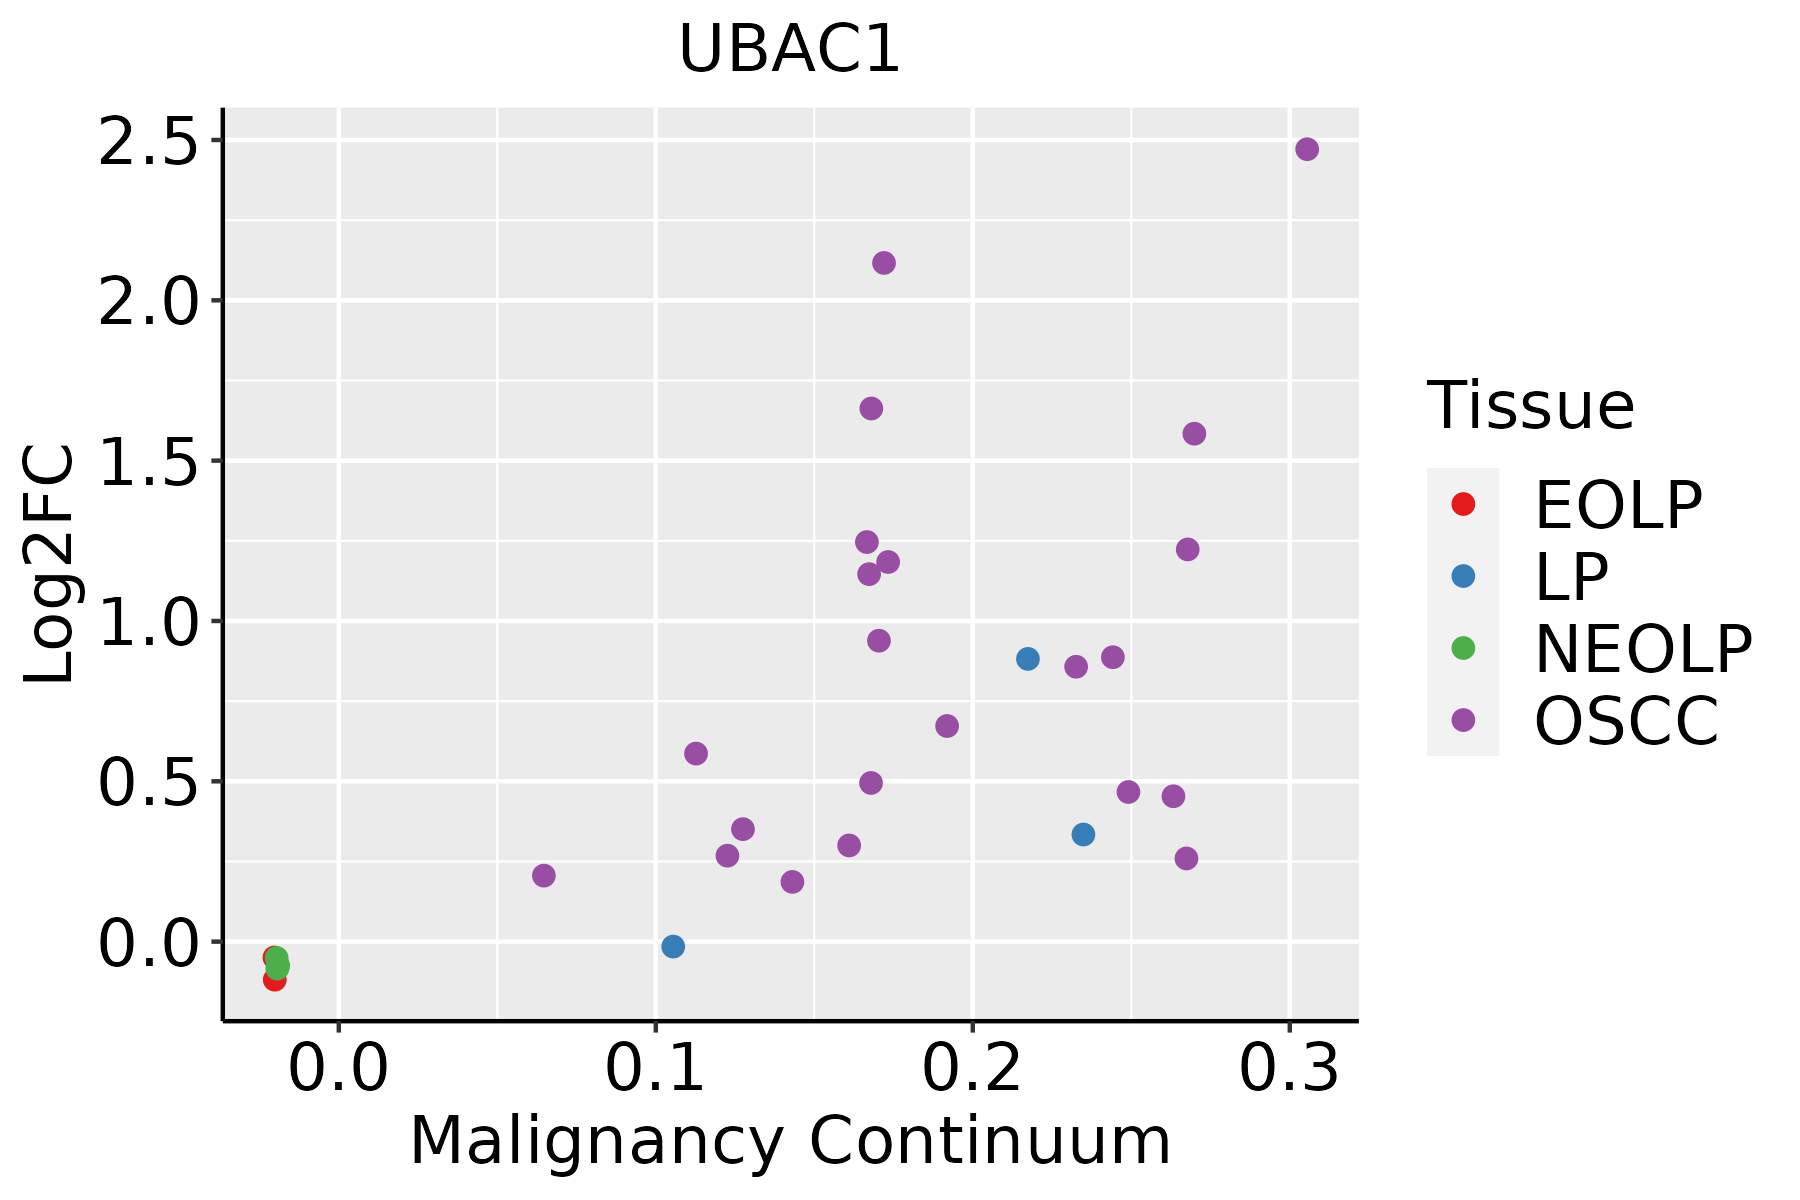 | EOLP: Erosive Oral lichen planus |
| LP: leukoplakia | ||
| NEOLP: Non-erosive oral lichen planus | ||
| OSCC: Oral squamous cell carcinoma | ||
| Skin | 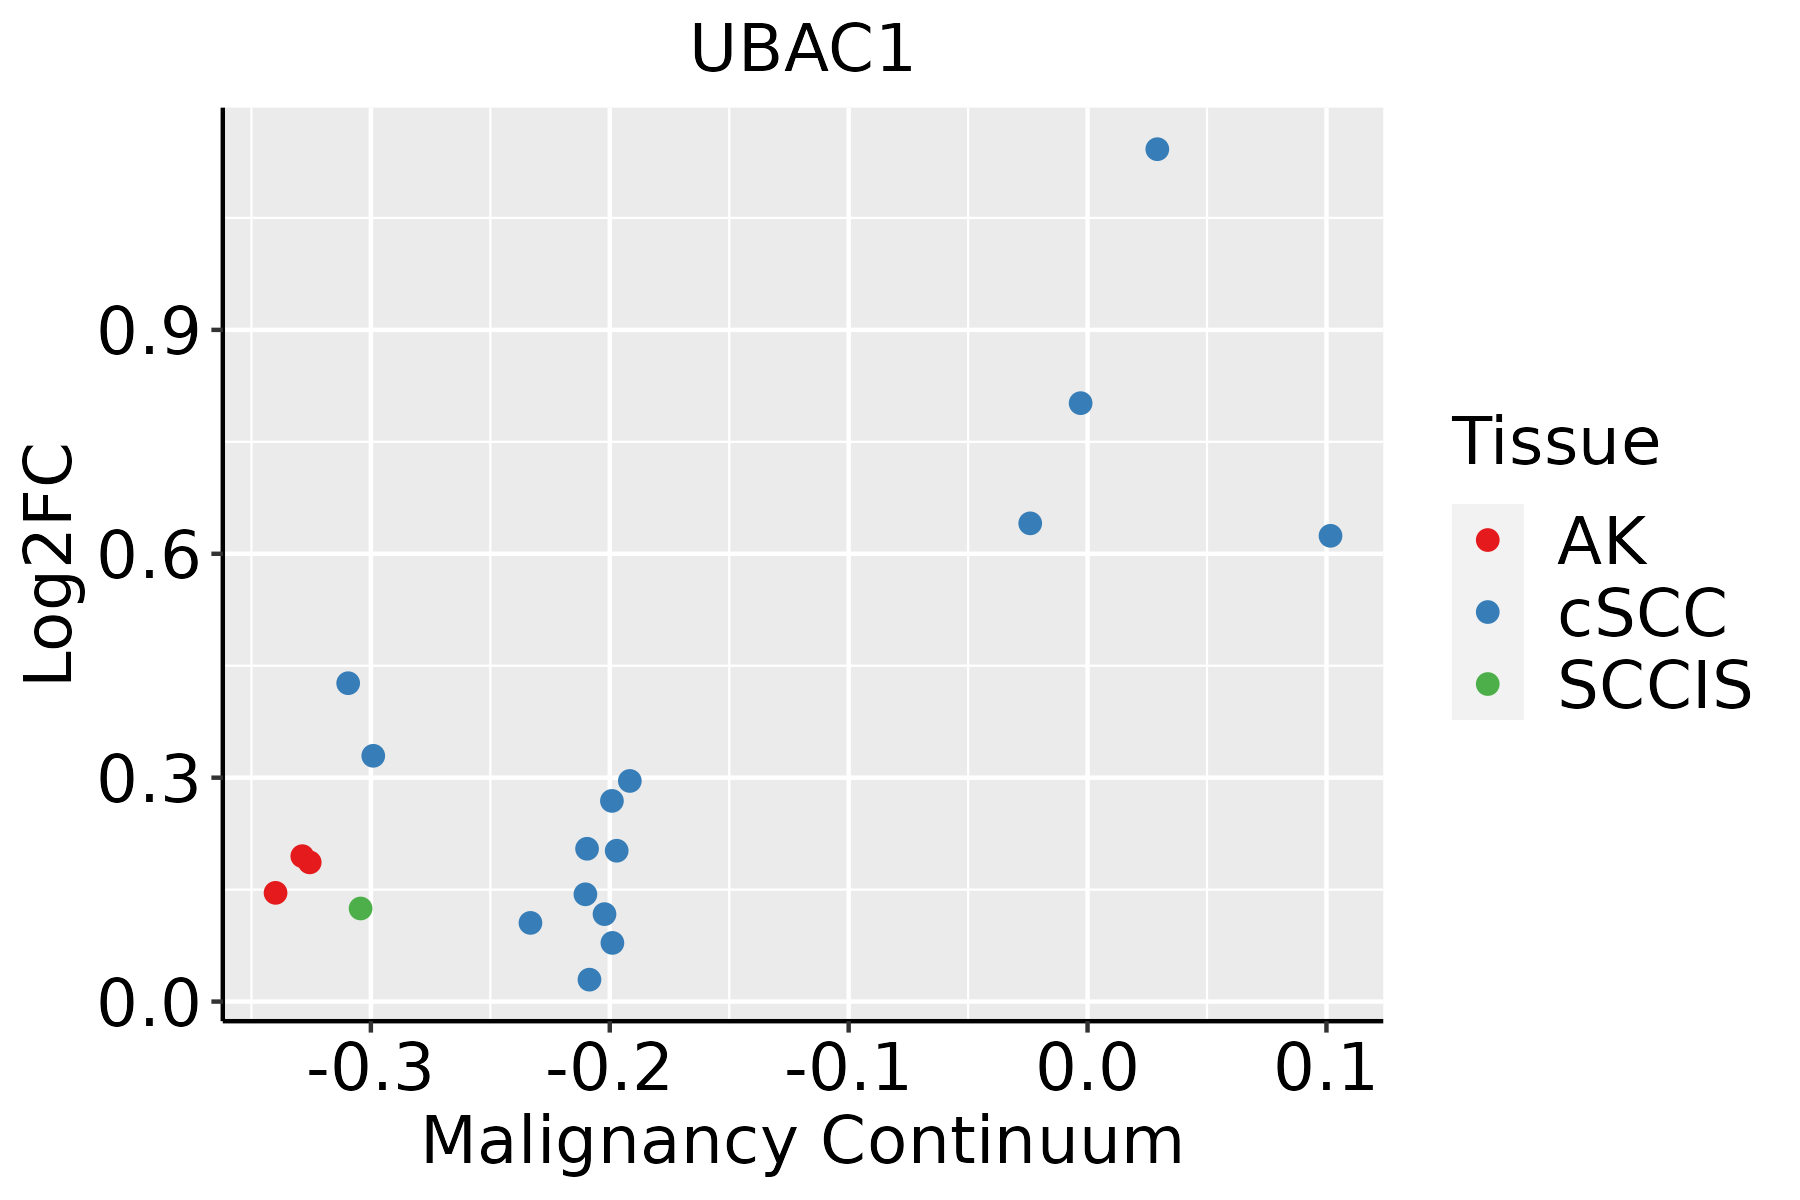 | AK: Actinic keratosis |
| cSCC: Cutaneous squamous cell carcinoma | ||
| SCCIS:squamous cell carcinoma in situ | ||
| Thyroid | 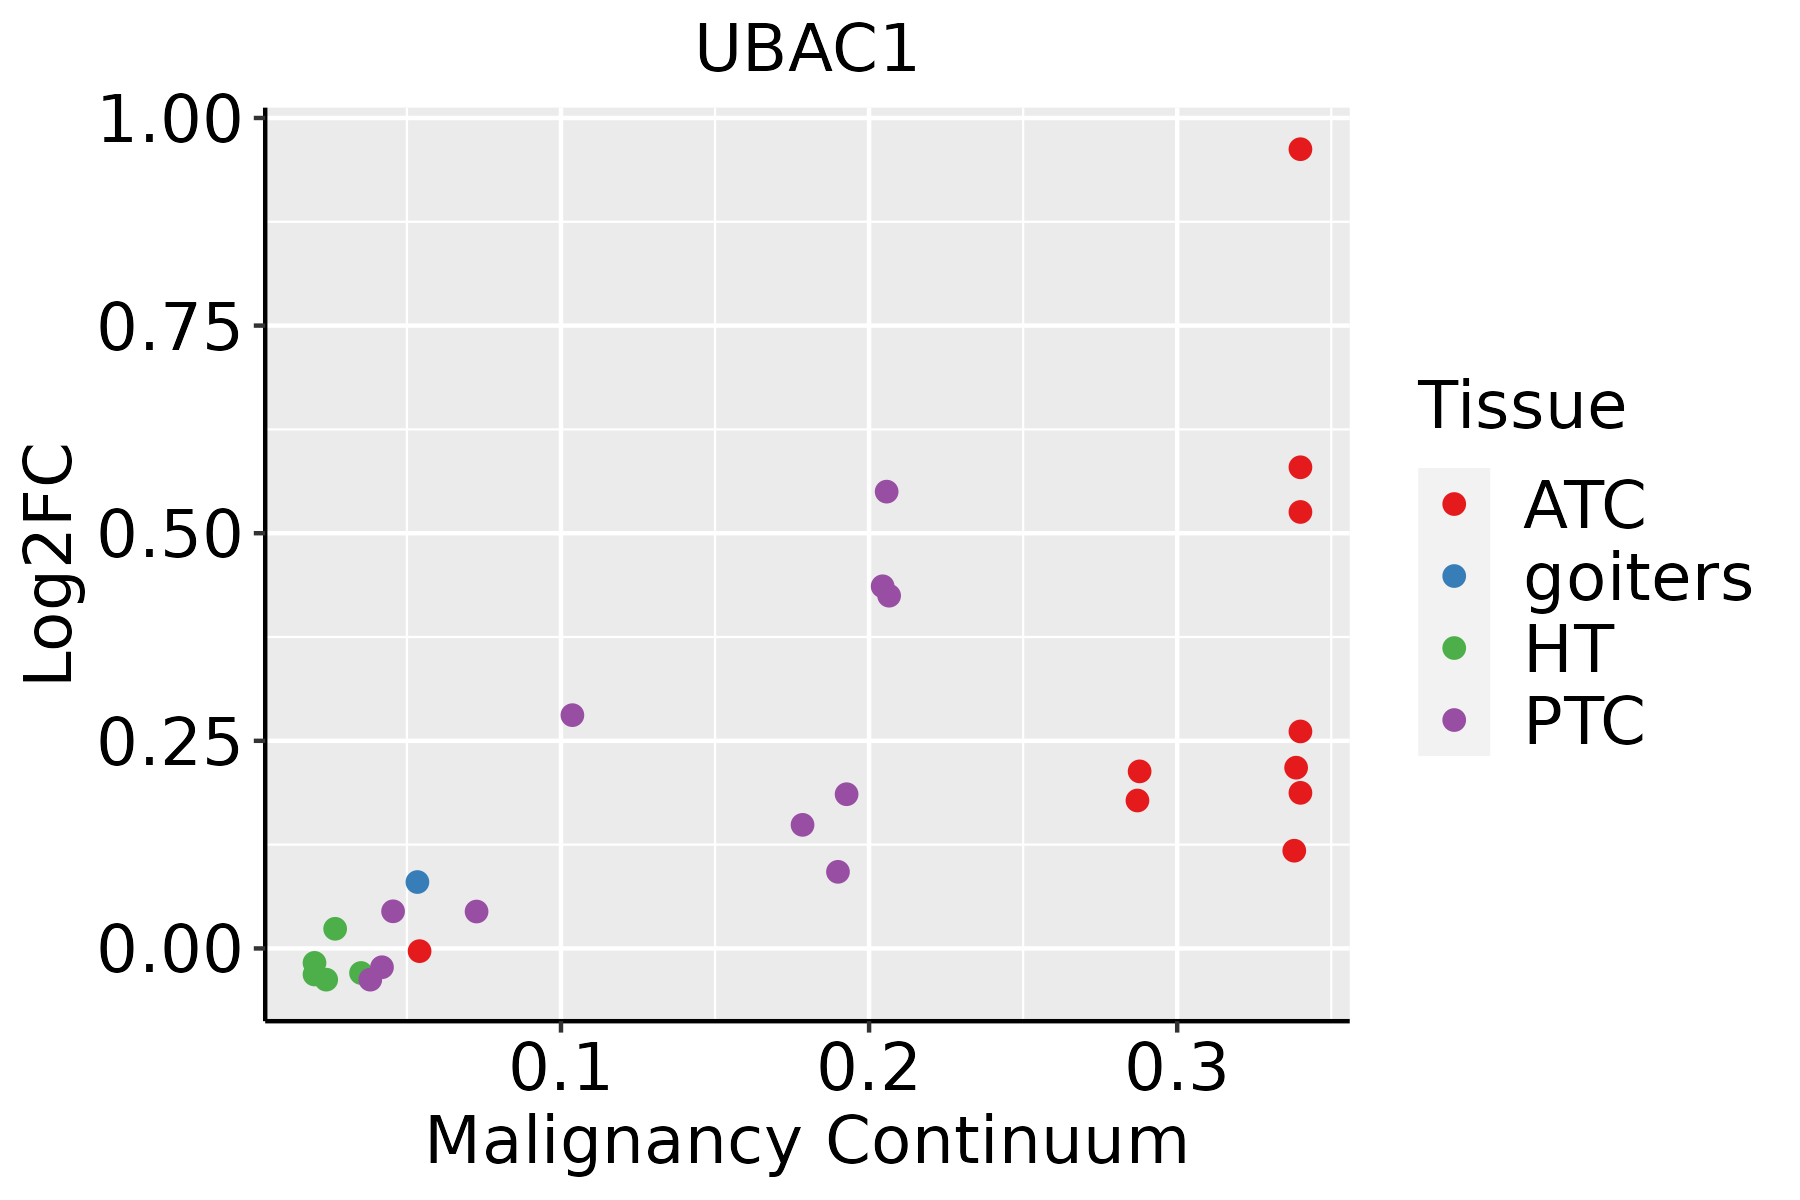 | ATC: Anaplastic thyroid cancer |
| HT: Hashimoto's thyroiditis | ||
| PTC: Papillary thyroid cancer |
| ∗log2FC in expression of this searched gene in stem-like cells from each diseased tissue sample relative to stem-like cells in normal samples in each tissue plotted against the malignancy continuum. Samples are colored based on if they are from different disease stage. |
Top |
Malignant transformation related pathway analysis |
| Find out the enriched GO biological processes and KEGG pathways involved in transition from healthy to precancer to cancer |
| Tissue | Disease Stage | Enriched GO biological Processes |
| Colorectum | AD |  |
| Colorectum | SER |  |
| Colorectum | MSS |  |
| Colorectum | MSI-H |  |
| Colorectum | FAP |  |
| ∗Top 15 enriched GO BP terms are showed in the bar plot of each disease state in each tissue. Each row represents a significant GO biological process which is colored according to the -log10(p.adjust). |
| Page: 1 2 3 4 5 6 7 8 9 |
| GO ID | Tissue | Disease Stage | Description | Gene Ratio | Bg Ratio | pvalue | p.adjust | Count |
| Page: 1 |
| Pathway ID | Tissue | Disease Stage | Description | Gene Ratio | Bg Ratio | pvalue | p.adjust | qvalue | Count |
| Page: 1 |
Top |
Cell-cell communication analysis |
| Identification of potential cell-cell interactions between two cell types and their ligand-receptor pairs for different disease states |
| Ligand | Receptor | LRpair | Pathway | Tissue | Disease Stage |
| Page: 1 |
Top |
Single-cell gene regulatory network inference analysis |
| Find out the significant the regulons (TFs) and the target genes of each regulon across cell types for different disease states |
| TF | Cell Type | Tissue | Disease Stage | Target Gene | RSS | Regulon Activity |
| ∗The dot plots of a searched regulon are shown for all cell subpopulations in each disease state of each tissue based on the regulon specific score inferred using pySCENIC and by calculating the average expression. |
| Page: 1 |
Top |
Somatic mutation of malignant transformation related genes |
| Annotation of somatic variants for genes involved in malignant transformation |
| Hugo Symbol | Variant Class | Variant Classification | dbSNP RS | HGVSc | HGVSp | HGVSp Short | SWISSPROT | BIOTYPE | SIFT | PolyPhen | Tumor Sample Barcode | Tissue | Histology | Sex | Age | Stage | Therapy Types | Drugs | Outcome |
| UBAC1 | insertion | Frame_Shift_Ins | novel | c.779_780insGTGTGGCACTGATCGTTTCCTTGGGGTGTGTG | p.Ala261CysfsTer25 | p.A261Cfs*25 | Q9BSL1 | protein_coding | TCGA-A8-A08H-01 | Breast | breast invasive carcinoma | Female | >=65 | I/II | Unknown | Unknown | SD | ||
| UBAC1 | SNV | Missense_Mutation | novel | c.325N>C | p.Glu109Gln | p.E109Q | Q9BSL1 | protein_coding | deleterious(0.04) | benign(0.107) | TCGA-VS-A8EL-01 | Cervix | cervical & endocervical cancer | Female | <65 | I/II | Chemotherapy | cisplatin | CR |
| UBAC1 | SNV | Missense_Mutation | c.877N>A | p.Ala293Thr | p.A293T | Q9BSL1 | protein_coding | deleterious(0) | probably_damaging(0.979) | TCGA-AA-3672-01 | Colorectum | colon adenocarcinoma | Female | >=65 | III/IV | Unknown | Unknown | SD | |
| UBAC1 | SNV | Missense_Mutation | novel | c.385N>A | p.Ala129Thr | p.A129T | Q9BSL1 | protein_coding | tolerated(0.06) | benign(0.161) | TCGA-AA-3949-01 | Colorectum | colon adenocarcinoma | Female | >=65 | III/IV | Unknown | Unknown | SD |
| UBAC1 | SNV | Missense_Mutation | novel | c.791N>A | p.Ser264Asn | p.S264N | Q9BSL1 | protein_coding | tolerated(0.15) | benign(0) | TCGA-AD-6964-01 | Colorectum | colon adenocarcinoma | Male | <65 | III/IV | Chemotherapy | folfox | PD |
| UBAC1 | SNV | Missense_Mutation | c.1154N>T | p.Asp385Val | p.D385V | Q9BSL1 | protein_coding | deleterious(0) | probably_damaging(0.992) | TCGA-CK-4951-01 | Colorectum | colon adenocarcinoma | Female | >=65 | I/II | Unknown | Unknown | PD | |
| UBAC1 | SNV | Missense_Mutation | rs559087791 | c.284G>A | p.Arg95His | p.R95H | Q9BSL1 | protein_coding | deleterious(0) | possibly_damaging(0.869) | TCGA-G4-6588-01 | Colorectum | colon adenocarcinoma | Female | <65 | I/II | Unknown | Unknown | SD |
| UBAC1 | SNV | Missense_Mutation | novel | c.492N>T | p.Gln164His | p.Q164H | Q9BSL1 | protein_coding | tolerated(0.07) | benign(0.035) | TCGA-AG-A002-01 | Colorectum | rectum adenocarcinoma | Male | <65 | I/II | Unknown | Unknown | SD |
| UBAC1 | SNV | Missense_Mutation | novel | c.910N>A | p.Glu304Lys | p.E304K | Q9BSL1 | protein_coding | deleterious(0) | probably_damaging(0.94) | TCGA-AJ-A3EL-01 | Endometrium | uterine corpus endometrioid carcinoma | Female | <65 | I/II | Unknown | Unknown | SD |
| UBAC1 | SNV | Missense_Mutation | c.1044N>T | p.Gln348His | p.Q348H | Q9BSL1 | protein_coding | deleterious(0.01) | possibly_damaging(0.85) | TCGA-AP-A059-01 | Endometrium | uterine corpus endometrioid carcinoma | Female | >=65 | I/II | Unknown | Unknown | SD |
| Page: 1 2 3 4 |
Top |
Related drugs of malignant transformation related genes |
| Identification of chemicals and drugs interact with genes involved in malignant transfromation |
| (DGIdb 4.0) |
| Entrez ID | Symbol | Category | Interaction Types | Drug Claim Name | Drug Name | PMIDs |
| Page: 1 |

Copyright 2023-Present -The University of Texas Health Science Center at Houston |