
|
|||||
|
 | |
| |
| |
| |
| |
| |
|
Gene: UBA6 |
Gene summary for UBA6 |
| Gene information | Species | Human | Gene symbol | UBA6 | Gene ID | 55236 |
| Gene name | ubiquitin like modifier activating enzyme 6 | |
| Gene Alias | E1-L2 | |
| Cytomap | 4q13.2 | |
| Gene Type | protein-coding | GO ID | GO:0003008 | UniProtAcc | A0A024RDB0 |
Top |
Malignant transformation analysis |
| Identification of the aberrant gene expression in precancerous and cancerous lesions by comparing the gene expression of stem-like cells in diseased tissues with normal stem cells |
| Entrez ID | Symbol | Replicates | Species | Organ | Tissue | Adj P-value | Log2FC | Malignancy |
| 55236 | UBA6 | CA_HPV_3 | Human | Cervix | CC | 1.51e-02 | 8.33e-02 | 0.0414 |
| 55236 | UBA6 | CCI_1 | Human | Cervix | CC | 3.62e-11 | 1.84e+00 | 0.528 |
| 55236 | UBA6 | CCI_2 | Human | Cervix | CC | 7.99e-10 | 1.21e+00 | 0.5249 |
| 55236 | UBA6 | CCI_3 | Human | Cervix | CC | 1.00e-02 | 5.15e-01 | 0.516 |
| 55236 | UBA6 | Tumor | Human | Cervix | CC | 1.03e-16 | 4.45e-01 | 0.1241 |
| 55236 | UBA6 | sample3 | Human | Cervix | CC | 8.14e-38 | 7.29e-01 | 0.1387 |
| 55236 | UBA6 | T3 | Human | Cervix | CC | 4.87e-35 | 6.93e-01 | 0.1389 |
| 55236 | UBA6 | LZE4T | Human | Esophagus | ESCC | 4.31e-17 | 3.12e-01 | 0.0811 |
| 55236 | UBA6 | LZE5T | Human | Esophagus | ESCC | 1.69e-05 | 6.21e-01 | 0.0514 |
| 55236 | UBA6 | LZE8T | Human | Esophagus | ESCC | 4.36e-05 | 2.78e-01 | 0.067 |
| 55236 | UBA6 | LZE20T | Human | Esophagus | ESCC | 1.44e-07 | 1.95e-01 | 0.0662 |
| 55236 | UBA6 | LZE22D1 | Human | Esophagus | HGIN | 4.93e-02 | 6.39e-02 | 0.0595 |
| 55236 | UBA6 | LZE24T | Human | Esophagus | ESCC | 3.23e-09 | 2.06e-01 | 0.0596 |
| 55236 | UBA6 | LZE21T | Human | Esophagus | ESCC | 1.94e-05 | 4.11e-01 | 0.0655 |
| 55236 | UBA6 | LZE6T | Human | Esophagus | ESCC | 1.62e-03 | 2.32e-01 | 0.0845 |
| 55236 | UBA6 | P1T-E | Human | Esophagus | ESCC | 3.55e-10 | 3.42e-01 | 0.0875 |
| 55236 | UBA6 | P2T-E | Human | Esophagus | ESCC | 1.97e-28 | 5.96e-01 | 0.1177 |
| 55236 | UBA6 | P4T-E | Human | Esophagus | ESCC | 3.52e-15 | 4.33e-01 | 0.1323 |
| 55236 | UBA6 | P5T-E | Human | Esophagus | ESCC | 1.30e-17 | 3.25e-01 | 0.1327 |
| 55236 | UBA6 | P8T-E | Human | Esophagus | ESCC | 4.81e-26 | 4.72e-01 | 0.0889 |
| Page: 1 2 3 4 5 6 7 |
| Tissue | Expression Dynamics | Abbreviation |
| Cervix | 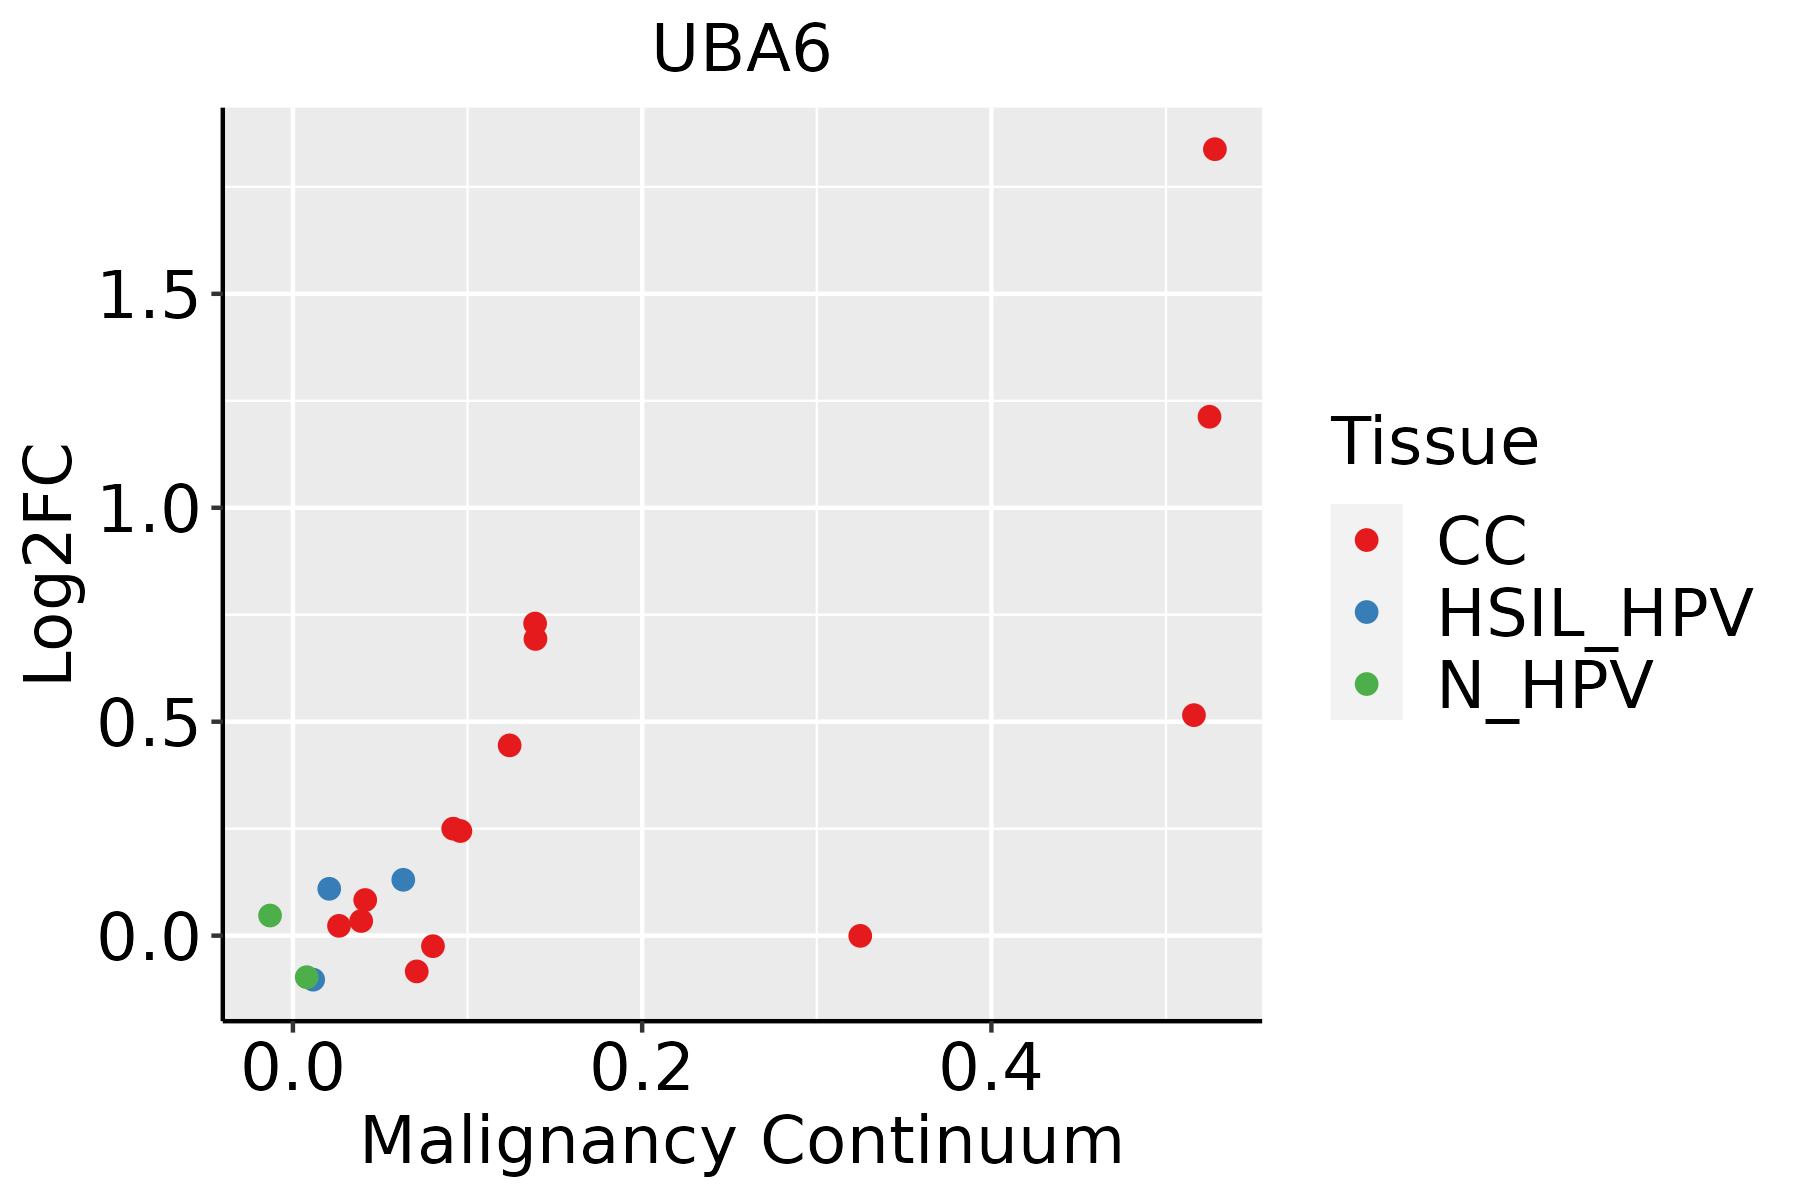 | CC: Cervix cancer |
| HSIL_HPV: HPV-infected high-grade squamous intraepithelial lesions | ||
| N_HPV: HPV-infected normal cervix | ||
| Esophagus | 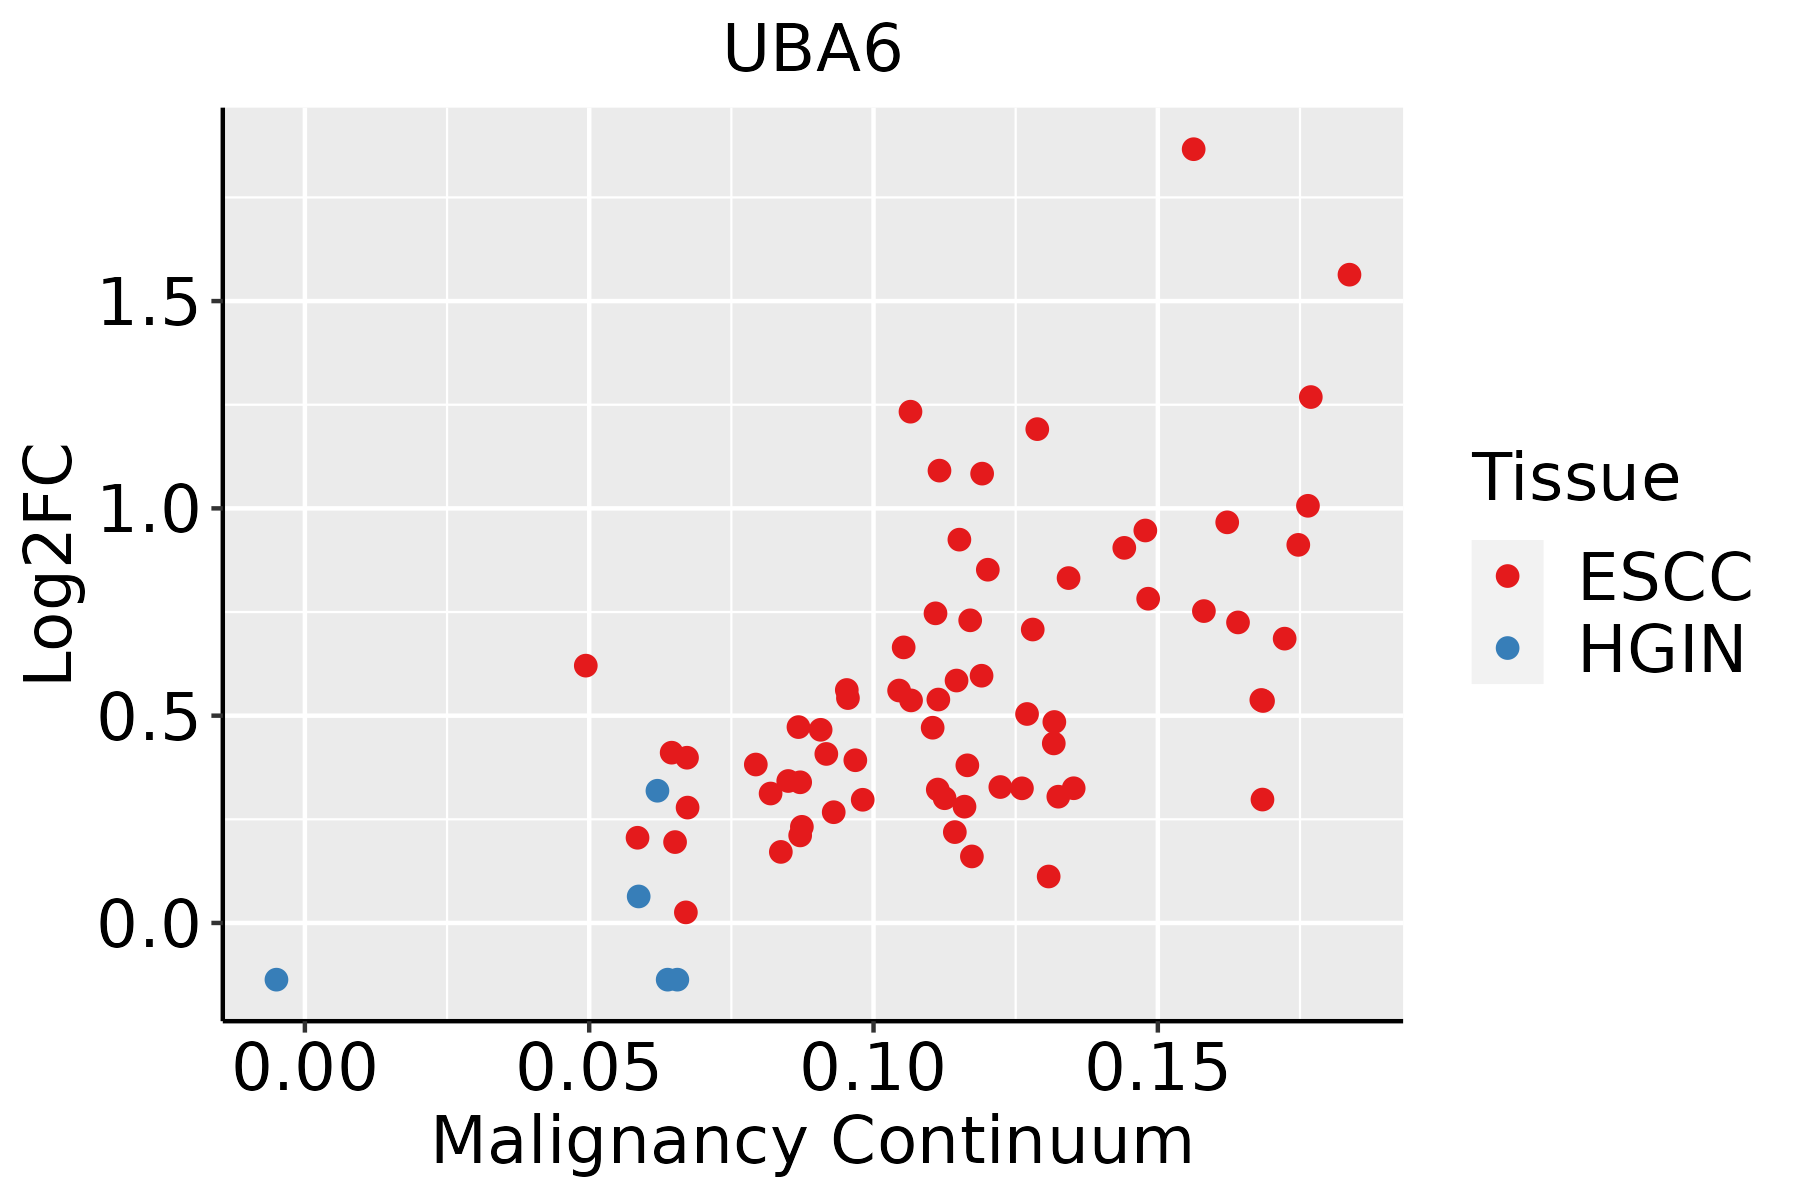 | ESCC: Esophageal squamous cell carcinoma |
| HGIN: High-grade intraepithelial neoplasias | ||
| LGIN: Low-grade intraepithelial neoplasias | ||
| Liver |  | HCC: Hepatocellular carcinoma |
| NAFLD: Non-alcoholic fatty liver disease | ||
| Lung | 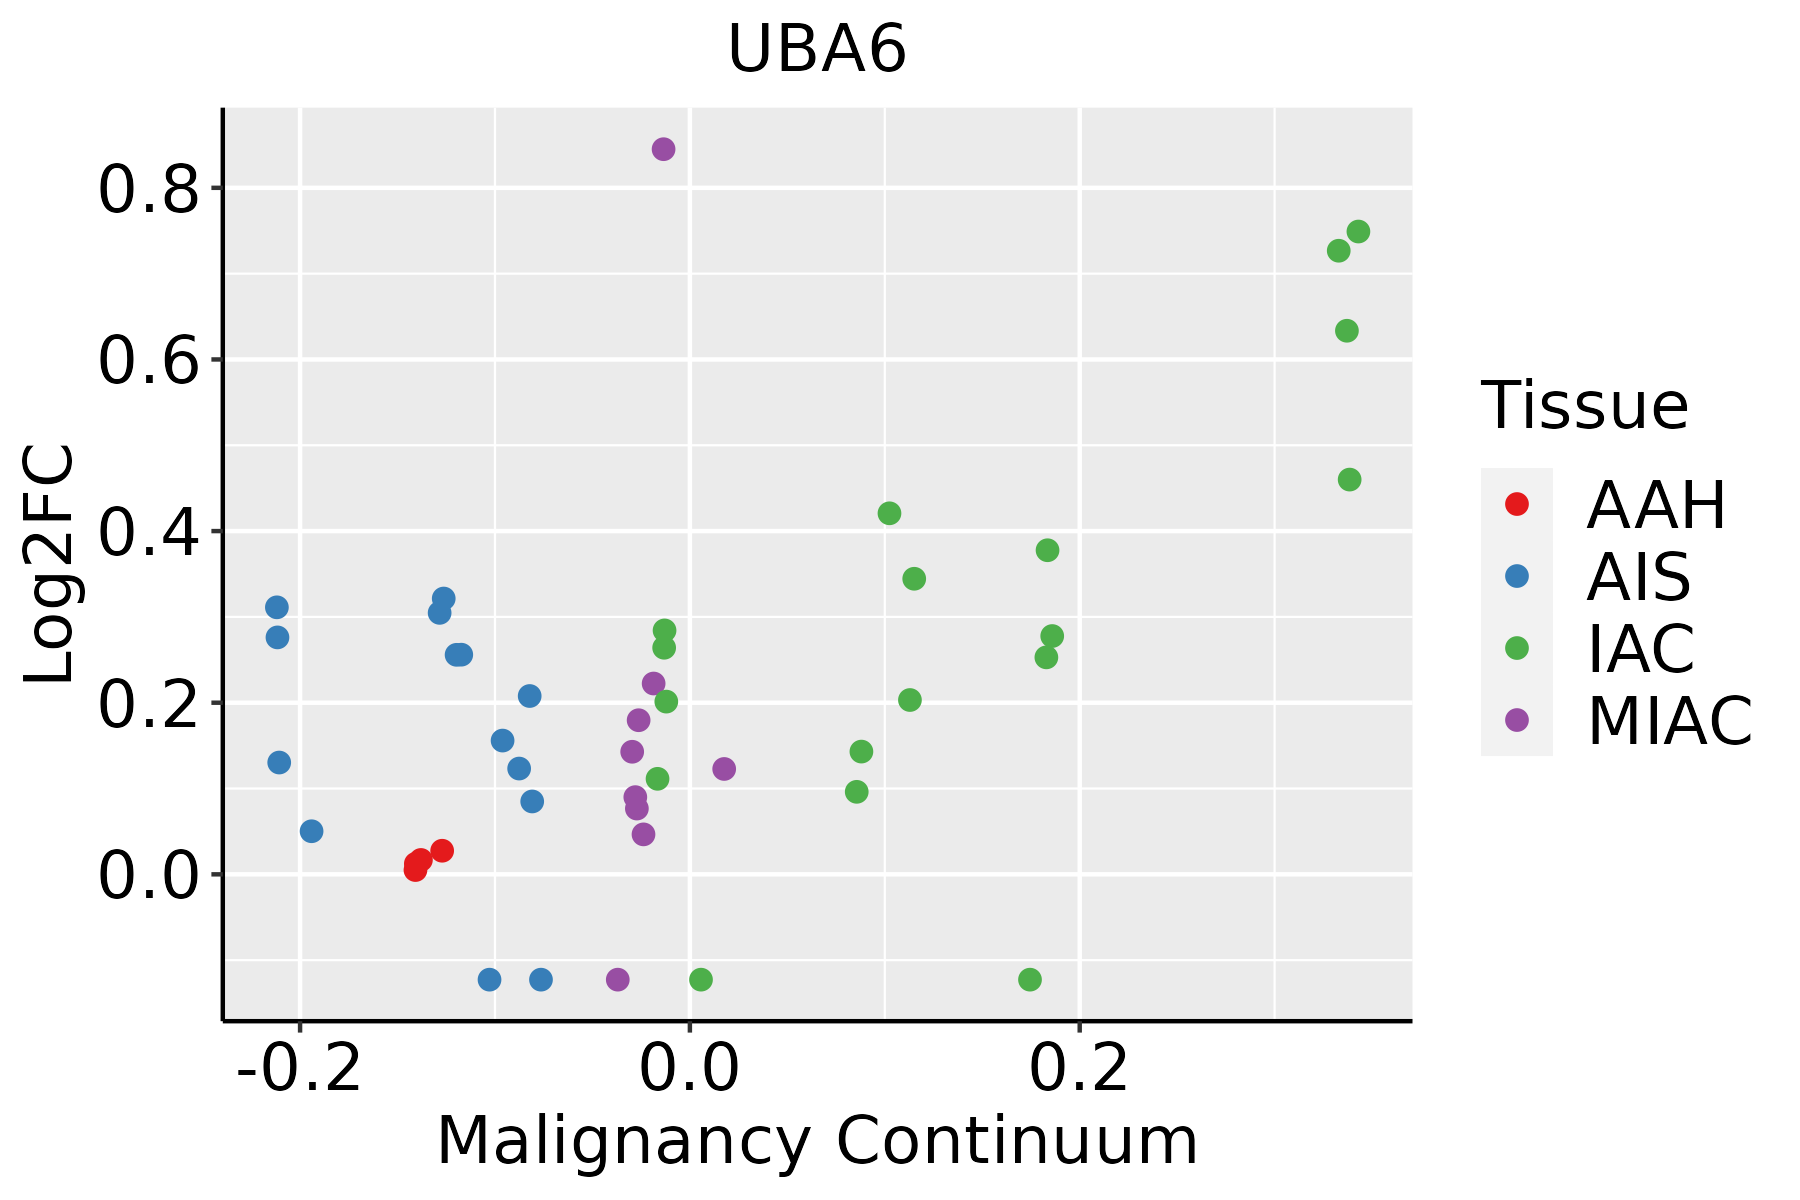 | AAH: Atypical adenomatous hyperplasia |
| AIS: Adenocarcinoma in situ | ||
| IAC: Invasive lung adenocarcinoma | ||
| MIA: Minimally invasive adenocarcinoma | ||
| Oral Cavity |  | EOLP: Erosive Oral lichen planus |
| LP: leukoplakia | ||
| NEOLP: Non-erosive oral lichen planus | ||
| OSCC: Oral squamous cell carcinoma | ||
| Skin | 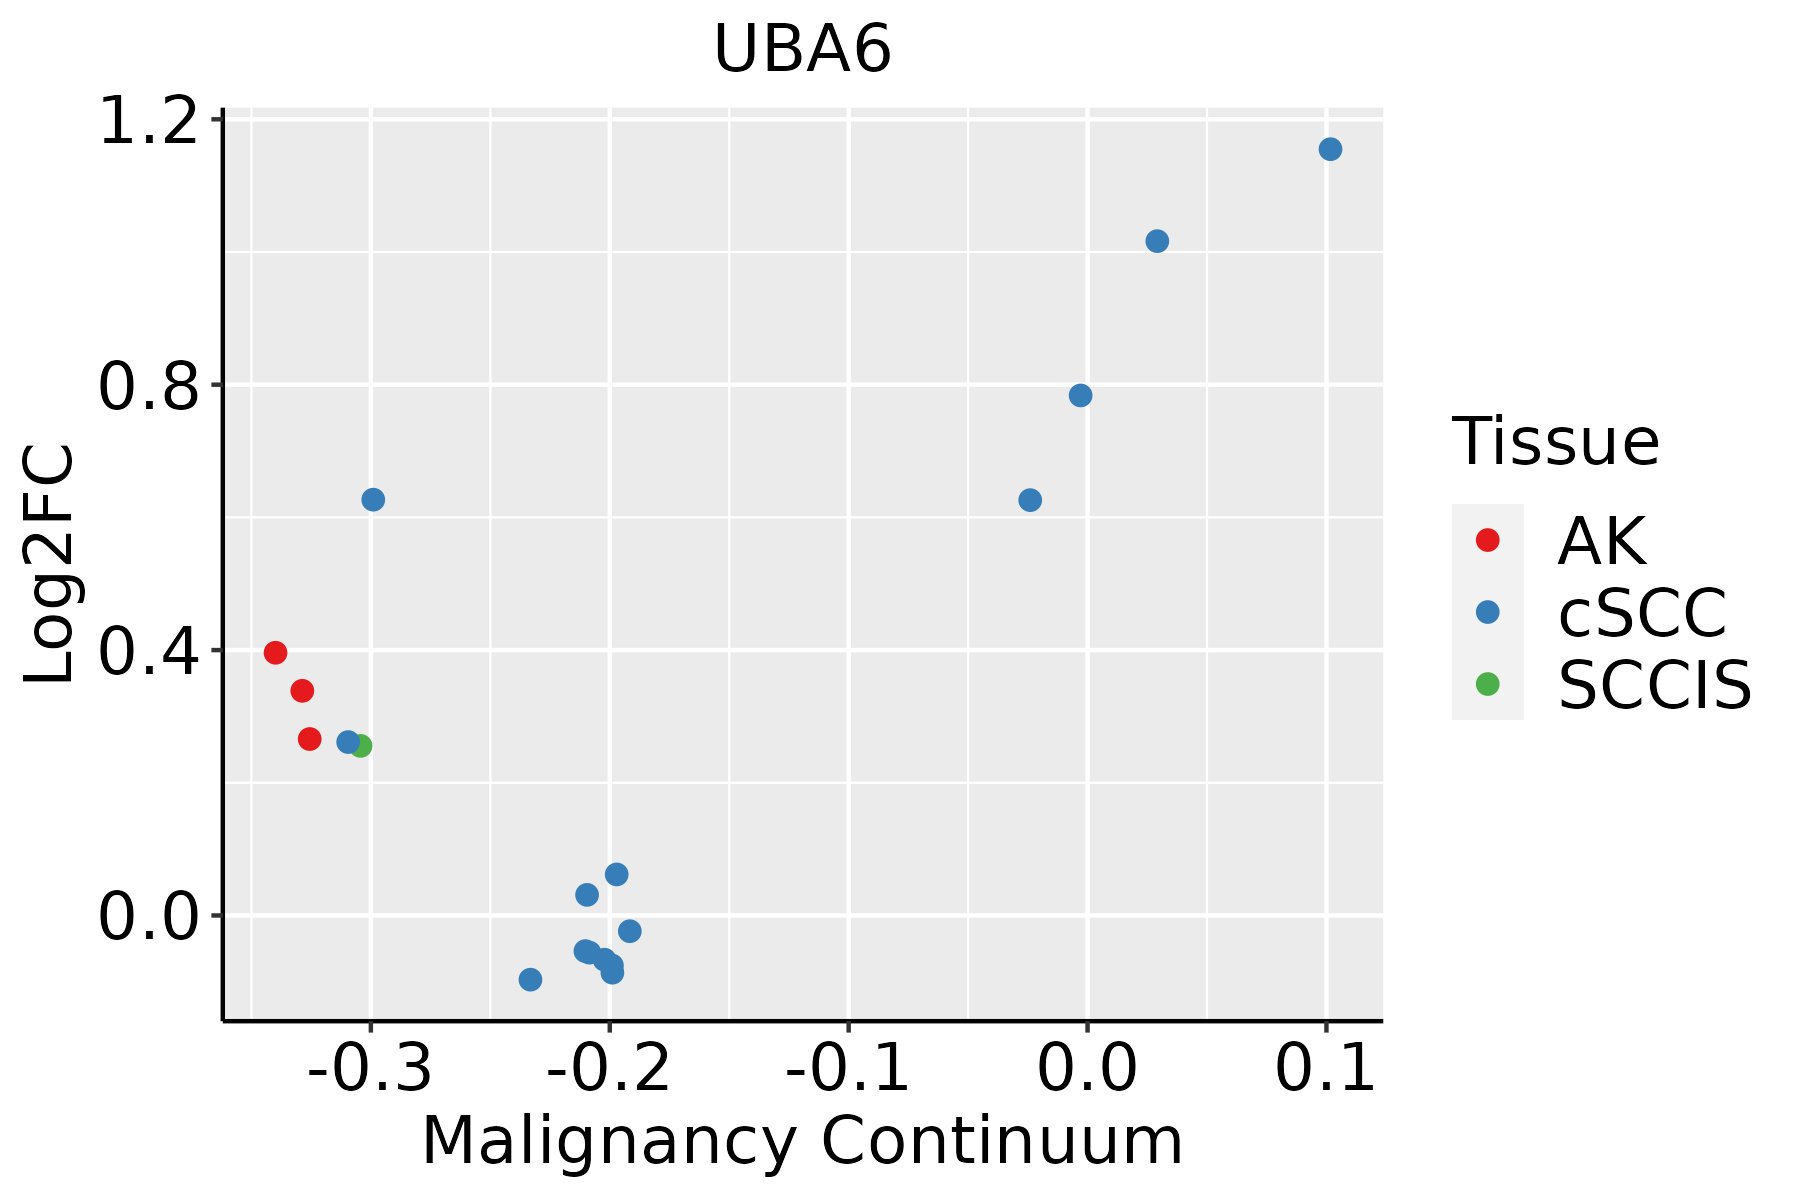 | AK: Actinic keratosis |
| cSCC: Cutaneous squamous cell carcinoma | ||
| SCCIS:squamous cell carcinoma in situ | ||
| Thyroid | 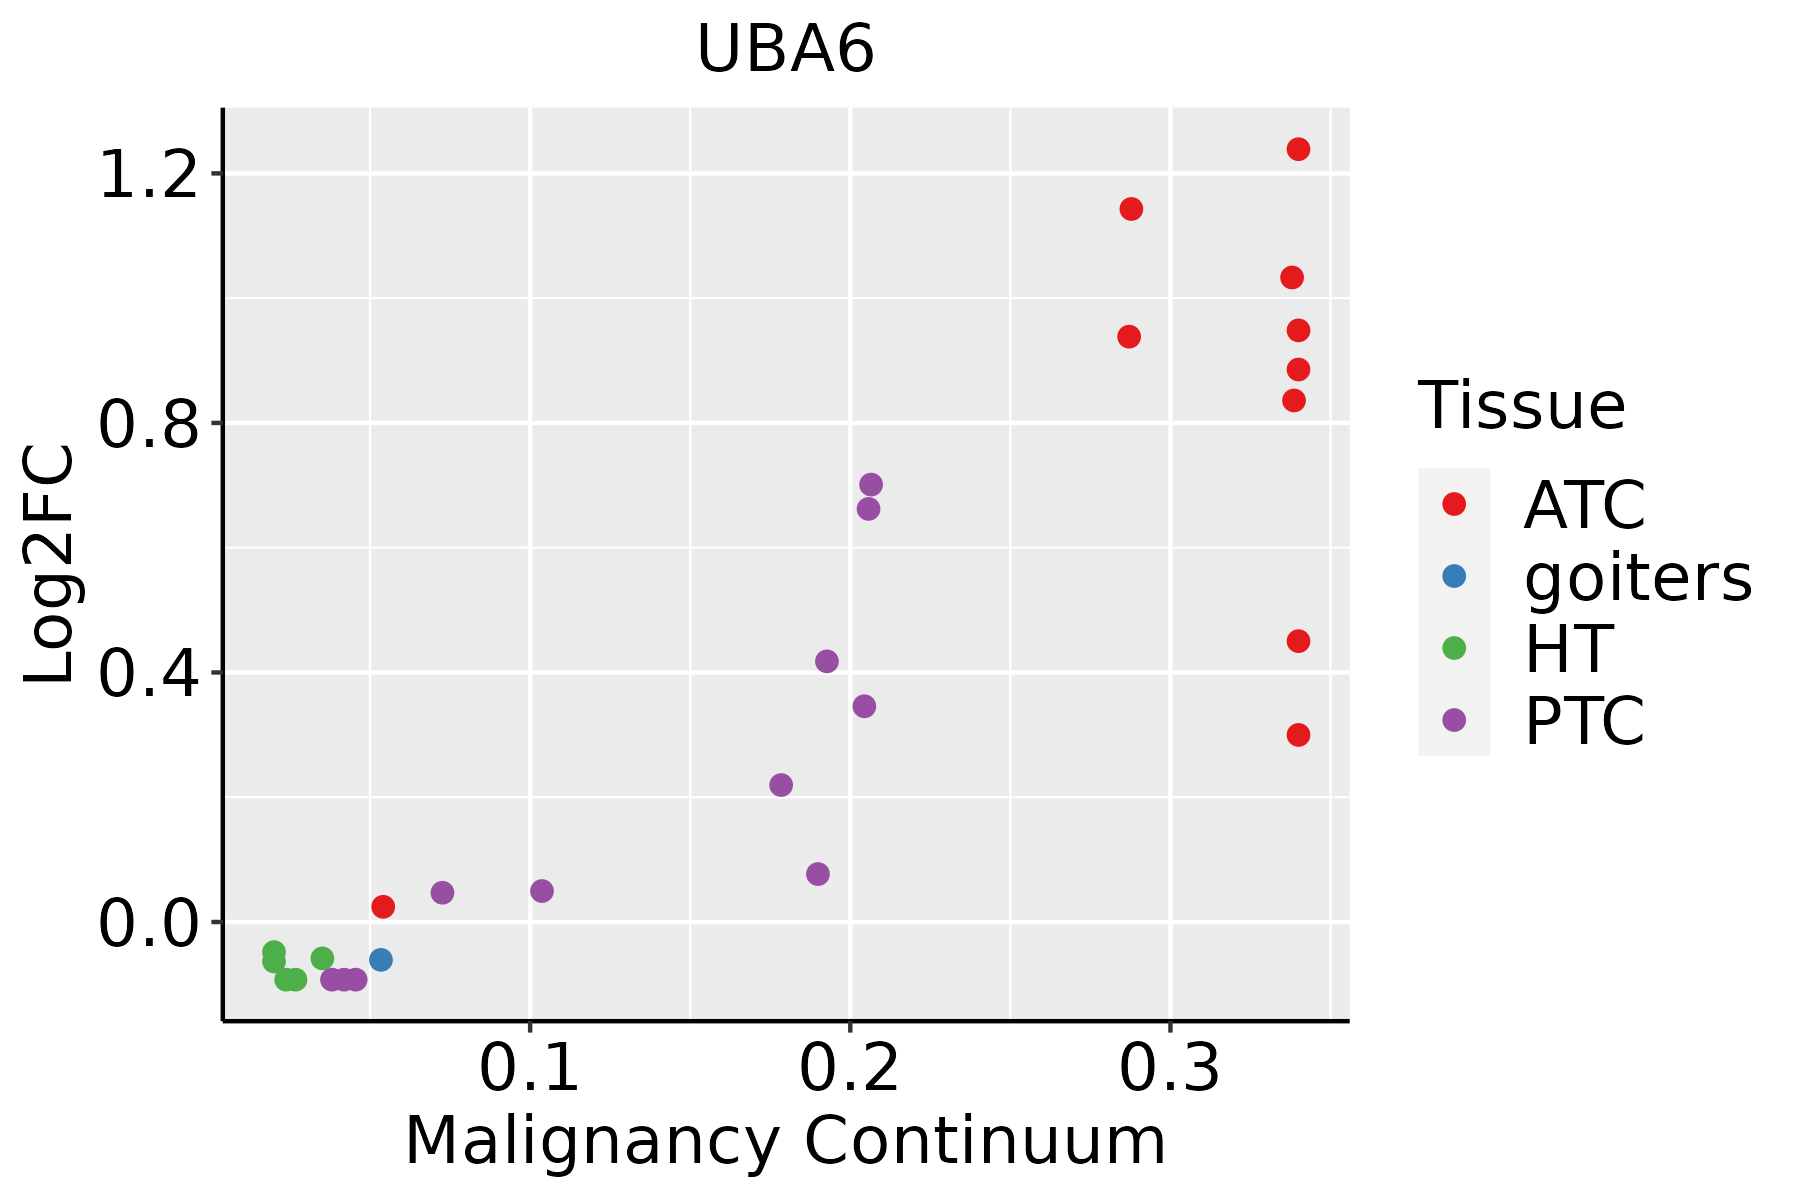 | ATC: Anaplastic thyroid cancer |
| HT: Hashimoto's thyroiditis | ||
| PTC: Papillary thyroid cancer |
| ∗log2FC in expression of this searched gene in stem-like cells from each diseased tissue sample relative to stem-like cells in normal samples in each tissue plotted against the malignancy continuum. Samples are colored based on if they are from different disease stage. |
Top |
Malignant transformation related pathway analysis |
| Find out the enriched GO biological processes and KEGG pathways involved in transition from healthy to precancer to cancer |
| Tissue | Disease Stage | Enriched GO biological Processes |
| Colorectum | AD |  |
| Colorectum | SER |  |
| Colorectum | MSS |  |
| Colorectum | MSI-H |  |
| Colorectum | FAP |  |
| ∗Top 15 enriched GO BP terms are showed in the bar plot of each disease state in each tissue. Each row represents a significant GO biological process which is colored according to the -log10(p.adjust). |
| Page: 1 2 3 4 5 6 7 8 9 |
| GO ID | Tissue | Disease Stage | Description | Gene Ratio | Bg Ratio | pvalue | p.adjust | Count |
| GO:00163587 | Cervix | CC | dendrite development | 58/2311 | 243/18723 | 4.52e-07 | 1.76e-05 | 58 |
| GO:00609965 | Cervix | CC | dendritic spine development | 28/2311 | 99/18723 | 1.61e-05 | 3.15e-04 | 28 |
| GO:00309003 | Cervix | CC | forebrain development | 64/2311 | 379/18723 | 5.53e-03 | 3.19e-02 | 64 |
| GO:00215433 | Cervix | CC | pallium development | 32/2311 | 169/18723 | 8.73e-03 | 4.48e-02 | 32 |
| GO:00215436 | Esophagus | ESCC | pallium development | 94/8552 | 169/18723 | 5.79e-03 | 2.14e-02 | 94 |
| GO:001635816 | Esophagus | ESCC | dendrite development | 130/8552 | 243/18723 | 8.33e-03 | 2.95e-02 | 130 |
| GO:00163585 | Liver | NAFLD | dendrite development | 43/1882 | 243/18723 | 1.70e-04 | 3.07e-03 | 43 |
| GO:00609963 | Liver | NAFLD | dendritic spine development | 21/1882 | 99/18723 | 7.26e-04 | 9.27e-03 | 21 |
| GO:006099611 | Liver | HCC | dendritic spine development | 54/7958 | 99/18723 | 1.03e-02 | 3.86e-02 | 54 |
| GO:001635811 | Liver | HCC | dendrite development | 121/7958 | 243/18723 | 1.26e-02 | 4.56e-02 | 121 |
| GO:00163586 | Lung | IAC | dendrite development | 55/2061 | 243/18723 | 1.35e-07 | 1.18e-05 | 55 |
| GO:00609964 | Lung | IAC | dendritic spine development | 25/2061 | 99/18723 | 5.18e-05 | 1.18e-03 | 25 |
| GO:00215432 | Lung | IAC | pallium development | 33/2061 | 169/18723 | 7.51e-04 | 9.82e-03 | 33 |
| GO:00309002 | Lung | IAC | forebrain development | 61/2061 | 379/18723 | 1.52e-03 | 1.61e-02 | 61 |
| GO:001635812 | Lung | AIS | dendrite development | 49/1849 | 243/18723 | 9.53e-07 | 6.69e-05 | 49 |
| GO:006099612 | Lung | AIS | dendritic spine development | 23/1849 | 99/18723 | 7.62e-05 | 1.95e-03 | 23 |
| GO:0007626 | Lung | AIS | locomotory behavior | 31/1849 | 179/18723 | 1.39e-03 | 1.70e-02 | 31 |
| GO:003090011 | Lung | AIS | forebrain development | 55/1849 | 379/18723 | 2.37e-03 | 2.48e-02 | 55 |
| GO:001635810 | Oral cavity | OSCC | dendrite development | 113/7305 | 243/18723 | 1.00e-02 | 3.49e-02 | 113 |
| GO:00215435 | Oral cavity | OSCC | pallium development | 81/7305 | 169/18723 | 1.11e-02 | 3.76e-02 | 81 |
| Page: 1 2 3 |
| Pathway ID | Tissue | Disease Stage | Description | Gene Ratio | Bg Ratio | pvalue | p.adjust | qvalue | Count |
| hsa0412014 | Cervix | CC | Ubiquitin mediated proteolysis | 49/1267 | 142/8465 | 4.26e-09 | 7.68e-08 | 4.54e-08 | 49 |
| hsa0412015 | Cervix | CC | Ubiquitin mediated proteolysis | 49/1267 | 142/8465 | 4.26e-09 | 7.68e-08 | 4.54e-08 | 49 |
| hsa0412026 | Esophagus | HGIN | Ubiquitin mediated proteolysis | 49/1383 | 142/8465 | 7.78e-08 | 1.33e-06 | 1.06e-06 | 49 |
| hsa04120111 | Esophagus | HGIN | Ubiquitin mediated proteolysis | 49/1383 | 142/8465 | 7.78e-08 | 1.33e-06 | 1.06e-06 | 49 |
| hsa0412027 | Esophagus | ESCC | Ubiquitin mediated proteolysis | 122/4205 | 142/8465 | 6.53e-20 | 7.29e-18 | 3.74e-18 | 122 |
| hsa0412036 | Esophagus | ESCC | Ubiquitin mediated proteolysis | 122/4205 | 142/8465 | 6.53e-20 | 7.29e-18 | 3.74e-18 | 122 |
| hsa0412010 | Liver | NAFLD | Ubiquitin mediated proteolysis | 44/1043 | 142/8465 | 2.59e-09 | 1.70e-07 | 1.37e-07 | 44 |
| hsa0412011 | Liver | NAFLD | Ubiquitin mediated proteolysis | 44/1043 | 142/8465 | 2.59e-09 | 1.70e-07 | 1.37e-07 | 44 |
| hsa0412041 | Liver | HCC | Ubiquitin mediated proteolysis | 110/4020 | 142/8465 | 1.67e-13 | 3.74e-12 | 2.08e-12 | 110 |
| hsa0412051 | Liver | HCC | Ubiquitin mediated proteolysis | 110/4020 | 142/8465 | 1.67e-13 | 3.74e-12 | 2.08e-12 | 110 |
| hsa0412012 | Lung | IAC | Ubiquitin mediated proteolysis | 40/1053 | 142/8465 | 3.24e-07 | 1.76e-05 | 1.17e-05 | 40 |
| hsa0412013 | Lung | IAC | Ubiquitin mediated proteolysis | 40/1053 | 142/8465 | 3.24e-07 | 1.76e-05 | 1.17e-05 | 40 |
| hsa0412022 | Lung | AIS | Ubiquitin mediated proteolysis | 41/961 | 142/8465 | 8.01e-09 | 4.33e-07 | 2.77e-07 | 41 |
| hsa0412032 | Lung | AIS | Ubiquitin mediated proteolysis | 41/961 | 142/8465 | 8.01e-09 | 4.33e-07 | 2.77e-07 | 41 |
| hsa0412020 | Oral cavity | OSCC | Ubiquitin mediated proteolysis | 105/3704 | 142/8465 | 1.83e-13 | 4.37e-12 | 2.23e-12 | 105 |
| hsa04120110 | Oral cavity | OSCC | Ubiquitin mediated proteolysis | 105/3704 | 142/8465 | 1.83e-13 | 4.37e-12 | 2.23e-12 | 105 |
| hsa0412025 | Oral cavity | LP | Ubiquitin mediated proteolysis | 66/2418 | 142/8465 | 3.74e-06 | 3.46e-05 | 2.23e-05 | 66 |
| hsa0412035 | Oral cavity | LP | Ubiquitin mediated proteolysis | 66/2418 | 142/8465 | 3.74e-06 | 3.46e-05 | 2.23e-05 | 66 |
| hsa0412043 | Oral cavity | EOLP | Ubiquitin mediated proteolysis | 48/1218 | 142/8465 | 3.55e-09 | 6.74e-08 | 3.98e-08 | 48 |
| hsa0412053 | Oral cavity | EOLP | Ubiquitin mediated proteolysis | 48/1218 | 142/8465 | 3.55e-09 | 6.74e-08 | 3.98e-08 | 48 |
| Page: 1 |
Top |
Cell-cell communication analysis |
| Identification of potential cell-cell interactions between two cell types and their ligand-receptor pairs for different disease states |
| Ligand | Receptor | LRpair | Pathway | Tissue | Disease Stage |
| Page: 1 |
Top |
Single-cell gene regulatory network inference analysis |
| Find out the significant the regulons (TFs) and the target genes of each regulon across cell types for different disease states |
| TF | Cell Type | Tissue | Disease Stage | Target Gene | RSS | Regulon Activity |
| ∗The dot plots of a searched regulon are shown for all cell subpopulations in each disease state of each tissue based on the regulon specific score inferred using pySCENIC and by calculating the average expression. |
| Page: 1 |
Top |
Somatic mutation of malignant transformation related genes |
| Annotation of somatic variants for genes involved in malignant transformation |
| Hugo Symbol | Variant Class | Variant Classification | dbSNP RS | HGVSc | HGVSp | HGVSp Short | SWISSPROT | BIOTYPE | SIFT | PolyPhen | Tumor Sample Barcode | Tissue | Histology | Sex | Age | Stage | Therapy Types | Drugs | Outcome |
| UBA6 | SNV | Missense_Mutation | rs778733309 | c.665C>T | p.Thr222Met | p.T222M | A0AVT1 | protein_coding | deleterious(0) | possibly_damaging(0.855) | TCGA-AN-A0FF-01 | Breast | breast invasive carcinoma | Female | <65 | I/II | Unknown | Unknown | SD |
| UBA6 | SNV | Missense_Mutation | c.413N>T | p.Ser138Phe | p.S138F | A0AVT1 | protein_coding | tolerated(0.61) | benign(0.445) | TCGA-AO-A03O-01 | Breast | breast invasive carcinoma | Female | >=65 | I/II | Chemotherapy | doxorubicin | SD | |
| UBA6 | SNV | Missense_Mutation | c.501G>C | p.Gln167His | p.Q167H | A0AVT1 | protein_coding | deleterious(0) | probably_damaging(0.954) | TCGA-AR-A0TX-01 | Breast | breast invasive carcinoma | Female | <65 | I/II | Unknown | Unknown | SD | |
| UBA6 | SNV | Missense_Mutation | c.1319G>A | p.Gly440Glu | p.G440E | A0AVT1 | protein_coding | deleterious(0.02) | possibly_damaging(0.554) | TCGA-C8-A26Y-01 | Breast | breast invasive carcinoma | Female | >=65 | I/II | Unknown | Unknown | SD | |
| UBA6 | SNV | Missense_Mutation | novel | c.932N>T | p.Cys311Phe | p.C311F | A0AVT1 | protein_coding | tolerated(1) | benign(0.001) | TCGA-D8-A27M-01 | Breast | breast invasive carcinoma | Female | <65 | I/II | Chemotherapy | methotrexate+5 | SD |
| UBA6 | SNV | Missense_Mutation | c.2379G>C | p.Gln793His | p.Q793H | A0AVT1 | protein_coding | deleterious(0) | benign(0.001) | TCGA-E9-A1ND-01 | Breast | breast invasive carcinoma | Female | >=65 | I/II | Hormone Therapy | aromasin | SD | |
| UBA6 | SNV | Missense_Mutation | novel | c.2155N>A | p.Leu719Ile | p.L719I | A0AVT1 | protein_coding | deleterious(0.02) | possibly_damaging(0.685) | TCGA-E9-A22E-01 | Breast | breast invasive carcinoma | Female | <65 | III/IV | Chemotherapy | cyclophosphane | SD |
| UBA6 | SNV | Missense_Mutation | rs752794407 | c.1022N>A | p.Arg341His | p.R341H | A0AVT1 | protein_coding | tolerated(0.06) | benign(0.003) | TCGA-EW-A1IZ-01 | Breast | breast invasive carcinoma | Female | <65 | III/IV | Chemotherapy | taxotere | SD |
| UBA6 | SNV | Missense_Mutation | rs778733309 | c.665C>T | p.Thr222Met | p.T222M | A0AVT1 | protein_coding | deleterious(0) | possibly_damaging(0.855) | TCGA-2W-A8YY-01 | Cervix | cervical & endocervical cancer | Female | <65 | I/II | Chemotherapy | cisplatin | CR |
| UBA6 | SNV | Missense_Mutation | novel | c.1705N>C | p.Asp569His | p.D569H | A0AVT1 | protein_coding | deleterious(0) | probably_damaging(1) | TCGA-VS-A952-01 | Cervix | cervical & endocervical cancer | Female | >=65 | I/II | Unknown | Unknown | SD |
| Page: 1 2 3 4 5 6 7 8 9 10 11 12 |
Top |
Related drugs of malignant transformation related genes |
| Identification of chemicals and drugs interact with genes involved in malignant transfromation |
| (DGIdb 4.0) |
| Entrez ID | Symbol | Category | Interaction Types | Drug Claim Name | Drug Name | PMIDs |
| Page: 1 |

Copyright 2023-Present -The University of Texas Health Science Center at Houston |