
|
|||||
|
 | |
| |
| |
| |
| |
| |
|
Gene: UBA52 |
Gene summary for UBA52 |
| Gene information | Species | Human | Gene symbol | UBA52 | Gene ID | 7311 |
| Gene name | ubiquitin A-52 residue ribosomal protein fusion product 1 | |
| Gene Alias | CEP52 | |
| Cytomap | 19p13.11 | |
| Gene Type | protein-coding | GO ID | GO:0002181 | UniProtAcc | P62987 |
Top |
Malignant transformation analysis |
| Identification of the aberrant gene expression in precancerous and cancerous lesions by comparing the gene expression of stem-like cells in diseased tissues with normal stem cells |
| Entrez ID | Symbol | Replicates | Species | Organ | Tissue | Adj P-value | Log2FC | Malignancy |
| 7311 | UBA52 | GSM4909280 | Human | Breast | Precancer | 2.46e-02 | -3.67e-01 | 0.0305 |
| 7311 | UBA52 | GSM4909282 | Human | Breast | IDC | 5.43e-13 | 2.07e-01 | -0.0288 |
| 7311 | UBA52 | GSM4909285 | Human | Breast | IDC | 1.44e-51 | 3.20e-01 | 0.21 |
| 7311 | UBA52 | GSM4909286 | Human | Breast | IDC | 6.99e-34 | 2.51e-01 | 0.1081 |
| 7311 | UBA52 | GSM4909287 | Human | Breast | IDC | 3.97e-46 | 3.20e-01 | 0.2057 |
| 7311 | UBA52 | GSM4909288 | Human | Breast | IDC | 2.34e-08 | 2.07e-01 | 0.0988 |
| 7311 | UBA52 | GSM4909290 | Human | Breast | IDC | 5.42e-07 | 1.77e-01 | 0.2096 |
| 7311 | UBA52 | GSM4909291 | Human | Breast | IDC | 4.60e-04 | 1.57e-01 | 0.1753 |
| 7311 | UBA52 | GSM4909292 | Human | Breast | IDC | 9.25e-30 | 5.57e-01 | 0.1236 |
| 7311 | UBA52 | GSM4909293 | Human | Breast | IDC | 4.44e-38 | 3.76e-01 | 0.1581 |
| 7311 | UBA52 | GSM4909294 | Human | Breast | IDC | 2.21e-37 | 2.56e-01 | 0.2022 |
| 7311 | UBA52 | GSM4909296 | Human | Breast | IDC | 1.06e-18 | 1.50e-01 | 0.1524 |
| 7311 | UBA52 | GSM4909297 | Human | Breast | IDC | 3.00e-19 | -1.50e-01 | 0.1517 |
| 7311 | UBA52 | GSM4909298 | Human | Breast | IDC | 1.24e-22 | 2.43e-01 | 0.1551 |
| 7311 | UBA52 | GSM4909301 | Human | Breast | IDC | 1.79e-09 | 1.66e-01 | 0.1577 |
| 7311 | UBA52 | GSM4909302 | Human | Breast | IDC | 1.23e-07 | 8.43e-02 | 0.1545 |
| 7311 | UBA52 | GSM4909304 | Human | Breast | IDC | 3.45e-20 | 2.55e-01 | 0.1636 |
| 7311 | UBA52 | GSM4909307 | Human | Breast | IDC | 3.28e-09 | 1.41e-01 | 0.1569 |
| 7311 | UBA52 | GSM4909308 | Human | Breast | IDC | 3.72e-03 | 1.42e-01 | 0.158 |
| 7311 | UBA52 | GSM4909309 | Human | Breast | IDC | 1.87e-04 | -1.08e-01 | 0.0483 |
| Page: 1 2 3 4 5 6 7 8 9 10 11 12 13 14 15 16 17 18 |
| Tissue | Expression Dynamics | Abbreviation |
| Breast | 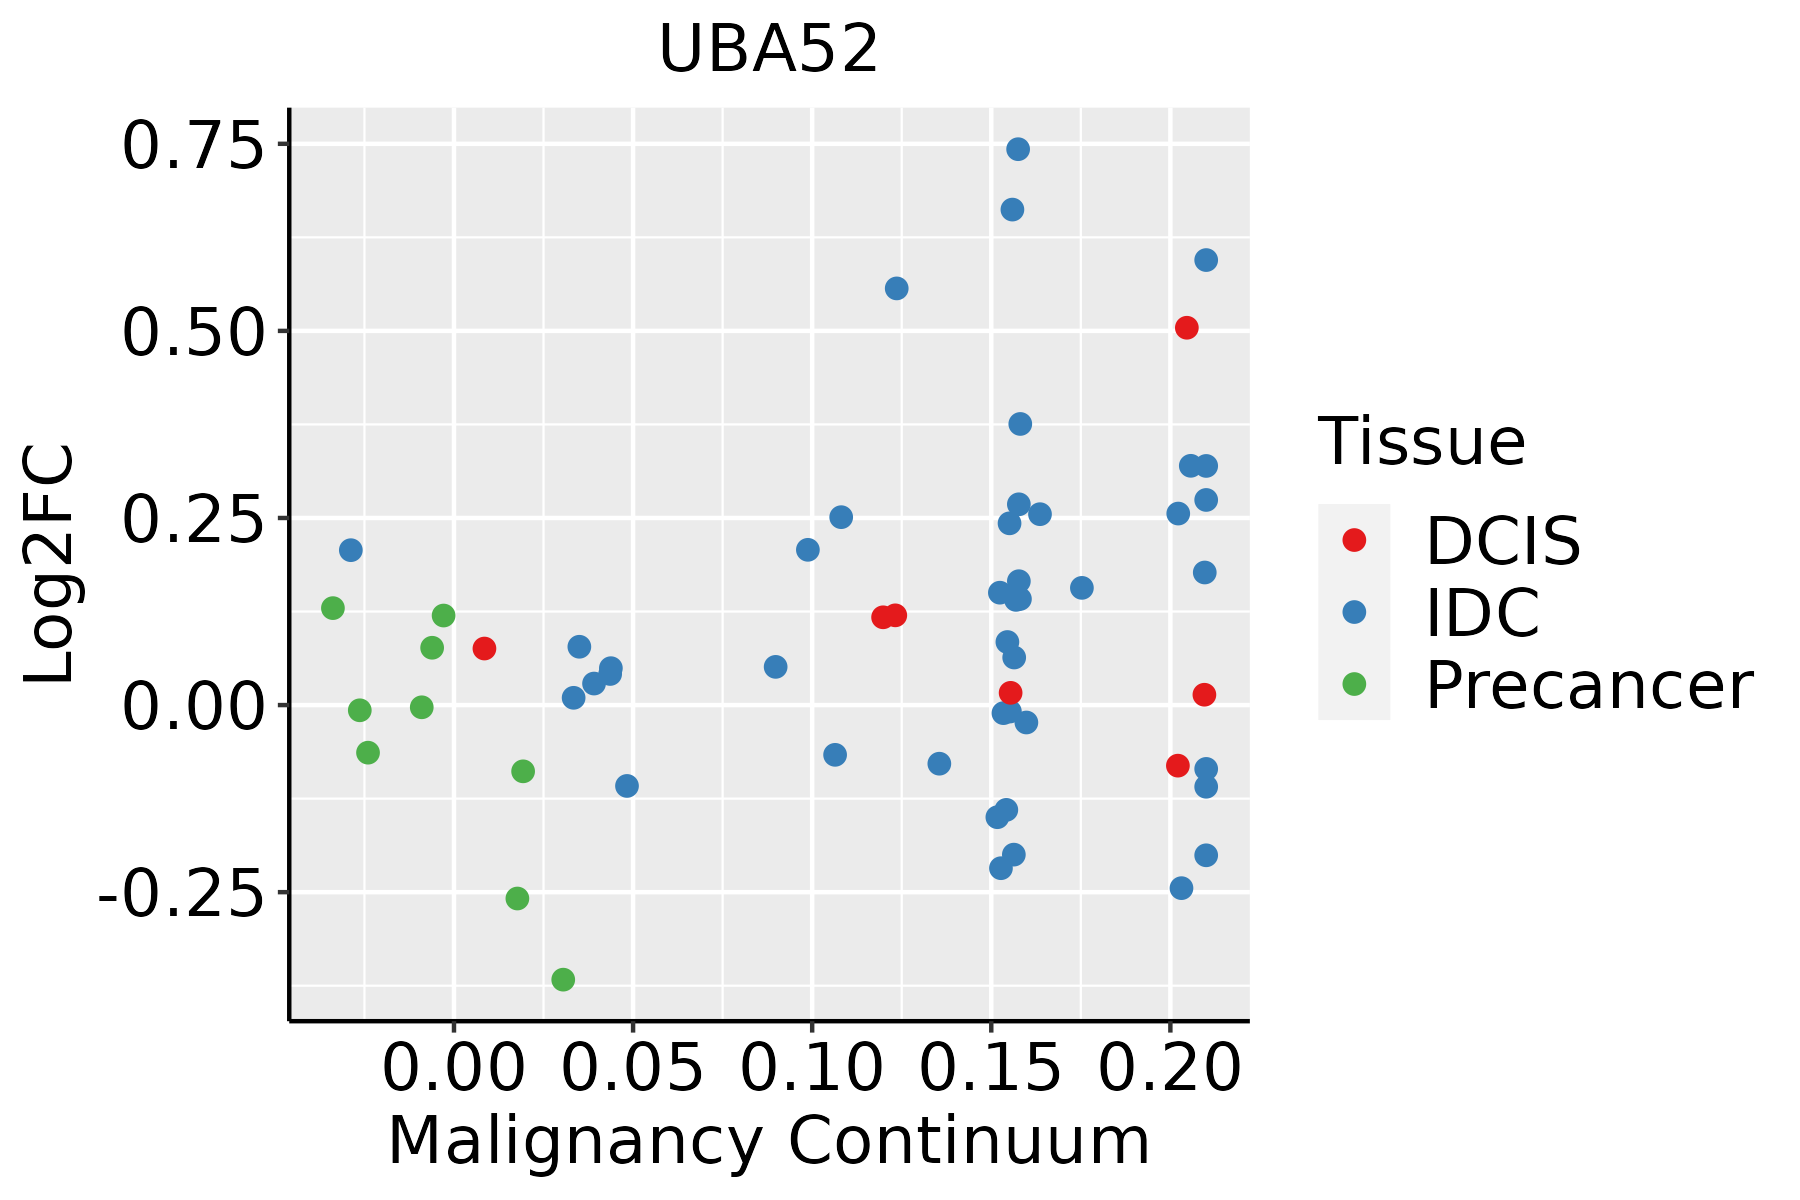 | IDC: Invasive ductal carcinoma |
| DCIS: Ductal carcinoma in situ | ||
| Precancer(BRCA1-mut): Precancerous lesion from BRCA1 mutation carriers | ||
| Cervix | 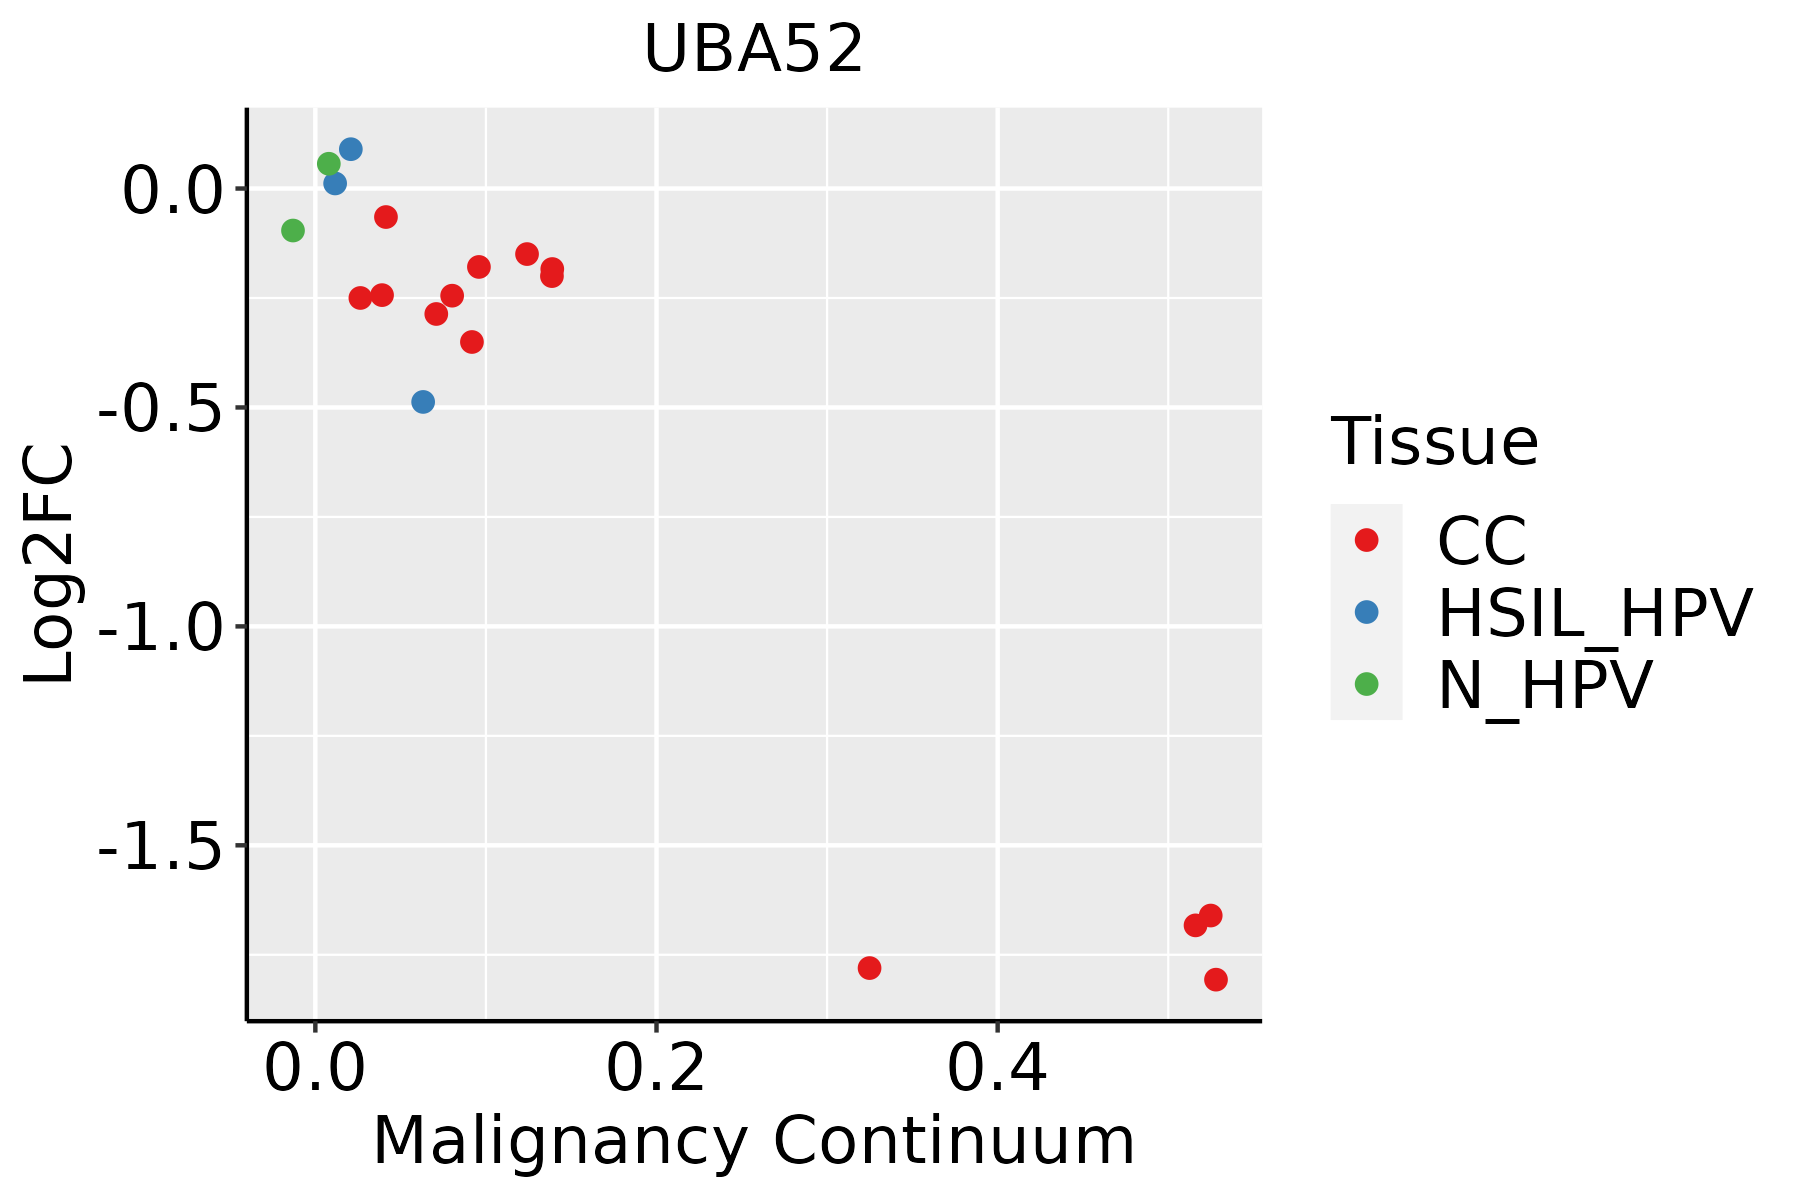 | CC: Cervix cancer |
| HSIL_HPV: HPV-infected high-grade squamous intraepithelial lesions | ||
| N_HPV: HPV-infected normal cervix | ||
| Colorectum (GSE201348) |  | FAP: Familial adenomatous polyposis |
| CRC: Colorectal cancer | ||
| Colorectum (HTA11) | 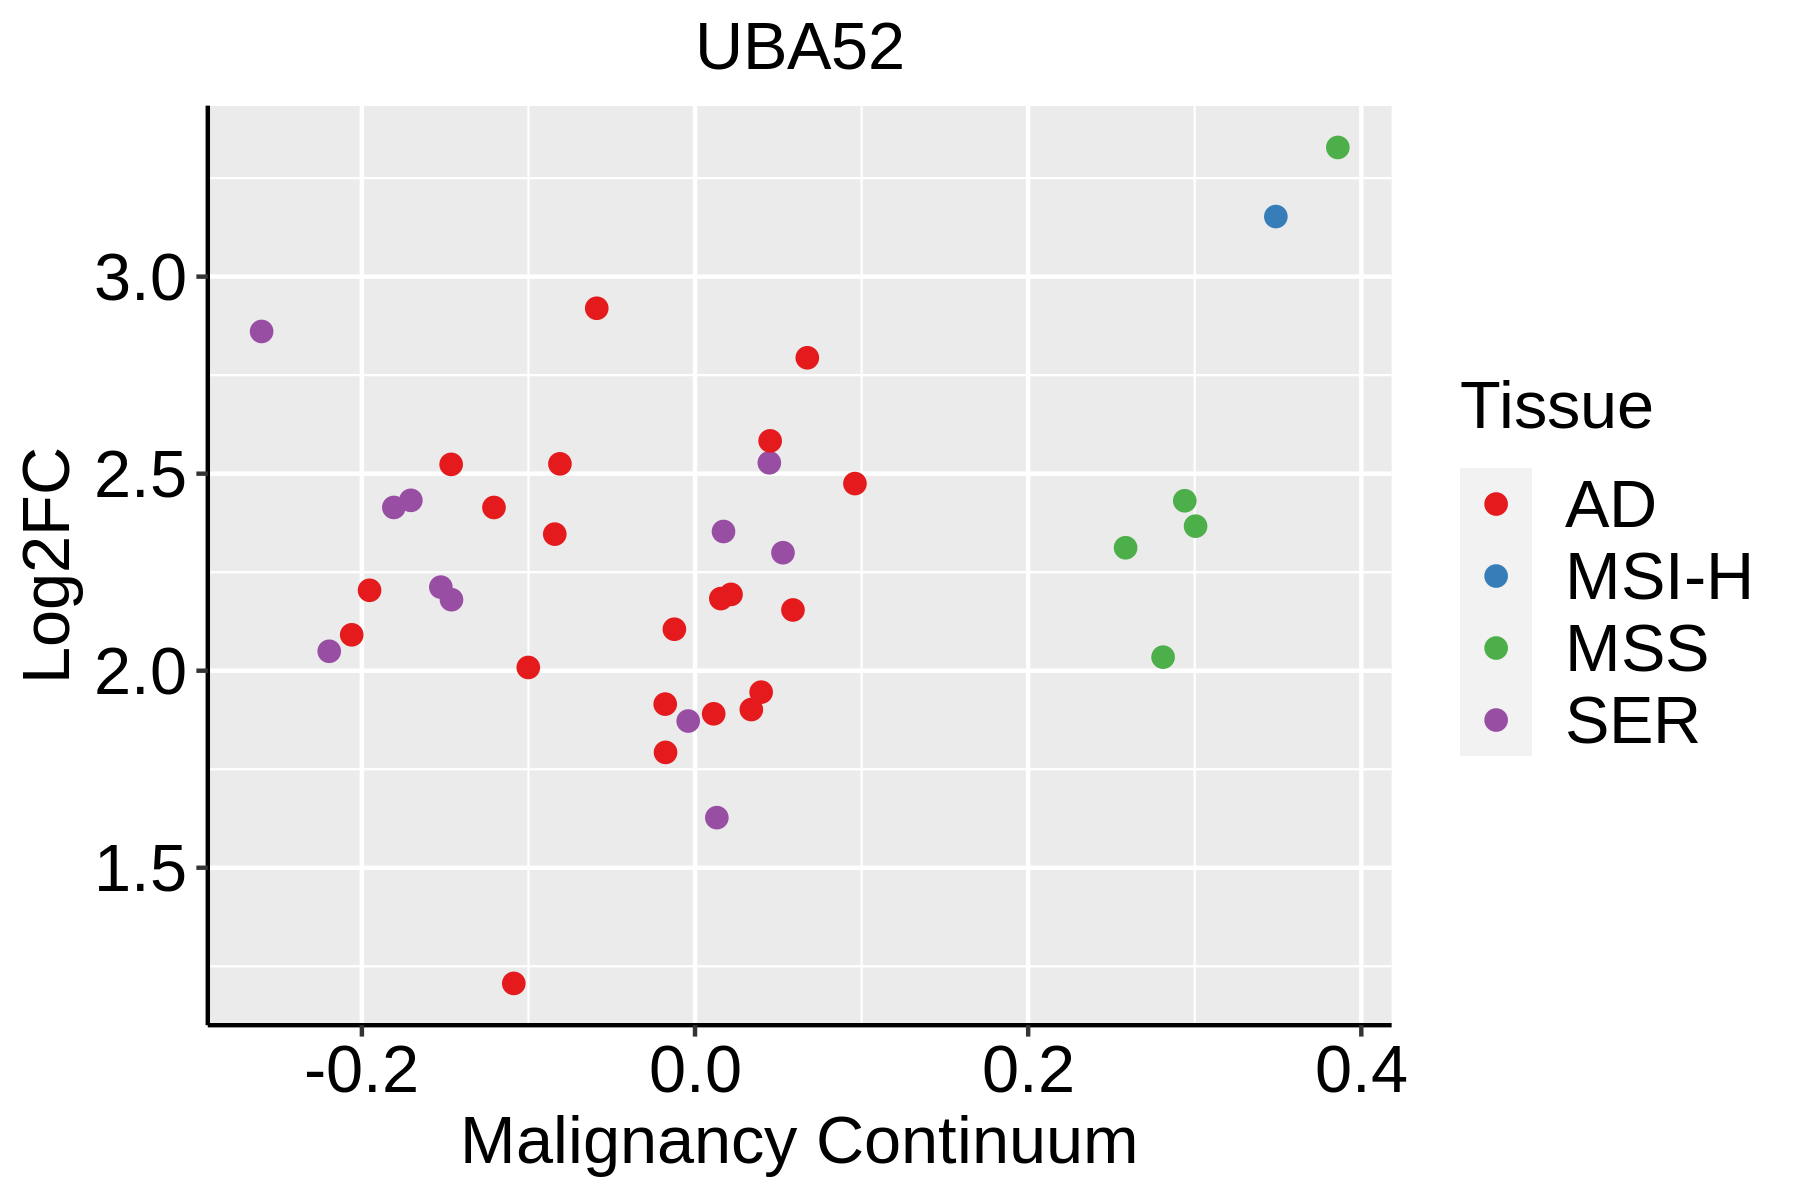 | AD: Adenomas |
| SER: Sessile serrated lesions | ||
| MSI-H: Microsatellite-high colorectal cancer | ||
| MSS: Microsatellite stable colorectal cancer | ||
| Endometrium | 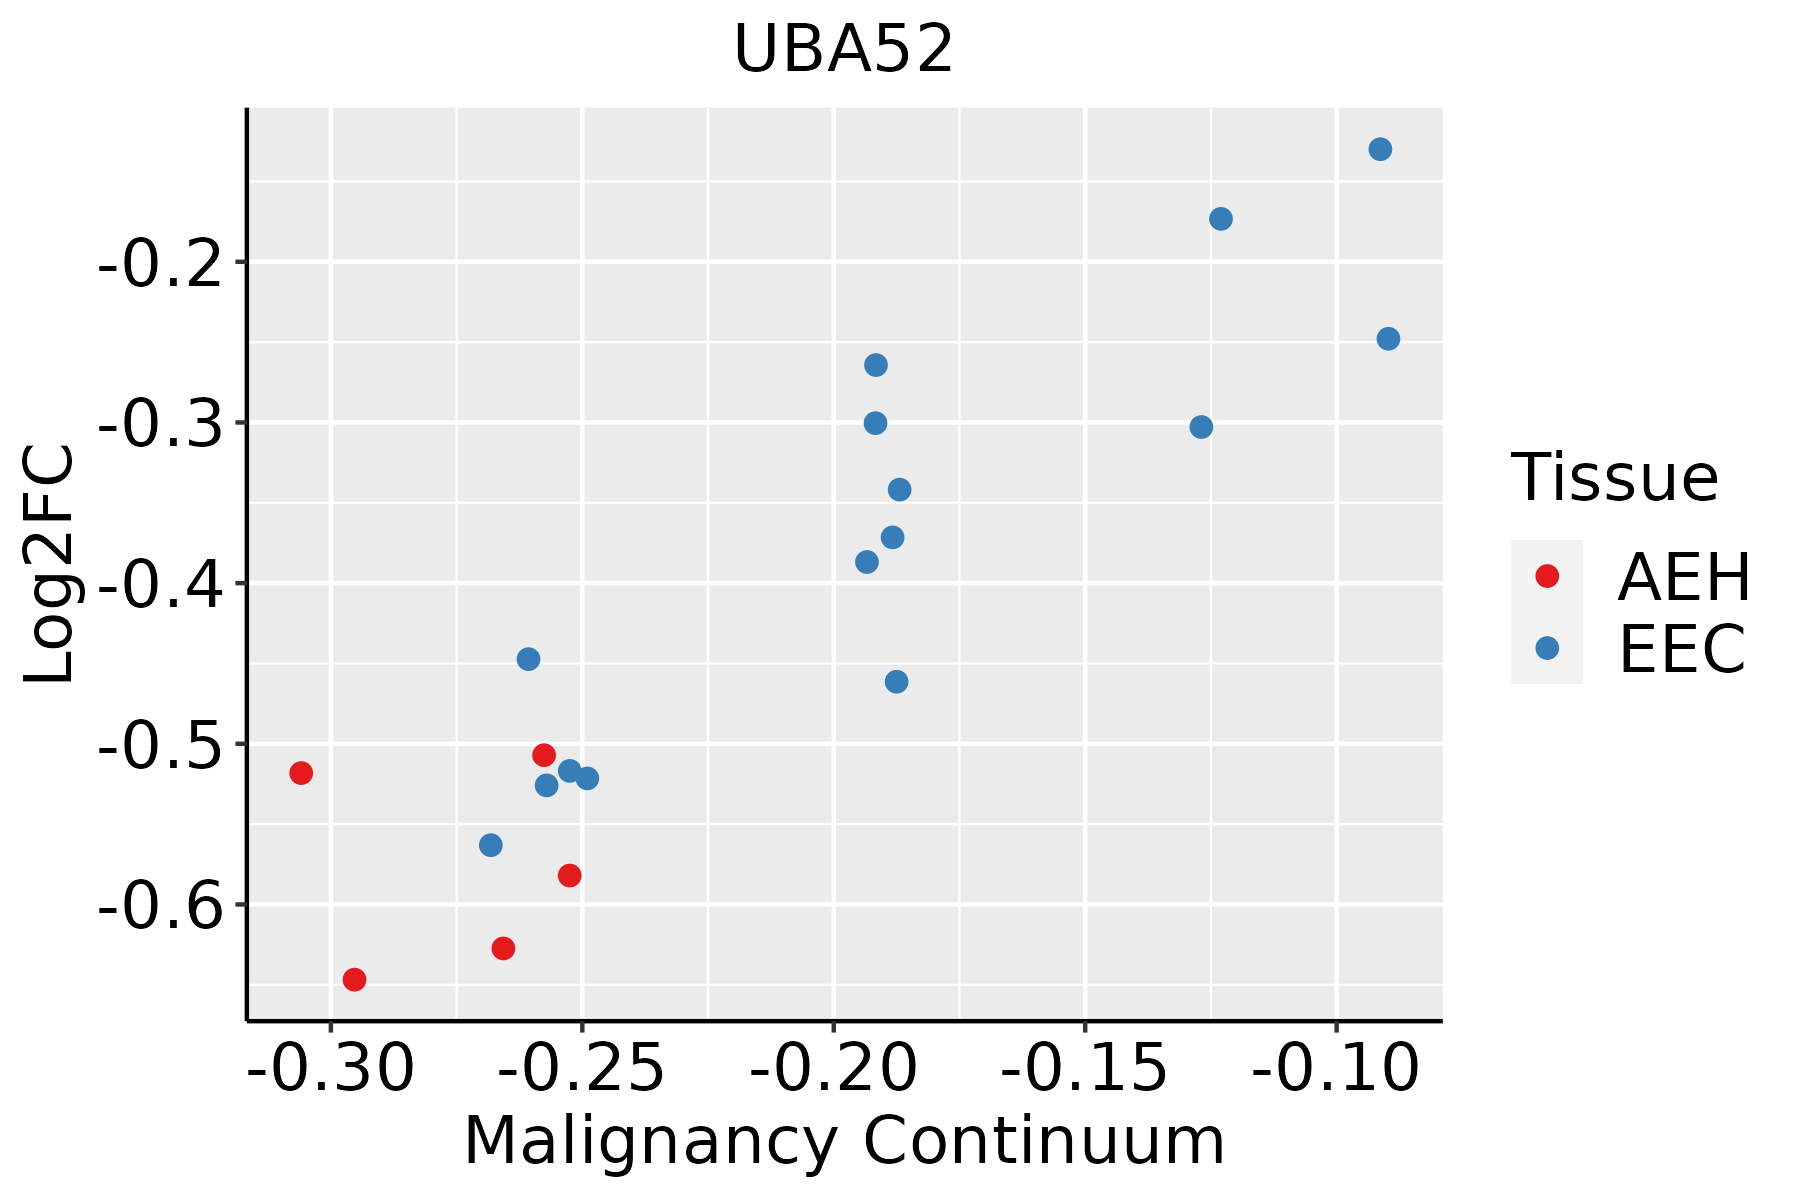 | AEH: Atypical endometrial hyperplasia |
| EEC: Endometrioid Cancer | ||
| Esophagus | 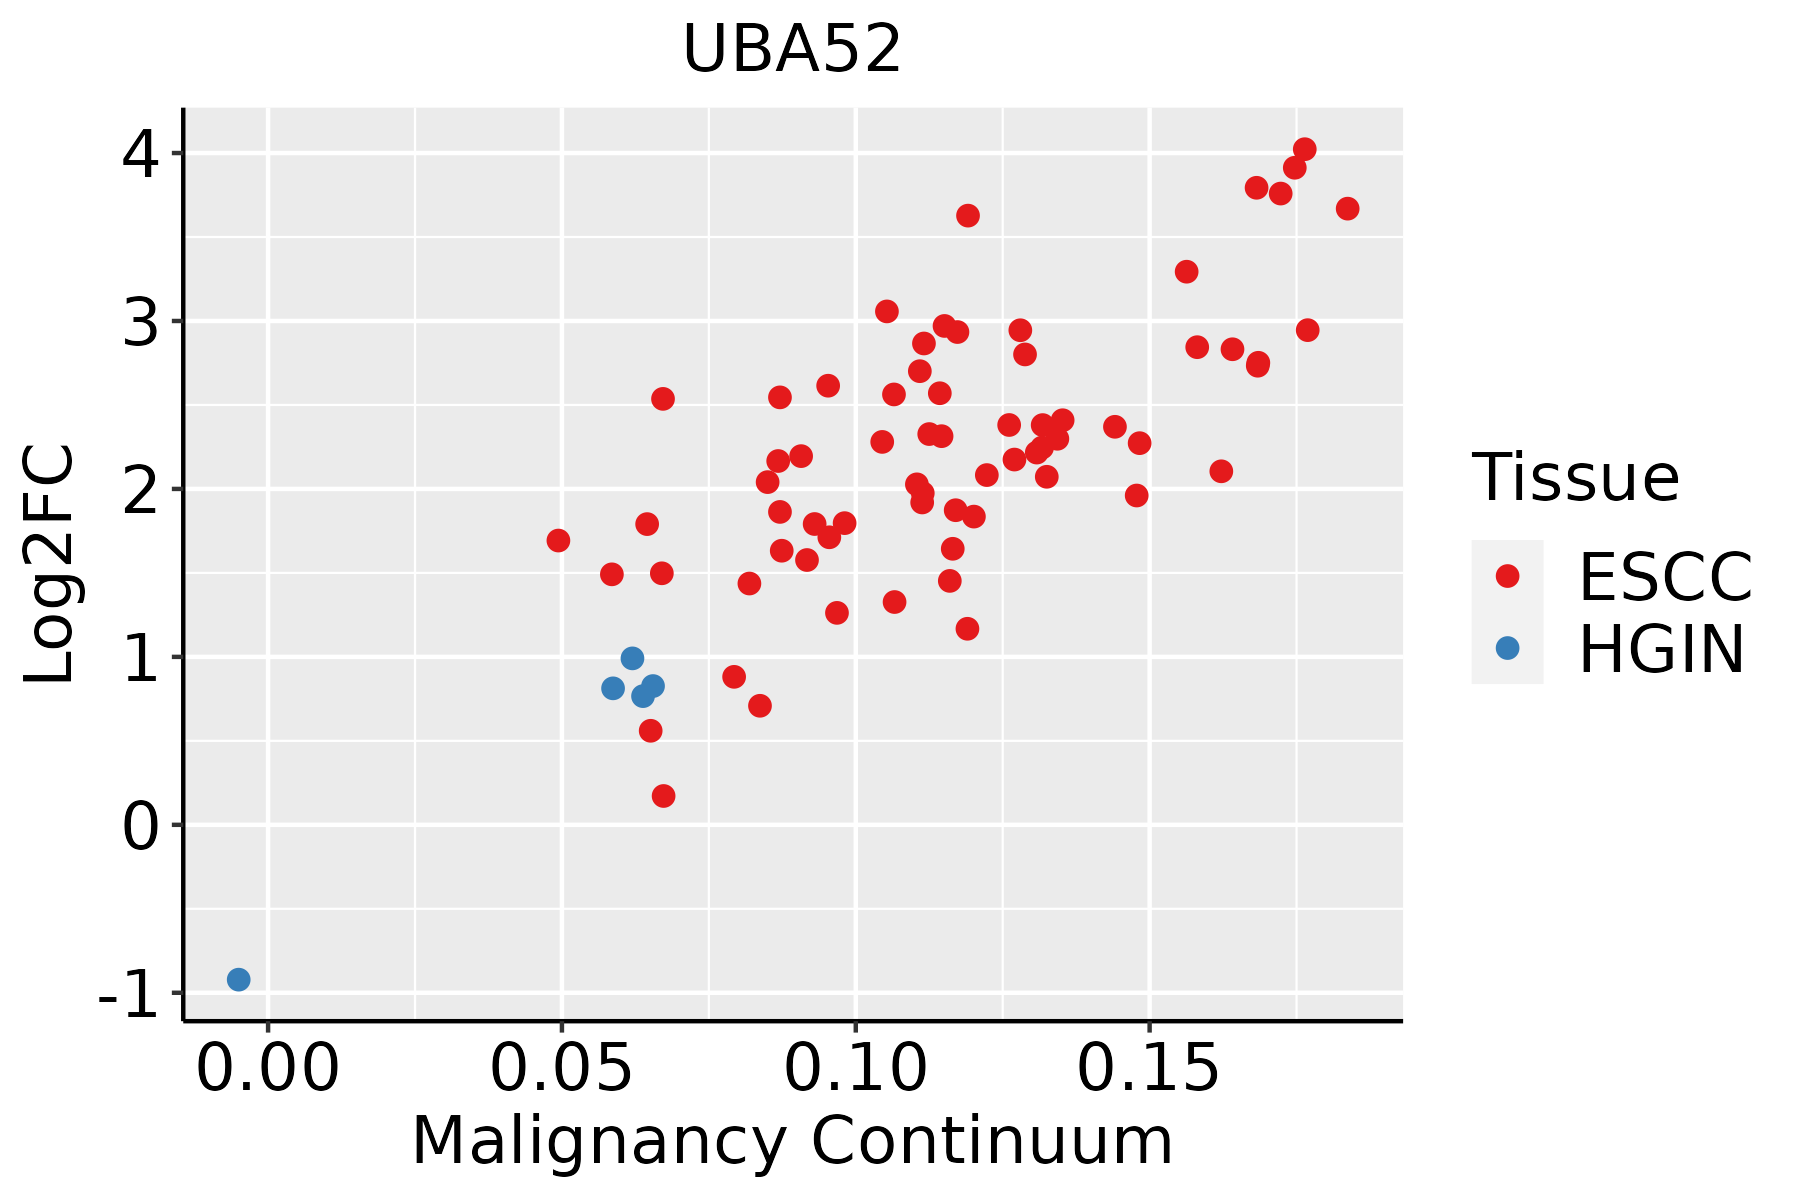 | ESCC: Esophageal squamous cell carcinoma |
| HGIN: High-grade intraepithelial neoplasias | ||
| LGIN: Low-grade intraepithelial neoplasias | ||
| Liver | 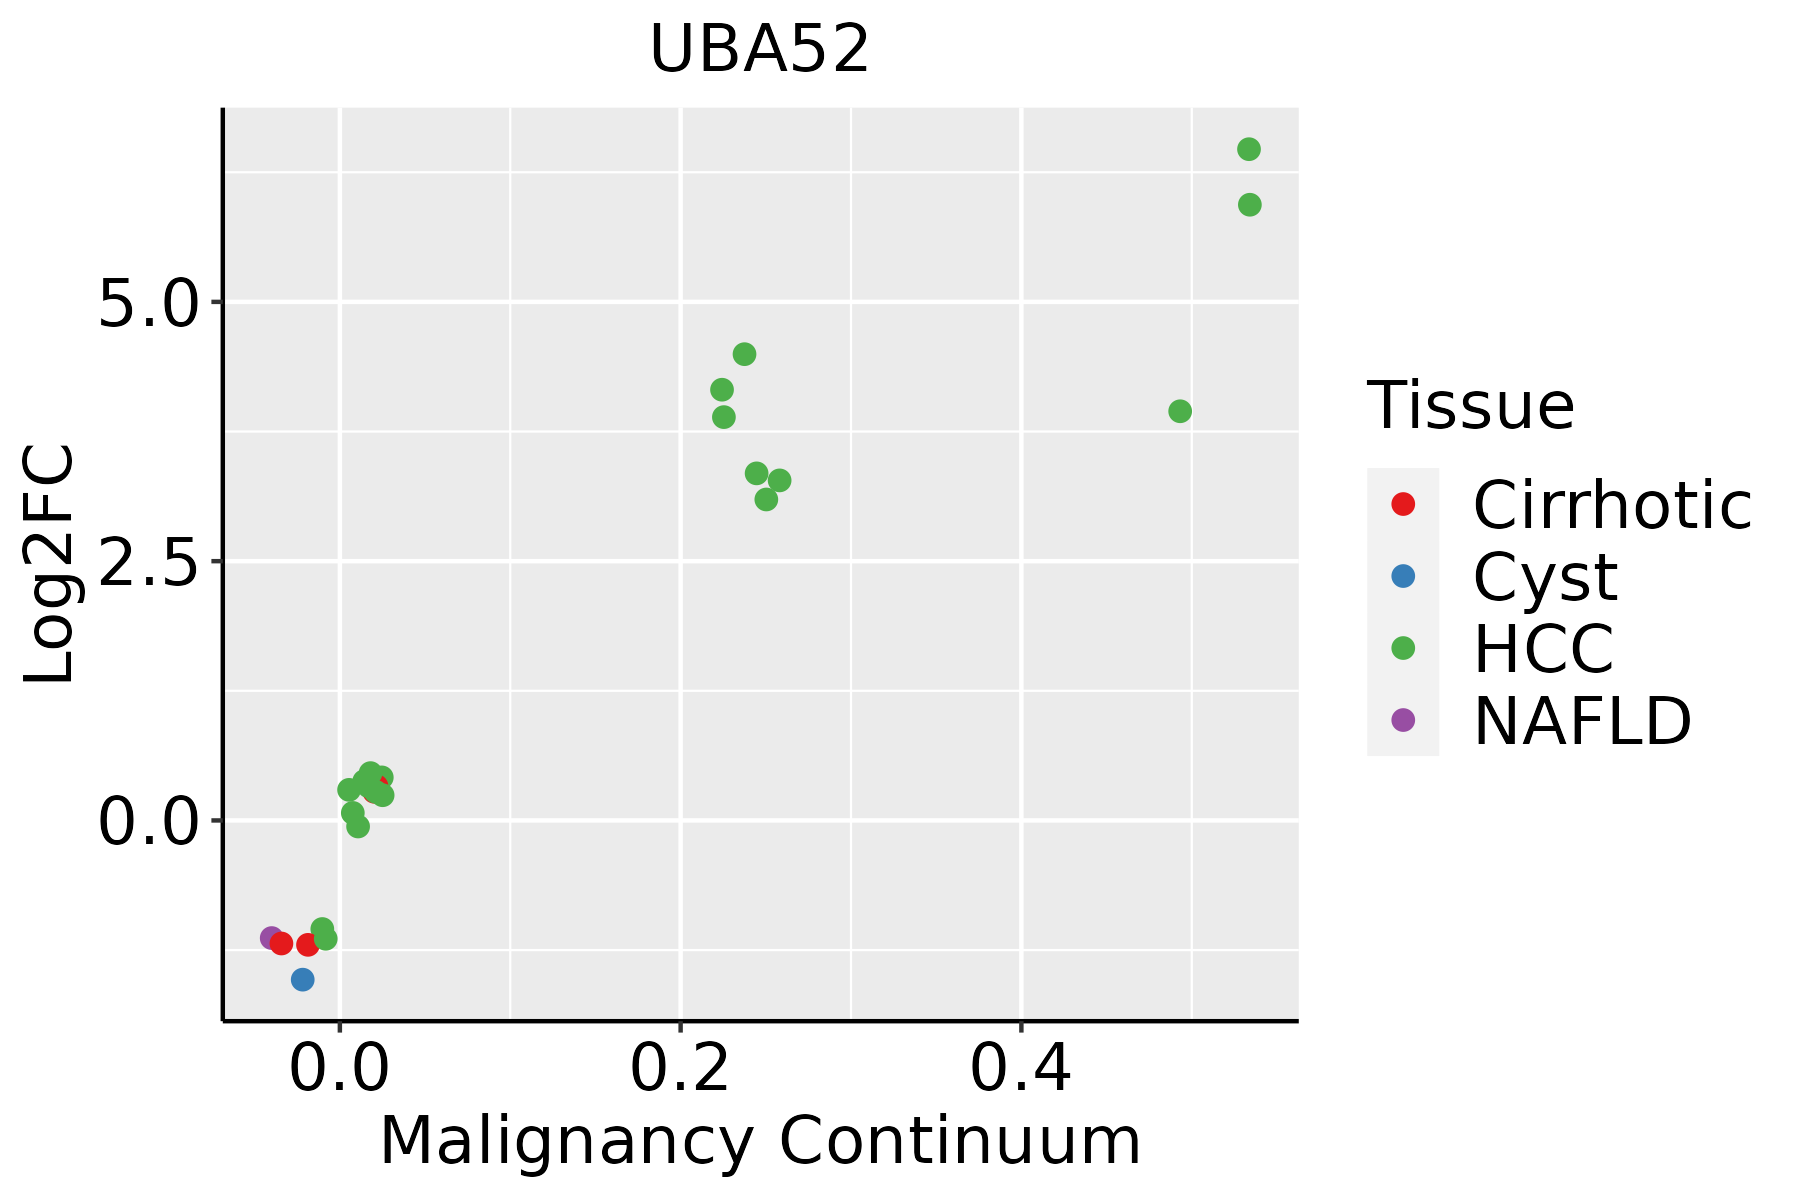 | HCC: Hepatocellular carcinoma |
| NAFLD: Non-alcoholic fatty liver disease | ||
| Lung | 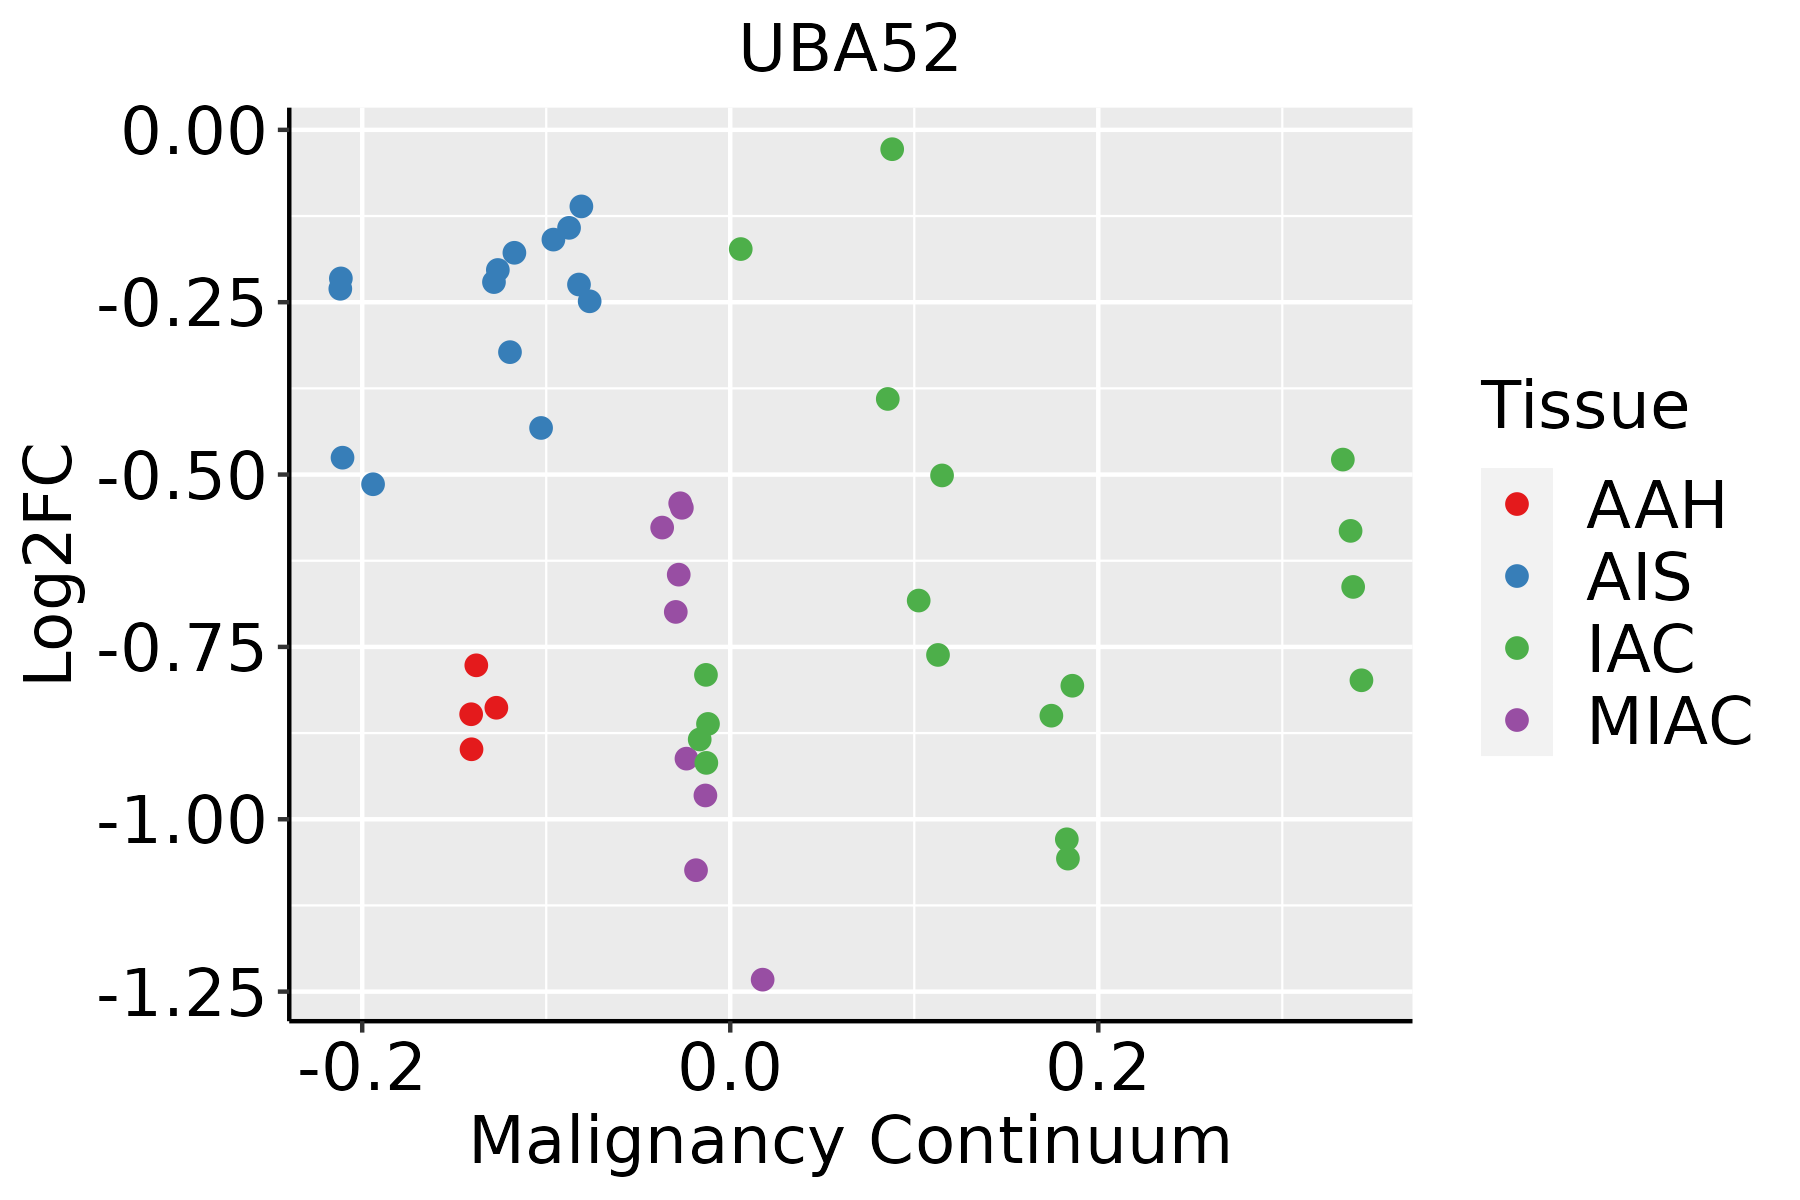 | AAH: Atypical adenomatous hyperplasia |
| AIS: Adenocarcinoma in situ | ||
| IAC: Invasive lung adenocarcinoma | ||
| MIA: Minimally invasive adenocarcinoma | ||
| Oral Cavity | 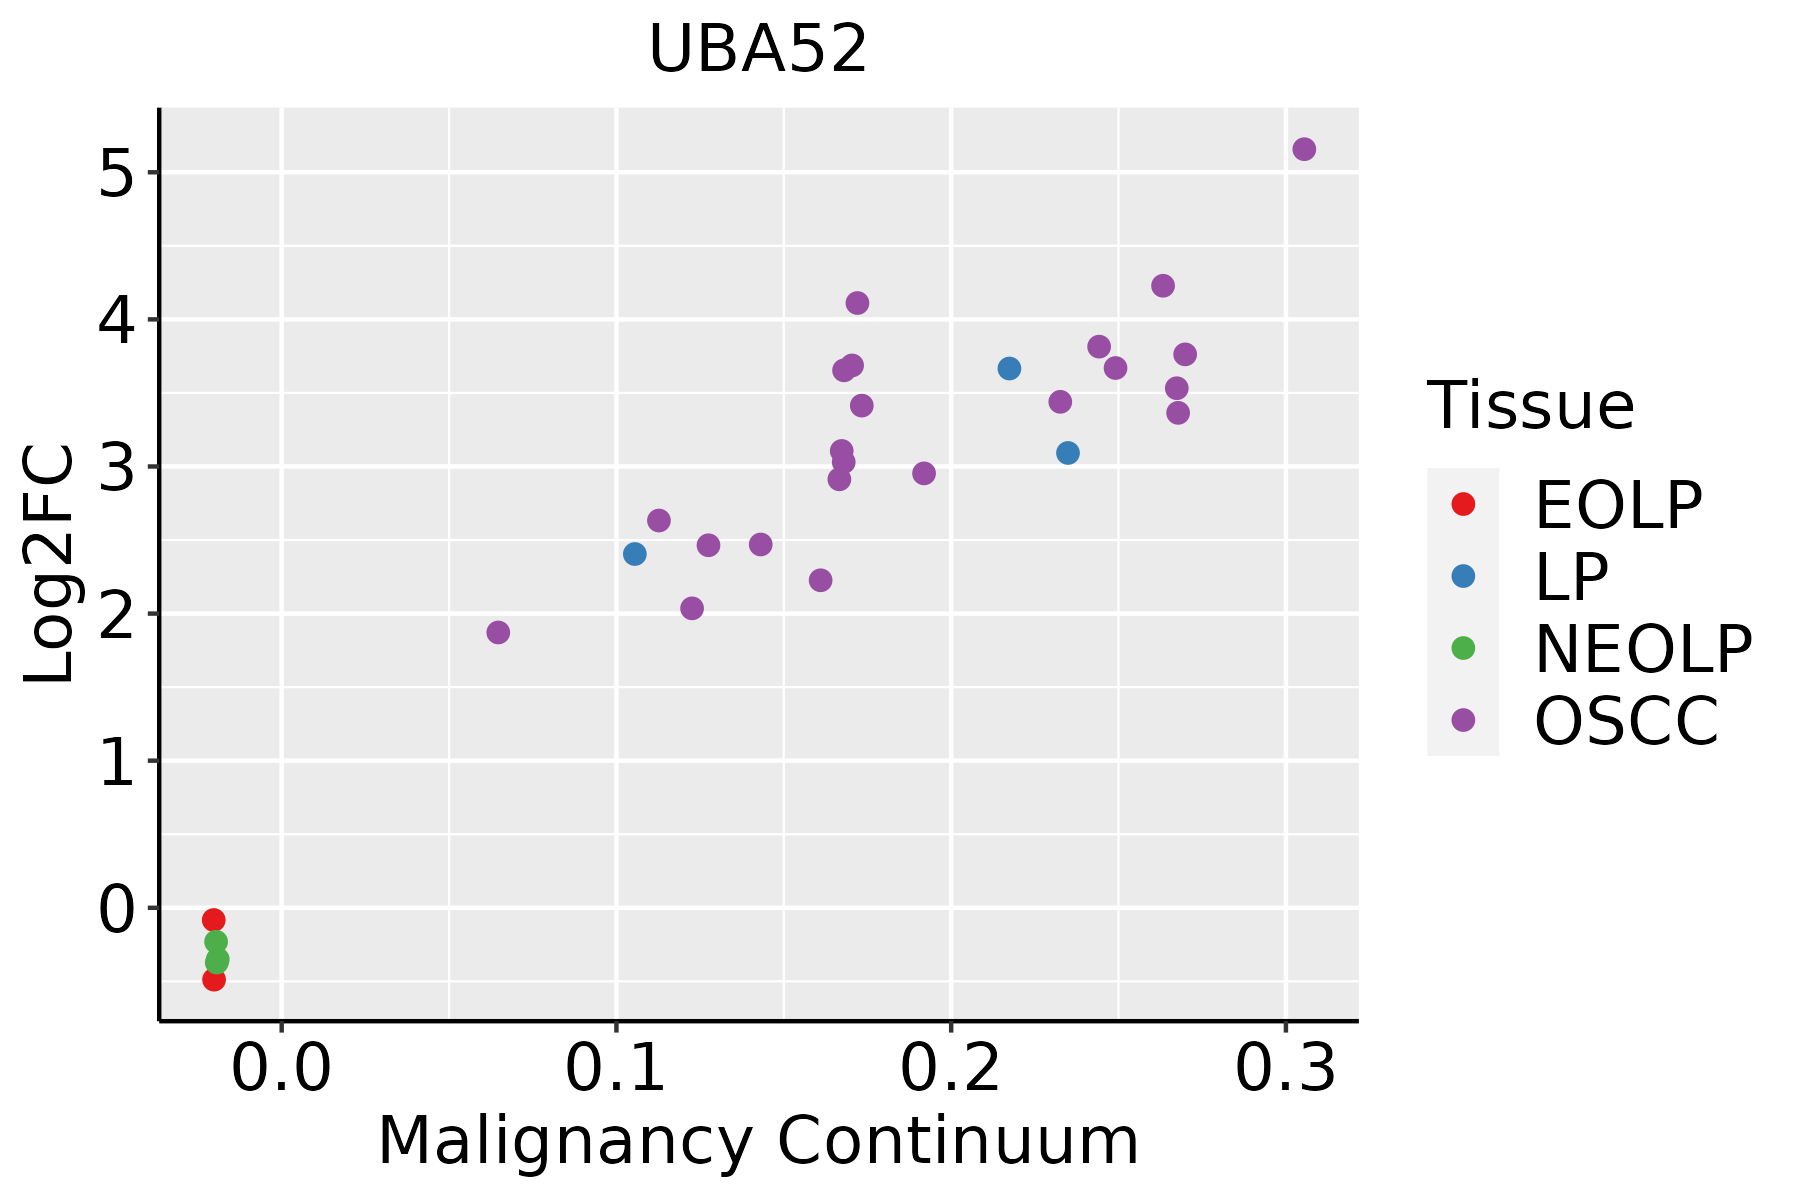 | EOLP: Erosive Oral lichen planus |
| LP: leukoplakia | ||
| NEOLP: Non-erosive oral lichen planus | ||
| OSCC: Oral squamous cell carcinoma | ||
| Prostate | 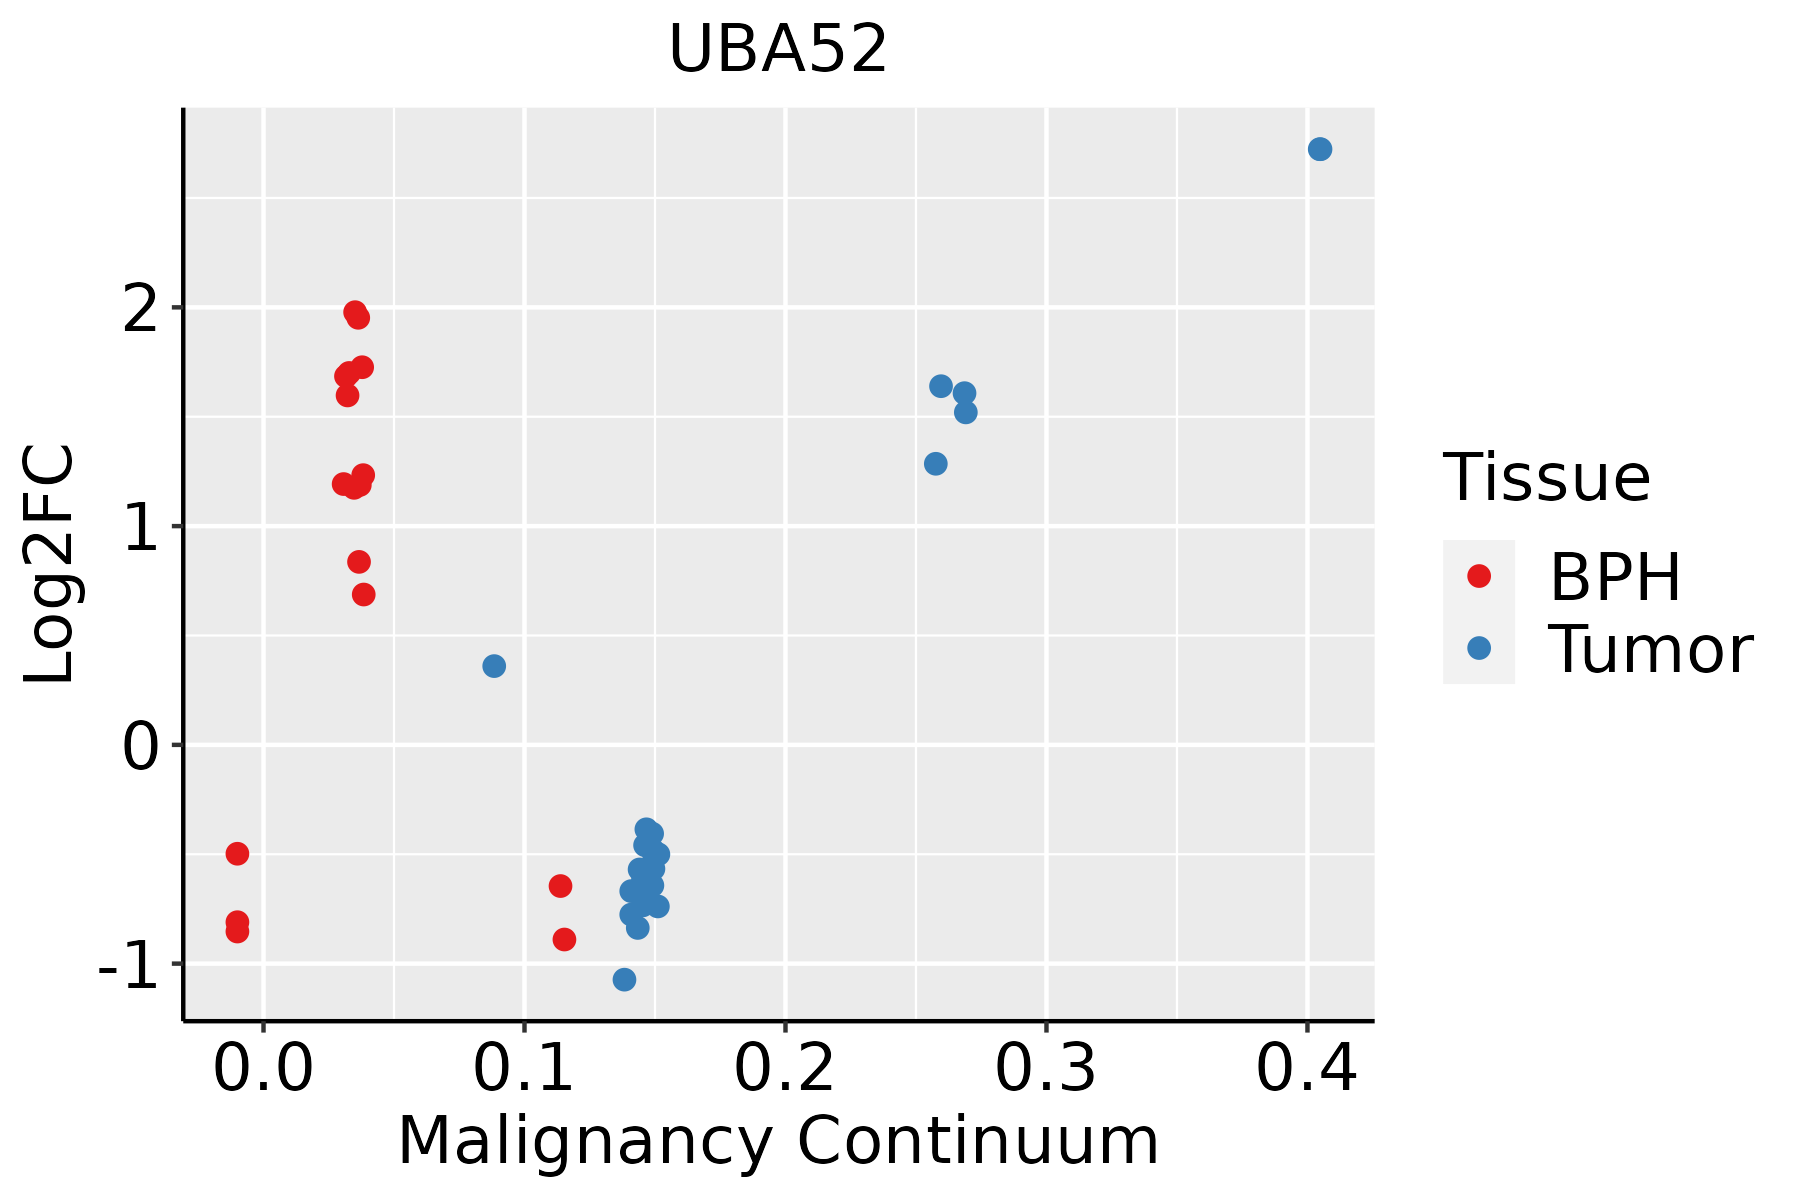 | BPH: Benign Prostatic Hyperplasia |
| Skin | 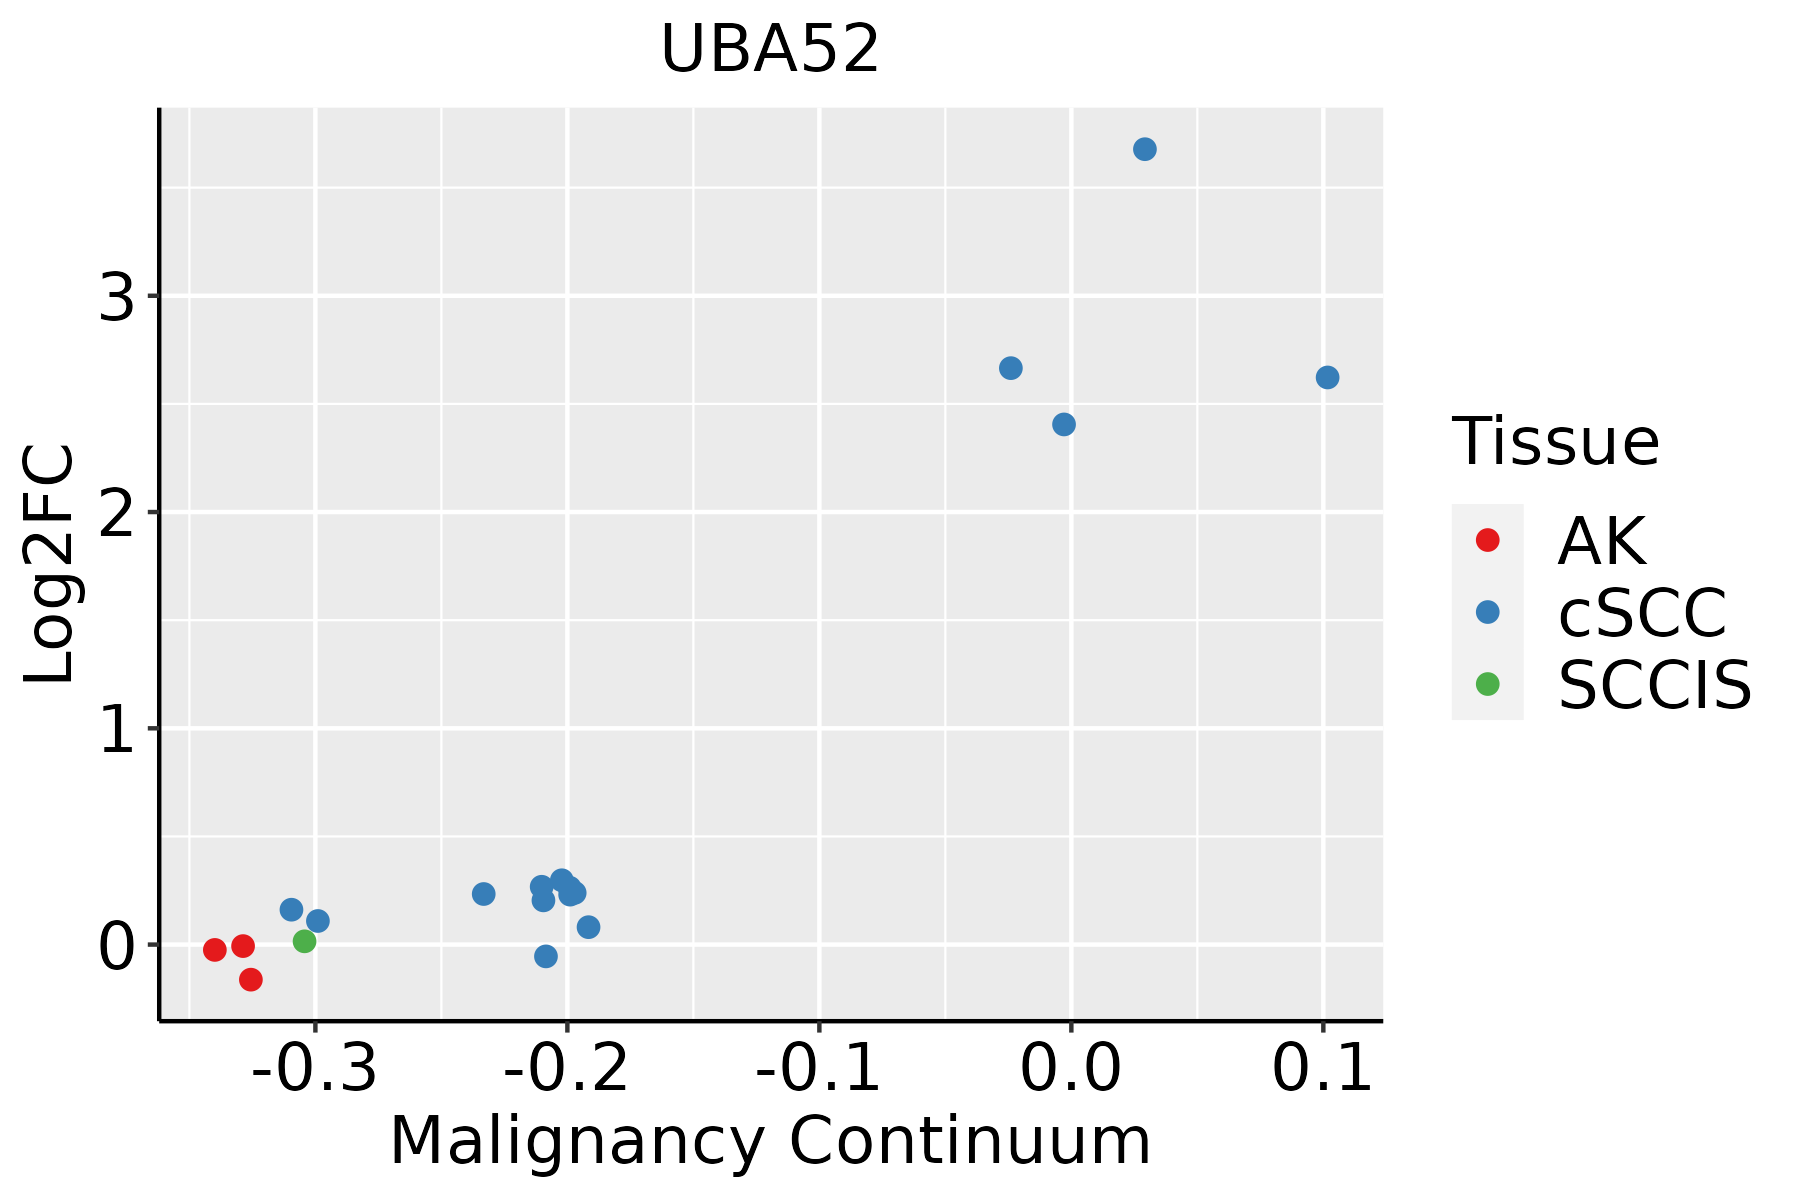 | AK: Actinic keratosis |
| cSCC: Cutaneous squamous cell carcinoma | ||
| SCCIS:squamous cell carcinoma in situ | ||
| Thyroid |  | ATC: Anaplastic thyroid cancer |
| HT: Hashimoto's thyroiditis | ||
| PTC: Papillary thyroid cancer |
| ∗log2FC in expression of this searched gene in stem-like cells from each diseased tissue sample relative to stem-like cells in normal samples in each tissue plotted against the malignancy continuum. Samples are colored based on if they are from different disease stage. |
Top |
Malignant transformation related pathway analysis |
| Find out the enriched GO biological processes and KEGG pathways involved in transition from healthy to precancer to cancer |
| Tissue | Disease Stage | Enriched GO biological Processes |
| Colorectum | AD |  |
| Colorectum | SER |  |
| Colorectum | MSS |  |
| Colorectum | MSI-H |  |
| Colorectum | FAP |  |
| ∗Top 15 enriched GO BP terms are showed in the bar plot of each disease state in each tissue. Each row represents a significant GO biological process which is colored according to the -log10(p.adjust). |
| Page: 1 2 3 4 5 6 7 8 9 |
| GO ID | Tissue | Disease Stage | Description | Gene Ratio | Bg Ratio | pvalue | p.adjust | Count |
| GO:00021819 | Breast | Precancer | cytoplasmic translation | 80/1080 | 148/18723 | 1.59e-59 | 8.54e-56 | 80 |
| GO:00096368 | Breast | Precancer | response to toxic substance | 31/1080 | 262/18723 | 1.18e-04 | 2.12e-03 | 31 |
| GO:000218114 | Breast | IDC | cytoplasmic translation | 82/1434 | 148/18723 | 2.60e-52 | 1.48e-48 | 82 |
| GO:000963613 | Breast | IDC | response to toxic substance | 44/1434 | 262/18723 | 6.33e-07 | 3.00e-05 | 44 |
| GO:000218124 | Breast | DCIS | cytoplasmic translation | 82/1390 | 148/18723 | 2.21e-53 | 1.25e-49 | 82 |
| GO:000963623 | Breast | DCIS | response to toxic substance | 42/1390 | 262/18723 | 1.76e-06 | 6.56e-05 | 42 |
| GO:000218110 | Cervix | CC | cytoplasmic translation | 96/2311 | 148/18723 | 4.87e-51 | 2.91e-47 | 96 |
| GO:00096369 | Cervix | CC | response to toxic substance | 52/2311 | 262/18723 | 3.34e-04 | 3.52e-03 | 52 |
| GO:000218115 | Cervix | HSIL_HPV | cytoplasmic translation | 86/737 | 148/18723 | 3.97e-82 | 1.91e-78 | 86 |
| GO:000963614 | Cervix | HSIL_HPV | response to toxic substance | 24/737 | 262/18723 | 1.14e-04 | 2.36e-03 | 24 |
| GO:000218125 | Cervix | N_HPV | cytoplasmic translation | 42/534 | 148/18723 | 2.61e-30 | 1.19e-26 | 42 |
| GO:000963624 | Cervix | N_HPV | response to toxic substance | 27/534 | 262/18723 | 9.00e-09 | 1.71e-06 | 27 |
| GO:0002181 | Colorectum | AD | cytoplasmic translation | 109/3918 | 148/18723 | 3.40e-43 | 2.13e-39 | 109 |
| GO:0009636 | Colorectum | AD | response to toxic substance | 88/3918 | 262/18723 | 1.12e-06 | 3.72e-05 | 88 |
| GO:00021811 | Colorectum | SER | cytoplasmic translation | 102/2897 | 148/18723 | 1.38e-48 | 8.49e-45 | 102 |
| GO:00096361 | Colorectum | SER | response to toxic substance | 71/2897 | 262/18723 | 8.63e-07 | 4.07e-05 | 71 |
| GO:00021812 | Colorectum | MSS | cytoplasmic translation | 108/3467 | 148/18723 | 1.78e-47 | 1.11e-43 | 108 |
| GO:00096362 | Colorectum | MSS | response to toxic substance | 73/3467 | 262/18723 | 1.26e-04 | 1.94e-03 | 73 |
| GO:00021813 | Colorectum | MSI-H | cytoplasmic translation | 100/1319 | 148/18723 | 1.50e-79 | 8.31e-76 | 100 |
| GO:00021814 | Colorectum | FAP | cytoplasmic translation | 76/2622 | 148/18723 | 3.31e-27 | 2.03e-23 | 76 |
| Page: 1 2 3 4 |
| Pathway ID | Tissue | Disease Stage | Description | Gene Ratio | Bg Ratio | pvalue | p.adjust | qvalue | Count |
| hsa0301018 | Breast | Precancer | Ribosome | 80/684 | 167/8465 | 7.33e-44 | 2.32e-41 | 1.77e-41 | 80 |
| hsa0501218 | Breast | Precancer | Parkinson disease | 99/684 | 266/8465 | 3.58e-42 | 5.65e-40 | 4.33e-40 | 99 |
| hsa0517118 | Breast | Precancer | Coronavirus disease - COVID-19 | 81/684 | 232/8465 | 3.74e-32 | 2.36e-30 | 1.81e-30 | 81 |
| hsa0502216 | Breast | Precancer | Pathways of neurodegeneration - multiple diseases | 112/684 | 476/8465 | 6.96e-27 | 2.44e-25 | 1.87e-25 | 112 |
| hsa0513118 | Breast | Precancer | Shigellosis | 44/684 | 247/8465 | 3.91e-07 | 6.86e-06 | 5.26e-06 | 44 |
| hsa0516718 | Breast | Precancer | Kaposi sarcoma-associated herpesvirus infection | 36/684 | 194/8465 | 1.68e-06 | 2.53e-05 | 1.94e-05 | 36 |
| hsa0413716 | Breast | Precancer | Mitophagy - animal | 15/684 | 72/8465 | 5.22e-04 | 3.93e-03 | 3.01e-03 | 15 |
| hsa0301019 | Breast | Precancer | Ribosome | 80/684 | 167/8465 | 7.33e-44 | 2.32e-41 | 1.77e-41 | 80 |
| hsa0501219 | Breast | Precancer | Parkinson disease | 99/684 | 266/8465 | 3.58e-42 | 5.65e-40 | 4.33e-40 | 99 |
| hsa0517119 | Breast | Precancer | Coronavirus disease - COVID-19 | 81/684 | 232/8465 | 3.74e-32 | 2.36e-30 | 1.81e-30 | 81 |
| hsa0502217 | Breast | Precancer | Pathways of neurodegeneration - multiple diseases | 112/684 | 476/8465 | 6.96e-27 | 2.44e-25 | 1.87e-25 | 112 |
| hsa0513119 | Breast | Precancer | Shigellosis | 44/684 | 247/8465 | 3.91e-07 | 6.86e-06 | 5.26e-06 | 44 |
| hsa0516719 | Breast | Precancer | Kaposi sarcoma-associated herpesvirus infection | 36/684 | 194/8465 | 1.68e-06 | 2.53e-05 | 1.94e-05 | 36 |
| hsa0413717 | Breast | Precancer | Mitophagy - animal | 15/684 | 72/8465 | 5.22e-04 | 3.93e-03 | 3.01e-03 | 15 |
| hsa0501224 | Breast | IDC | Parkinson disease | 107/867 | 266/8465 | 2.57e-39 | 8.36e-37 | 6.26e-37 | 107 |
| hsa0301024 | Breast | IDC | Ribosome | 83/867 | 167/8465 | 6.07e-39 | 9.87e-37 | 7.38e-37 | 83 |
| hsa0517124 | Breast | IDC | Coronavirus disease - COVID-19 | 86/867 | 232/8465 | 1.50e-28 | 9.72e-27 | 7.27e-27 | 86 |
| hsa0502223 | Breast | IDC | Pathways of neurodegeneration - multiple diseases | 116/867 | 476/8465 | 3.63e-20 | 1.18e-18 | 8.82e-19 | 116 |
| hsa0513124 | Breast | IDC | Shigellosis | 47/867 | 247/8465 | 1.78e-05 | 2.00e-04 | 1.49e-04 | 47 |
| hsa0516723 | Breast | IDC | Kaposi sarcoma-associated herpesvirus infection | 38/867 | 194/8465 | 5.87e-05 | 5.96e-04 | 4.46e-04 | 38 |
| Page: 1 2 3 4 5 6 7 8 9 10 11 12 13 14 15 16 17 18 19 20 |
Top |
Cell-cell communication analysis |
| Identification of potential cell-cell interactions between two cell types and their ligand-receptor pairs for different disease states |
| Ligand | Receptor | LRpair | Pathway | Tissue | Disease Stage |
| Page: 1 |
Top |
Single-cell gene regulatory network inference analysis |
| Find out the significant the regulons (TFs) and the target genes of each regulon across cell types for different disease states |
| TF | Cell Type | Tissue | Disease Stage | Target Gene | RSS | Regulon Activity |
| ∗The dot plots of a searched regulon are shown for all cell subpopulations in each disease state of each tissue based on the regulon specific score inferred using pySCENIC and by calculating the average expression. |
| Page: 1 |
Top |
Somatic mutation of malignant transformation related genes |
| Annotation of somatic variants for genes involved in malignant transformation |
| Hugo Symbol | Variant Class | Variant Classification | dbSNP RS | HGVSc | HGVSp | HGVSp Short | SWISSPROT | BIOTYPE | SIFT | PolyPhen | Tumor Sample Barcode | Tissue | Histology | Sex | Age | Stage | Therapy Types | Drugs | Outcome |
| UBA52 | SNV | Missense_Mutation | c.268N>T | p.Asn90Tyr | p.N90Y | P62987 | protein_coding | deleterious(0) | possibly_damaging(0.857) | TCGA-D8-A1XK-01 | Breast | breast invasive carcinoma | Female | <65 | I/II | Chemotherapy | doxorubicine+cyclophosphamide | SD | |
| UBA52 | SNV | Missense_Mutation | c.310N>T | p.His104Tyr | p.H104Y | P62987 | protein_coding | deleterious(0.04) | benign(0.317) | TCGA-E9-A1R4-01 | Breast | breast invasive carcinoma | Female | >=65 | I/II | Chemotherapy | 5-fluorouracil | SD | |
| UBA52 | SNV | Missense_Mutation | novel | c.170N>T | p.Ser57Leu | p.S57L | P62987 | protein_coding | deleterious(0.04) | benign(0.3) | TCGA-C5-A1MP-01 | Cervix | cervical & endocervical cancer | Female | <65 | I/II | Unknown | Unknown | SD |
| UBA52 | SNV | Missense_Mutation | rs563262392 | c.316N>T | p.Arg106Cys | p.R106C | P62987 | protein_coding | tolerated(0.16) | benign(0) | TCGA-A6-2686-01 | Colorectum | colon adenocarcinoma | Female | >=65 | I/II | Unknown | Unknown | SD |
| UBA52 | SNV | Missense_Mutation | c.212N>C | p.Leu71Ser | p.L71S | P62987 | protein_coding | deleterious(0) | probably_damaging(0.999) | TCGA-AA-3710-01 | Colorectum | colon adenocarcinoma | Female | >=65 | I/II | Unknown | Unknown | SD | |
| UBA52 | SNV | Missense_Mutation | c.281N>C | p.Met94Thr | p.M94T | P62987 | protein_coding | tolerated(0.06) | benign(0.006) | TCGA-AA-3715-01 | Colorectum | colon adenocarcinoma | Male | >=65 | I/II | Unknown | Unknown | PD | |
| UBA52 | SNV | Missense_Mutation | c.22N>A | p.Leu8Ile | p.L8I | P62987 | protein_coding | deleterious(0) | probably_damaging(0.995) | TCGA-CM-6162-01 | Colorectum | colon adenocarcinoma | Female | <65 | III/IV | Chemotherapy | oxaliplatin | SD | |
| UBA52 | SNV | Missense_Mutation | novel | c.77T>C | p.Val26Ala | p.V26A | P62987 | protein_coding | deleterious(0) | possibly_damaging(0.595) | TCGA-AP-A1DR-01 | Endometrium | uterine corpus endometrioid carcinoma | Female | <65 | III/IV | Chemotherapy | cisplatin | SD |
| UBA52 | SNV | Missense_Mutation | novel | c.72N>T | p.Glu24Asp | p.E24D | P62987 | protein_coding | tolerated(0.62) | benign(0.148) | TCGA-AX-A2HC-01 | Endometrium | uterine corpus endometrioid carcinoma | Female | <65 | III/IV | Chemotherapy | paclitaxel | PD |
| UBA52 | SNV | Missense_Mutation | c.124N>G | p.Arg42Gly | p.R42G | P62987 | protein_coding | deleterious(0) | benign(0.071) | TCGA-BK-A0CB-01 | Endometrium | uterine corpus endometrioid carcinoma | Female | <65 | III/IV | Chemotherapy | carboplatin | SD |
| Page: 1 2 |
Top |
Related drugs of malignant transformation related genes |
| Identification of chemicals and drugs interact with genes involved in malignant transfromation |
| (DGIdb 4.0) |
| Entrez ID | Symbol | Category | Interaction Types | Drug Claim Name | Drug Name | PMIDs |
| Page: 1 |

Copyright 2023-Present -The University of Texas Health Science Center at Houston |