
|
|||||
|
 | |
| |
| |
| |
| |
| |
|
Gene: UBA5 |
Gene summary for UBA5 |
| Gene information | Species | Human | Gene symbol | UBA5 | Gene ID | 79876 |
| Gene name | ubiquitin like modifier activating enzyme 5 | |
| Gene Alias | DEE44 | |
| Cytomap | 3q22.1 | |
| Gene Type | protein-coding | GO ID | GO:0002262 | UniProtAcc | Q9GZZ9 |
Top |
Malignant transformation analysis |
| Identification of the aberrant gene expression in precancerous and cancerous lesions by comparing the gene expression of stem-like cells in diseased tissues with normal stem cells |
| Entrez ID | Symbol | Replicates | Species | Organ | Tissue | Adj P-value | Log2FC | Malignancy |
| 79876 | UBA5 | LZE2T | Human | Esophagus | ESCC | 3.68e-06 | 7.71e-01 | 0.082 |
| 79876 | UBA5 | LZE4T | Human | Esophagus | ESCC | 1.82e-16 | 4.13e-01 | 0.0811 |
| 79876 | UBA5 | LZE7T | Human | Esophagus | ESCC | 6.77e-06 | 5.88e-01 | 0.0667 |
| 79876 | UBA5 | LZE8T | Human | Esophagus | ESCC | 6.14e-10 | 2.32e-01 | 0.067 |
| 79876 | UBA5 | LZE24T | Human | Esophagus | ESCC | 3.76e-17 | 3.82e-01 | 0.0596 |
| 79876 | UBA5 | LZE6T | Human | Esophagus | ESCC | 1.69e-06 | 4.31e-01 | 0.0845 |
| 79876 | UBA5 | P1T-E | Human | Esophagus | ESCC | 2.32e-08 | 4.85e-01 | 0.0875 |
| 79876 | UBA5 | P2T-E | Human | Esophagus | ESCC | 2.24e-57 | 9.65e-01 | 0.1177 |
| 79876 | UBA5 | P4T-E | Human | Esophagus | ESCC | 2.11e-30 | 8.77e-01 | 0.1323 |
| 79876 | UBA5 | P5T-E | Human | Esophagus | ESCC | 2.68e-16 | 4.38e-01 | 0.1327 |
| 79876 | UBA5 | P8T-E | Human | Esophagus | ESCC | 3.77e-22 | 4.64e-01 | 0.0889 |
| 79876 | UBA5 | P9T-E | Human | Esophagus | ESCC | 3.01e-17 | 4.67e-01 | 0.1131 |
| 79876 | UBA5 | P10T-E | Human | Esophagus | ESCC | 4.45e-36 | 6.70e-01 | 0.116 |
| 79876 | UBA5 | P11T-E | Human | Esophagus | ESCC | 3.27e-11 | 5.00e-01 | 0.1426 |
| 79876 | UBA5 | P12T-E | Human | Esophagus | ESCC | 5.15e-27 | 4.01e-01 | 0.1122 |
| 79876 | UBA5 | P15T-E | Human | Esophagus | ESCC | 3.55e-28 | 6.63e-01 | 0.1149 |
| 79876 | UBA5 | P16T-E | Human | Esophagus | ESCC | 7.47e-38 | 7.05e-01 | 0.1153 |
| 79876 | UBA5 | P17T-E | Human | Esophagus | ESCC | 6.76e-13 | 3.30e-01 | 0.1278 |
| 79876 | UBA5 | P19T-E | Human | Esophagus | ESCC | 1.73e-02 | 6.12e-01 | 0.1662 |
| 79876 | UBA5 | P20T-E | Human | Esophagus | ESCC | 2.24e-16 | 2.73e-01 | 0.1124 |
| Page: 1 2 3 4 5 6 |
| Tissue | Expression Dynamics | Abbreviation |
| Esophagus | 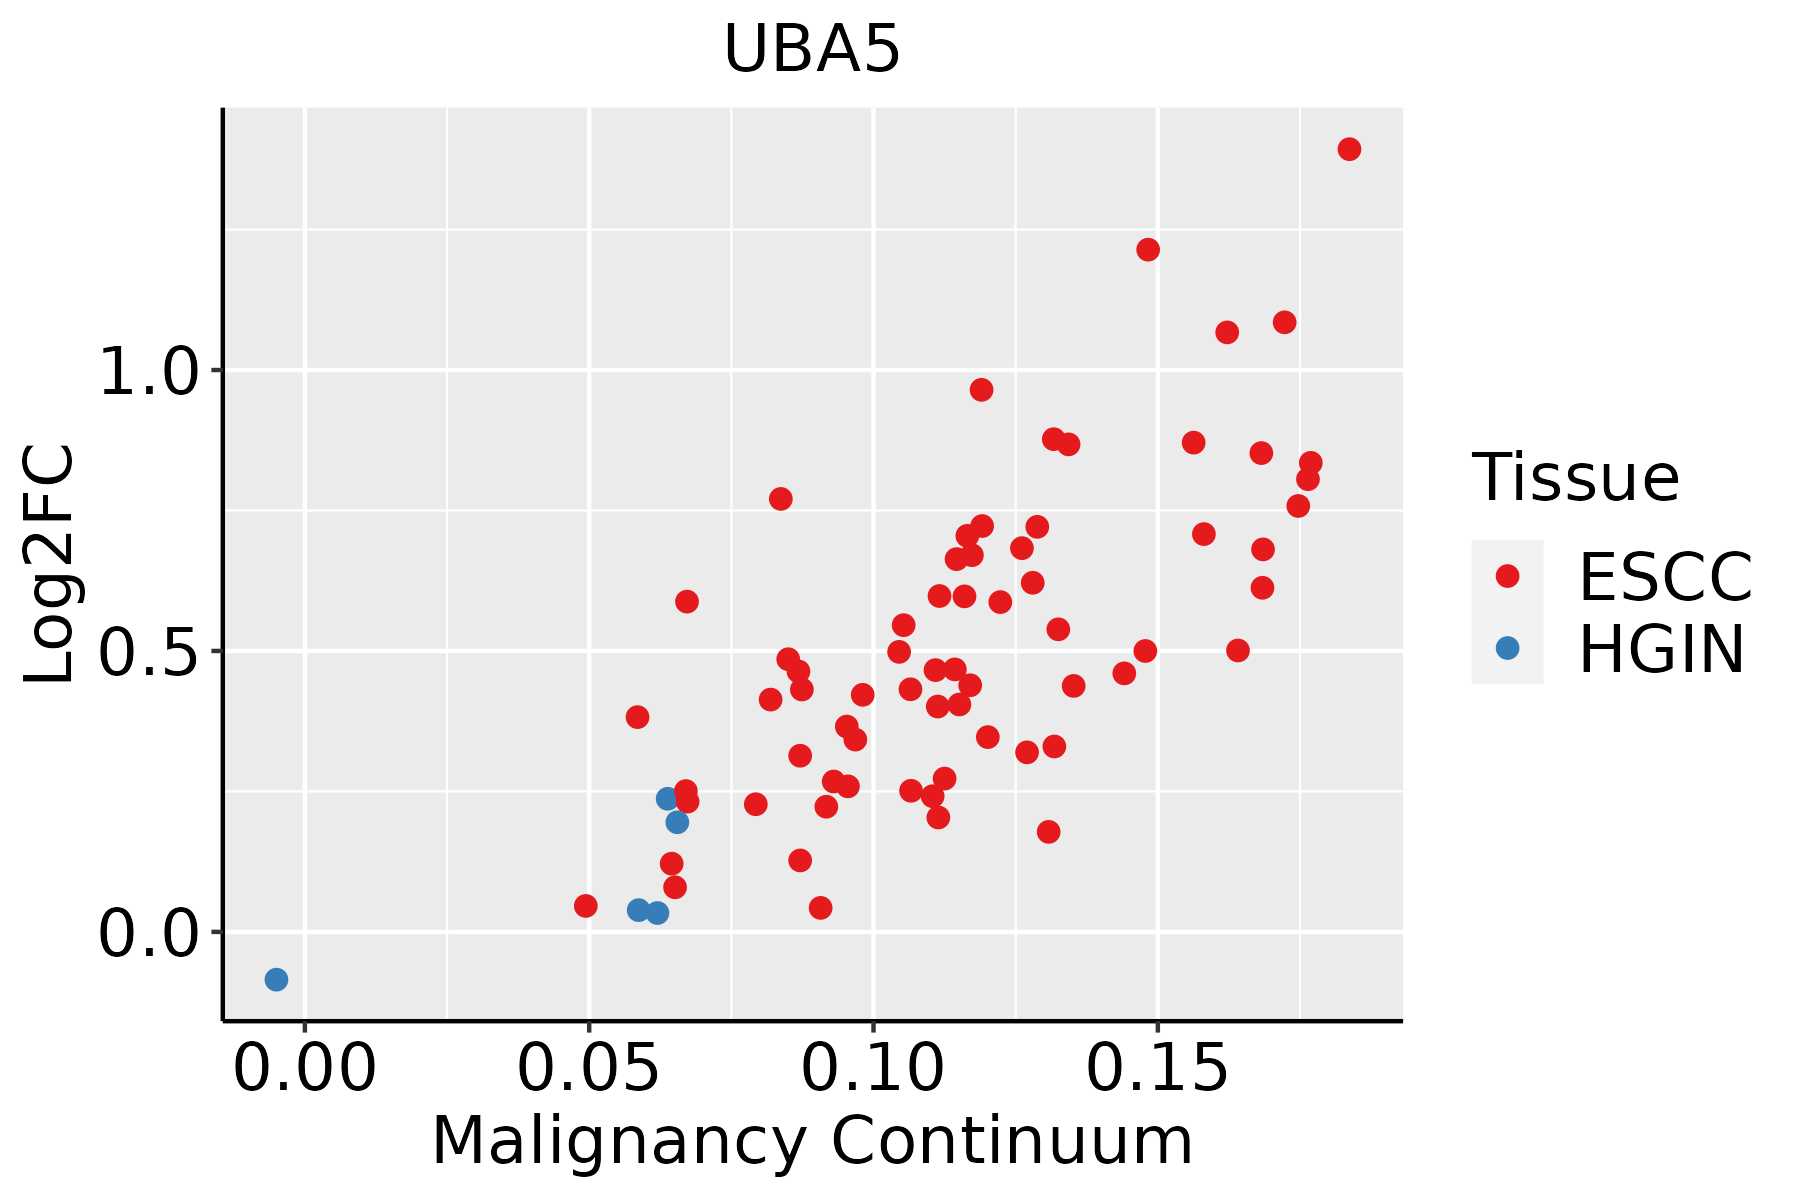 | ESCC: Esophageal squamous cell carcinoma |
| HGIN: High-grade intraepithelial neoplasias | ||
| LGIN: Low-grade intraepithelial neoplasias | ||
| Liver |  | HCC: Hepatocellular carcinoma |
| NAFLD: Non-alcoholic fatty liver disease | ||
| Oral Cavity | 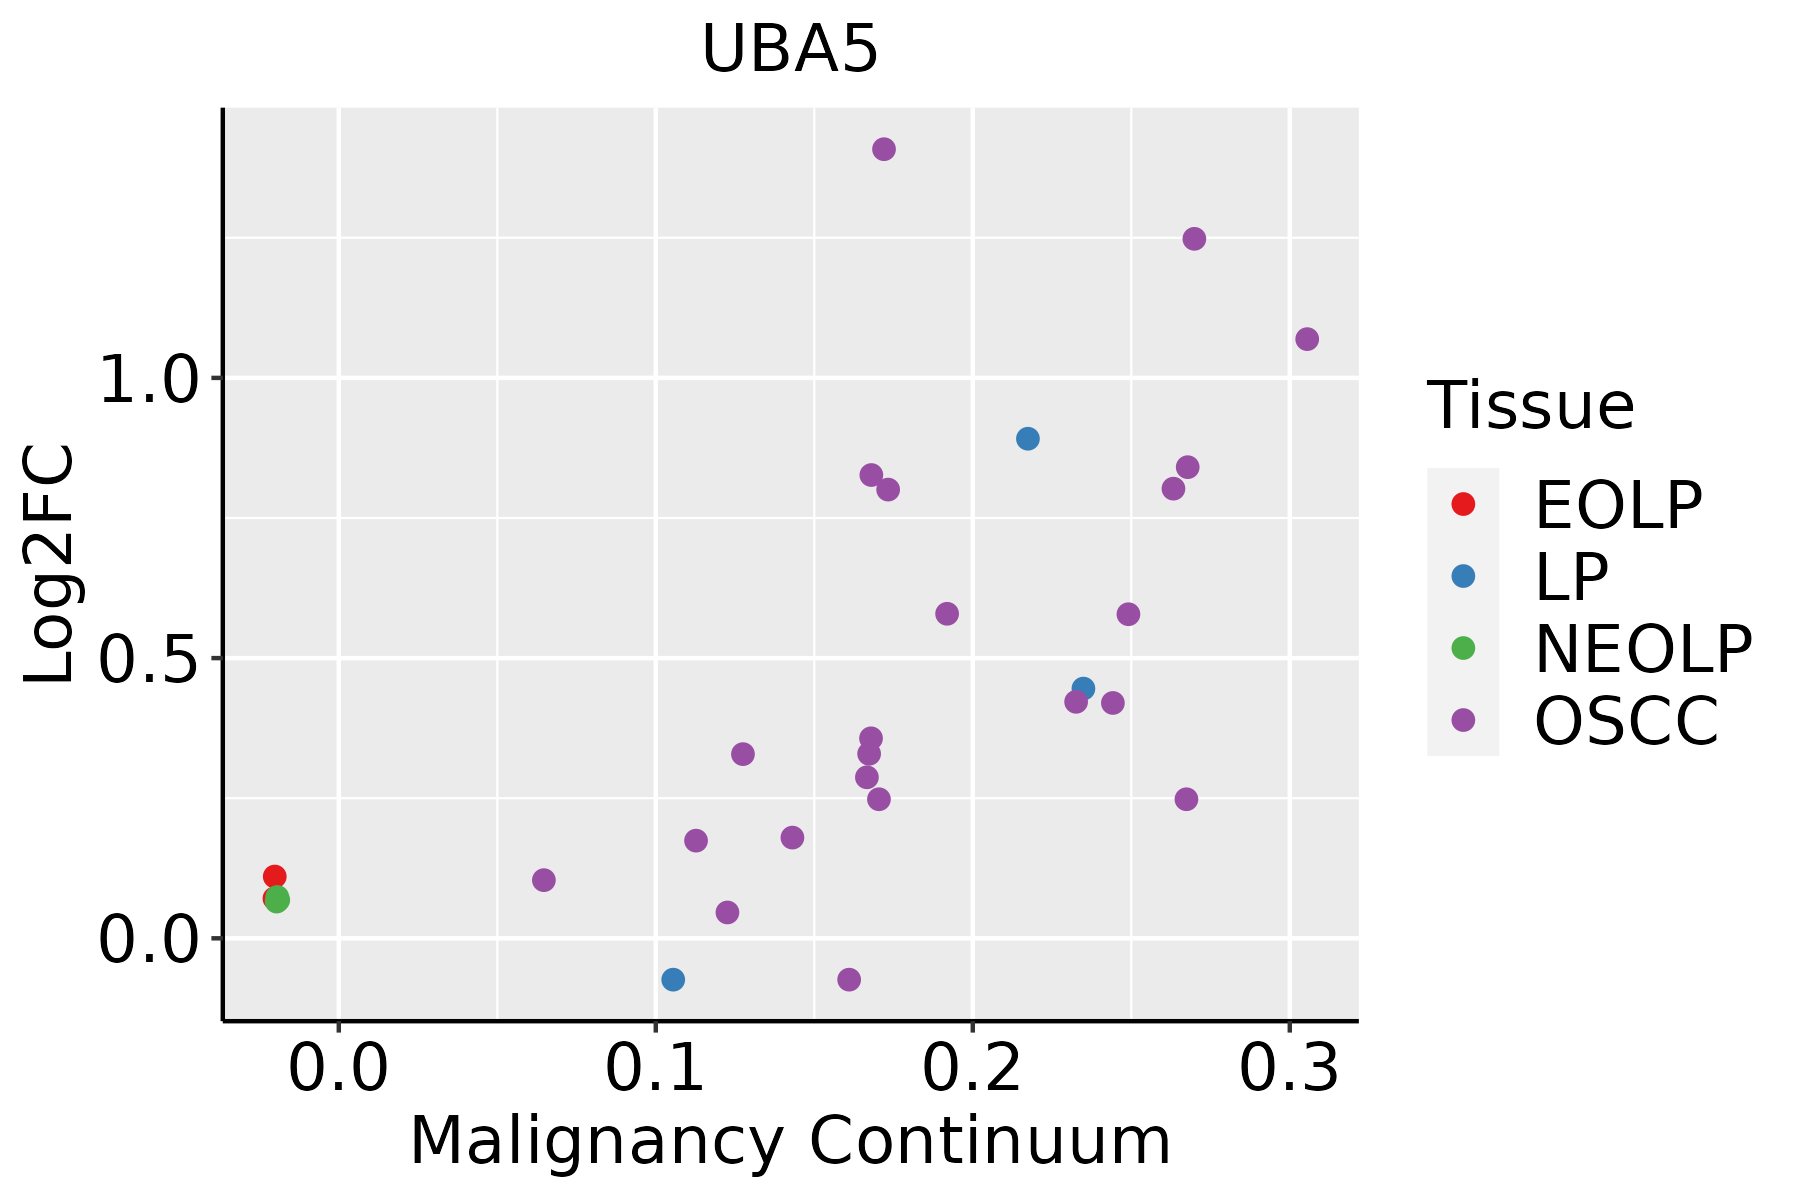 | EOLP: Erosive Oral lichen planus |
| LP: leukoplakia | ||
| NEOLP: Non-erosive oral lichen planus | ||
| OSCC: Oral squamous cell carcinoma | ||
| Skin | 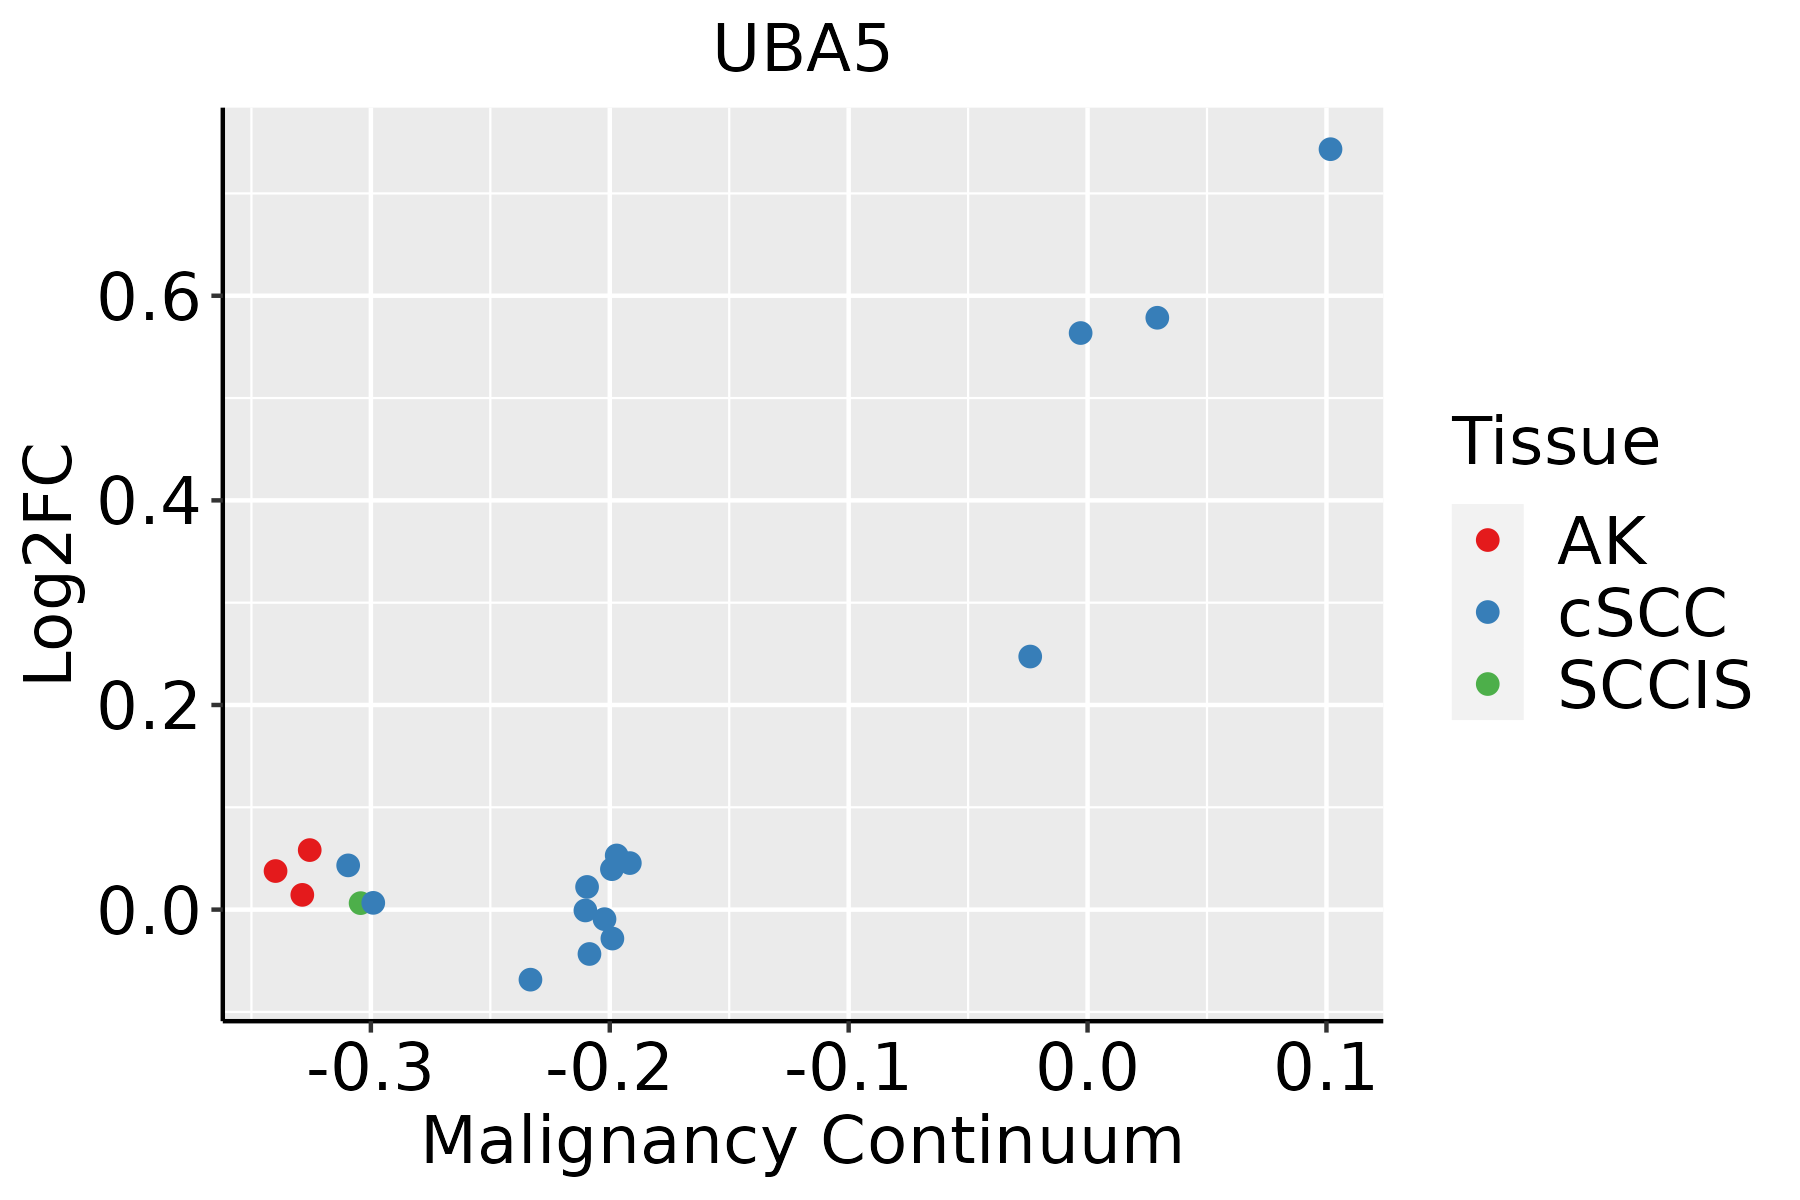 | AK: Actinic keratosis |
| cSCC: Cutaneous squamous cell carcinoma | ||
| SCCIS:squamous cell carcinoma in situ | ||
| Thyroid |  | ATC: Anaplastic thyroid cancer |
| HT: Hashimoto's thyroiditis | ||
| PTC: Papillary thyroid cancer |
| ∗log2FC in expression of this searched gene in stem-like cells from each diseased tissue sample relative to stem-like cells in normal samples in each tissue plotted against the malignancy continuum. Samples are colored based on if they are from different disease stage. |
Top |
Malignant transformation related pathway analysis |
| Find out the enriched GO biological processes and KEGG pathways involved in transition from healthy to precancer to cancer |
| Tissue | Disease Stage | Enriched GO biological Processes |
| Colorectum | AD |  |
| Colorectum | SER |  |
| Colorectum | MSS |  |
| Colorectum | MSI-H |  |
| Colorectum | FAP |  |
| ∗Top 15 enriched GO BP terms are showed in the bar plot of each disease state in each tissue. Each row represents a significant GO biological process which is colored according to the -log10(p.adjust). |
| Page: 1 2 3 4 5 6 7 8 9 |
| GO ID | Tissue | Disease Stage | Description | Gene Ratio | Bg Ratio | pvalue | p.adjust | Count |
| GO:00021819 | Breast | Precancer | cytoplasmic translation | 80/1080 | 148/18723 | 1.59e-59 | 8.54e-56 | 80 |
| GO:00096368 | Breast | Precancer | response to toxic substance | 31/1080 | 262/18723 | 1.18e-04 | 2.12e-03 | 31 |
| GO:000218114 | Breast | IDC | cytoplasmic translation | 82/1434 | 148/18723 | 2.60e-52 | 1.48e-48 | 82 |
| GO:000963613 | Breast | IDC | response to toxic substance | 44/1434 | 262/18723 | 6.33e-07 | 3.00e-05 | 44 |
| GO:000218124 | Breast | DCIS | cytoplasmic translation | 82/1390 | 148/18723 | 2.21e-53 | 1.25e-49 | 82 |
| GO:000963623 | Breast | DCIS | response to toxic substance | 42/1390 | 262/18723 | 1.76e-06 | 6.56e-05 | 42 |
| GO:000218110 | Cervix | CC | cytoplasmic translation | 96/2311 | 148/18723 | 4.87e-51 | 2.91e-47 | 96 |
| GO:00096369 | Cervix | CC | response to toxic substance | 52/2311 | 262/18723 | 3.34e-04 | 3.52e-03 | 52 |
| GO:000218115 | Cervix | HSIL_HPV | cytoplasmic translation | 86/737 | 148/18723 | 3.97e-82 | 1.91e-78 | 86 |
| GO:000963614 | Cervix | HSIL_HPV | response to toxic substance | 24/737 | 262/18723 | 1.14e-04 | 2.36e-03 | 24 |
| GO:000218125 | Cervix | N_HPV | cytoplasmic translation | 42/534 | 148/18723 | 2.61e-30 | 1.19e-26 | 42 |
| GO:000963624 | Cervix | N_HPV | response to toxic substance | 27/534 | 262/18723 | 9.00e-09 | 1.71e-06 | 27 |
| GO:0002181 | Colorectum | AD | cytoplasmic translation | 109/3918 | 148/18723 | 3.40e-43 | 2.13e-39 | 109 |
| GO:0009636 | Colorectum | AD | response to toxic substance | 88/3918 | 262/18723 | 1.12e-06 | 3.72e-05 | 88 |
| GO:00021811 | Colorectum | SER | cytoplasmic translation | 102/2897 | 148/18723 | 1.38e-48 | 8.49e-45 | 102 |
| GO:00096361 | Colorectum | SER | response to toxic substance | 71/2897 | 262/18723 | 8.63e-07 | 4.07e-05 | 71 |
| GO:00021812 | Colorectum | MSS | cytoplasmic translation | 108/3467 | 148/18723 | 1.78e-47 | 1.11e-43 | 108 |
| GO:00096362 | Colorectum | MSS | response to toxic substance | 73/3467 | 262/18723 | 1.26e-04 | 1.94e-03 | 73 |
| GO:00021813 | Colorectum | MSI-H | cytoplasmic translation | 100/1319 | 148/18723 | 1.50e-79 | 8.31e-76 | 100 |
| GO:00021814 | Colorectum | FAP | cytoplasmic translation | 76/2622 | 148/18723 | 3.31e-27 | 2.03e-23 | 76 |
| Page: 1 2 3 4 5 6 7 8 9 10 |
| Pathway ID | Tissue | Disease Stage | Description | Gene Ratio | Bg Ratio | pvalue | p.adjust | qvalue | Count |
| Page: 1 |
Top |
Cell-cell communication analysis |
| Identification of potential cell-cell interactions between two cell types and their ligand-receptor pairs for different disease states |
| Ligand | Receptor | LRpair | Pathway | Tissue | Disease Stage |
| Page: 1 |
Top |
Single-cell gene regulatory network inference analysis |
| Find out the significant the regulons (TFs) and the target genes of each regulon across cell types for different disease states |
| TF | Cell Type | Tissue | Disease Stage | Target Gene | RSS | Regulon Activity |
| ∗The dot plots of a searched regulon are shown for all cell subpopulations in each disease state of each tissue based on the regulon specific score inferred using pySCENIC and by calculating the average expression. |
| Page: 1 |
Top |
Somatic mutation of malignant transformation related genes |
| Annotation of somatic variants for genes involved in malignant transformation |
| Hugo Symbol | Variant Class | Variant Classification | dbSNP RS | HGVSc | HGVSp | HGVSp Short | SWISSPROT | BIOTYPE | SIFT | PolyPhen | Tumor Sample Barcode | Tissue | Histology | Sex | Age | Stage | Therapy Types | Drugs | Outcome |
| UBA5 | SNV | Missense_Mutation | rs368103311 | c.563N>A | p.Arg188Gln | p.R188Q | Q9GZZ9 | protein_coding | deleterious(0) | probably_damaging(0.946) | TCGA-AC-A23H-01 | Breast | breast invasive carcinoma | Female | >=65 | I/II | Unknown | Unknown | PD |
| UBA5 | SNV | Missense_Mutation | c.50G>A | p.Arg17Gln | p.R17Q | Q9GZZ9 | protein_coding | tolerated(0.57) | benign(0) | TCGA-AQ-A04J-01 | Breast | breast invasive carcinoma | Female | <65 | I/II | Chemotherapy | cytoxan | SD | |
| UBA5 | SNV | Missense_Mutation | novel | c.136N>A | p.Glu46Lys | p.E46K | Q9GZZ9 | protein_coding | deleterious(0.01) | benign(0.356) | TCGA-Q1-A5R2-01 | Cervix | cervical & endocervical cancer | Female | <65 | I/II | Chemotherapy | cisplatin | PR |
| UBA5 | SNV | Missense_Mutation | rs150313260 | c.215N>A | p.Arg72His | p.R72H | Q9GZZ9 | protein_coding | deleterious(0.02) | probably_damaging(0.912) | TCGA-A6-2672-01 | Colorectum | colon adenocarcinoma | Female | >=65 | III/IV | Unknown | Unknown | SD |
| UBA5 | SNV | Missense_Mutation | c.614N>A | p.Ser205Tyr | p.S205Y | Q9GZZ9 | protein_coding | deleterious(0) | probably_damaging(1) | TCGA-AA-3930-01 | Colorectum | colon adenocarcinoma | Male | >=65 | III/IV | Chemotherapy | capecitabine | PD | |
| UBA5 | SNV | Missense_Mutation | rs143516396 | c.182N>A | p.Arg61Gln | p.R61Q | Q9GZZ9 | protein_coding | deleterious(0.01) | benign(0.125) | TCGA-AZ-4315-01 | Colorectum | colon adenocarcinoma | Male | <65 | I/II | Unknown | Unknown | SD |
| UBA5 | SNV | Missense_Mutation | rs61748106 | c.199N>A | p.Asp67Asn | p.D67N | Q9GZZ9 | protein_coding | tolerated(1) | benign(0.001) | TCGA-CA-6717-01 | Colorectum | colon adenocarcinoma | Male | <65 | I/II | Chemotherapy | oxaliplatin | CR |
| UBA5 | SNV | Missense_Mutation | c.66G>T | p.Glu22Asp | p.E22D | Q9GZZ9 | protein_coding | tolerated(0.41) | benign(0.021) | TCGA-D5-6928-01 | Colorectum | colon adenocarcinoma | Male | >=65 | I/II | Unknown | Unknown | SD | |
| UBA5 | SNV | Missense_Mutation | novel | c.436N>A | p.Val146Ile | p.V146I | Q9GZZ9 | protein_coding | tolerated(0.23) | benign(0) | TCGA-EI-6917-01 | Colorectum | rectum adenocarcinoma | Male | <65 | III/IV | Chemotherapy | 5fluorouracil+oxaciplatina+l-folinian | SD |
| UBA5 | SNV | Missense_Mutation | novel | c.1036N>T | p.Val346Leu | p.V346L | Q9GZZ9 | protein_coding | tolerated(0.06) | benign(0.007) | TCGA-A5-A0G2-01 | Endometrium | uterine corpus endometrioid carcinoma | Female | <65 | III/IV | Unknown | Unknown | SD |
| Page: 1 2 3 4 |
Top |
Related drugs of malignant transformation related genes |
| Identification of chemicals and drugs interact with genes involved in malignant transfromation |
| (DGIdb 4.0) |
| Entrez ID | Symbol | Category | Interaction Types | Drug Claim Name | Drug Name | PMIDs |
| Page: 1 |

Copyright 2023-Present -The University of Texas Health Science Center at Houston |