
|
|||||
|
 | |
| |
| |
| |
| |
| |
|
Gene: UBA3 |
Gene summary for UBA3 |
| Gene information | Species | Human | Gene symbol | UBA3 | Gene ID | 9039 |
| Gene name | ubiquitin like modifier activating enzyme 3 | |
| Gene Alias | NAE2 | |
| Cytomap | 3p14.1 | |
| Gene Type | protein-coding | GO ID | GO:0000278 | UniProtAcc | Q8TBC4 |
Top |
Malignant transformation analysis |
| Identification of the aberrant gene expression in precancerous and cancerous lesions by comparing the gene expression of stem-like cells in diseased tissues with normal stem cells |
| Entrez ID | Symbol | Replicates | Species | Organ | Tissue | Adj P-value | Log2FC | Malignancy |
| 9039 | UBA3 | LZE4T | Human | Esophagus | ESCC | 3.93e-13 | 4.59e-01 | 0.0811 |
| 9039 | UBA3 | LZE7T | Human | Esophagus | ESCC | 1.15e-04 | 4.10e-01 | 0.0667 |
| 9039 | UBA3 | LZE8T | Human | Esophagus | ESCC | 1.00e-03 | 1.50e-01 | 0.067 |
| 9039 | UBA3 | LZE24T | Human | Esophagus | ESCC | 5.74e-16 | 4.46e-01 | 0.0596 |
| 9039 | UBA3 | P1T-E | Human | Esophagus | ESCC | 5.09e-03 | 2.05e-01 | 0.0875 |
| 9039 | UBA3 | P2T-E | Human | Esophagus | ESCC | 2.61e-29 | 5.04e-01 | 0.1177 |
| 9039 | UBA3 | P4T-E | Human | Esophagus | ESCC | 1.07e-31 | 6.42e-01 | 0.1323 |
| 9039 | UBA3 | P5T-E | Human | Esophagus | ESCC | 2.53e-09 | 1.71e-01 | 0.1327 |
| 9039 | UBA3 | P8T-E | Human | Esophagus | ESCC | 6.78e-14 | 2.55e-01 | 0.0889 |
| 9039 | UBA3 | P9T-E | Human | Esophagus | ESCC | 5.66e-15 | 2.59e-01 | 0.1131 |
| 9039 | UBA3 | P10T-E | Human | Esophagus | ESCC | 2.88e-23 | 3.23e-01 | 0.116 |
| 9039 | UBA3 | P11T-E | Human | Esophagus | ESCC | 7.82e-10 | 4.01e-01 | 0.1426 |
| 9039 | UBA3 | P12T-E | Human | Esophagus | ESCC | 3.35e-15 | 4.70e-01 | 0.1122 |
| 9039 | UBA3 | P15T-E | Human | Esophagus | ESCC | 6.40e-14 | 2.80e-01 | 0.1149 |
| 9039 | UBA3 | P16T-E | Human | Esophagus | ESCC | 3.54e-25 | 3.60e-01 | 0.1153 |
| 9039 | UBA3 | P17T-E | Human | Esophagus | ESCC | 3.88e-06 | 4.34e-01 | 0.1278 |
| 9039 | UBA3 | P19T-E | Human | Esophagus | ESCC | 5.43e-08 | 7.52e-01 | 0.1662 |
| 9039 | UBA3 | P20T-E | Human | Esophagus | ESCC | 4.36e-14 | 2.64e-01 | 0.1124 |
| 9039 | UBA3 | P21T-E | Human | Esophagus | ESCC | 5.11e-30 | 5.61e-01 | 0.1617 |
| 9039 | UBA3 | P22T-E | Human | Esophagus | ESCC | 1.03e-13 | 1.27e-01 | 0.1236 |
| Page: 1 2 3 4 5 |
| Tissue | Expression Dynamics | Abbreviation |
| Esophagus | 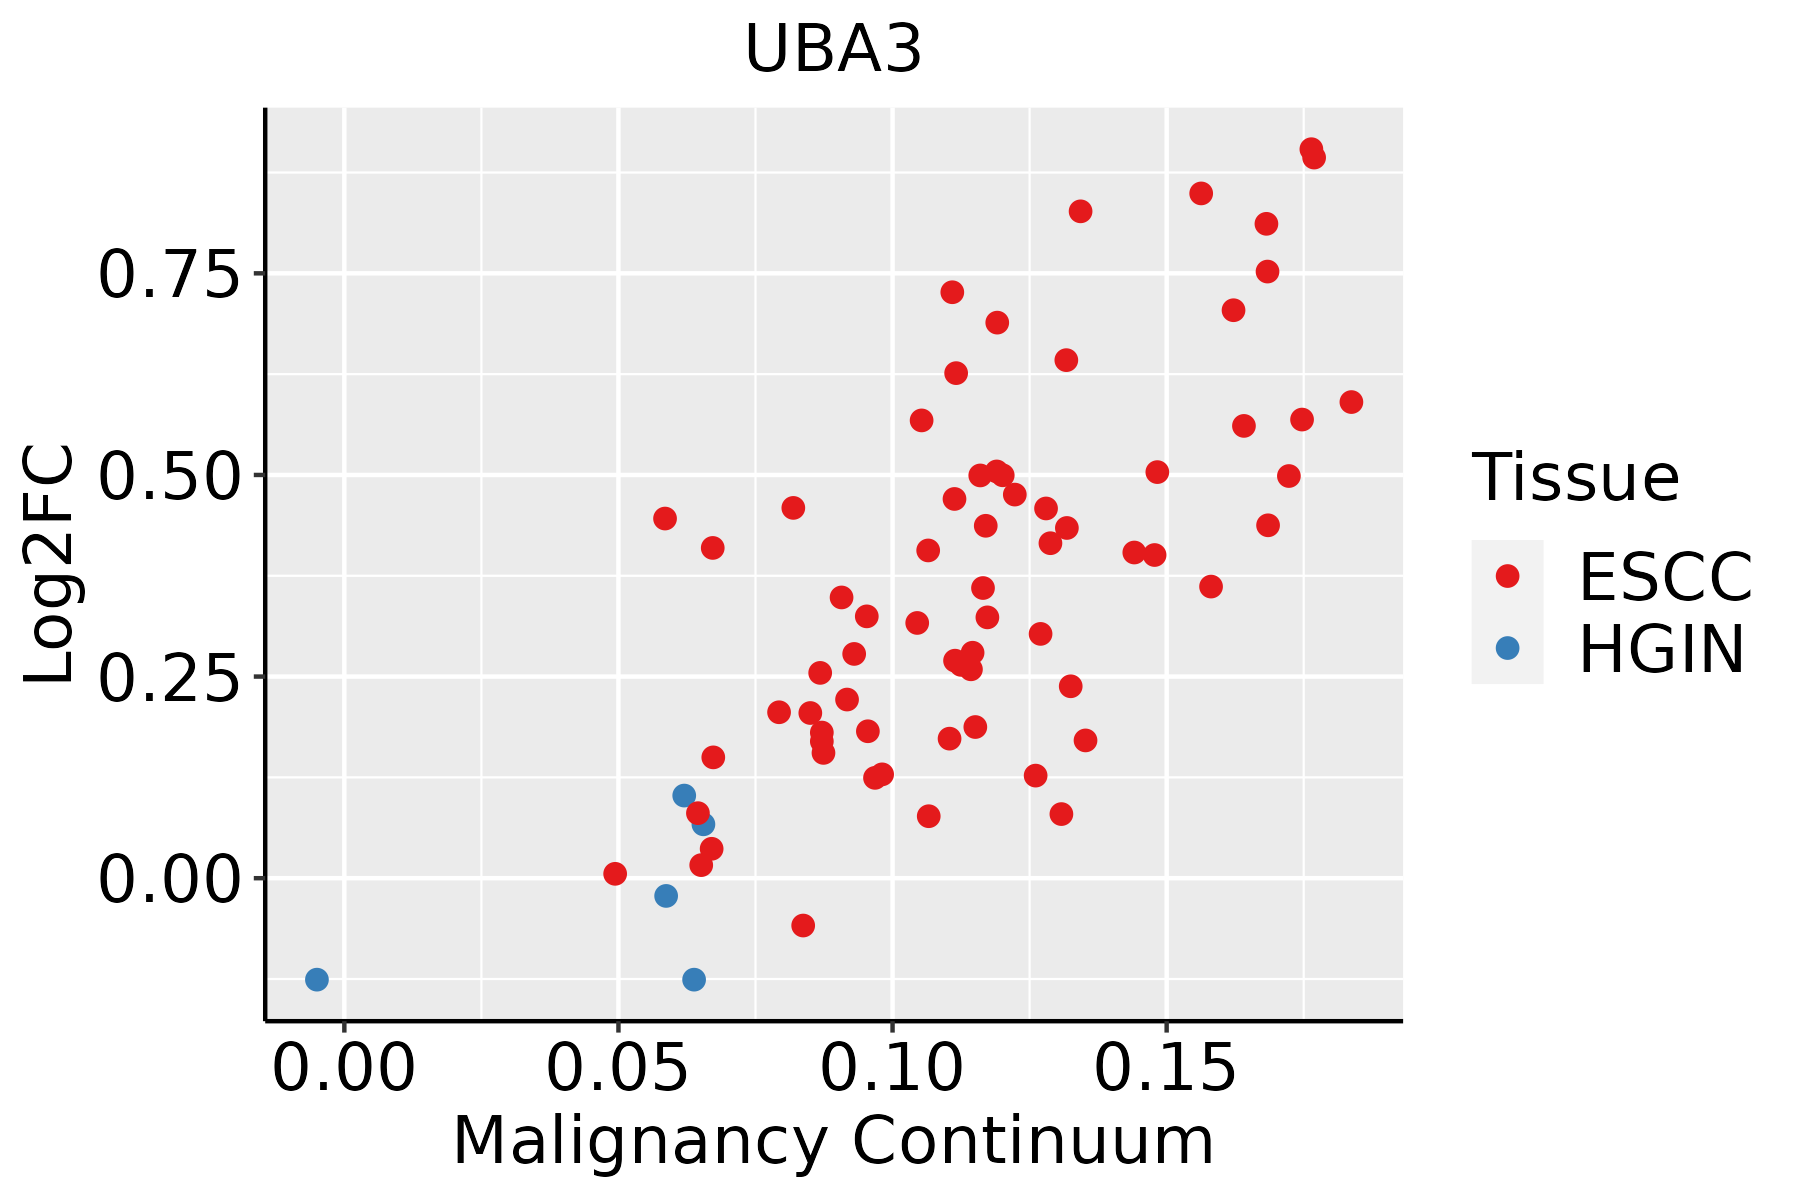 | ESCC: Esophageal squamous cell carcinoma |
| HGIN: High-grade intraepithelial neoplasias | ||
| LGIN: Low-grade intraepithelial neoplasias | ||
| Liver |  | HCC: Hepatocellular carcinoma |
| NAFLD: Non-alcoholic fatty liver disease | ||
| Oral Cavity |  | EOLP: Erosive Oral lichen planus |
| LP: leukoplakia | ||
| NEOLP: Non-erosive oral lichen planus | ||
| OSCC: Oral squamous cell carcinoma | ||
| Skin | 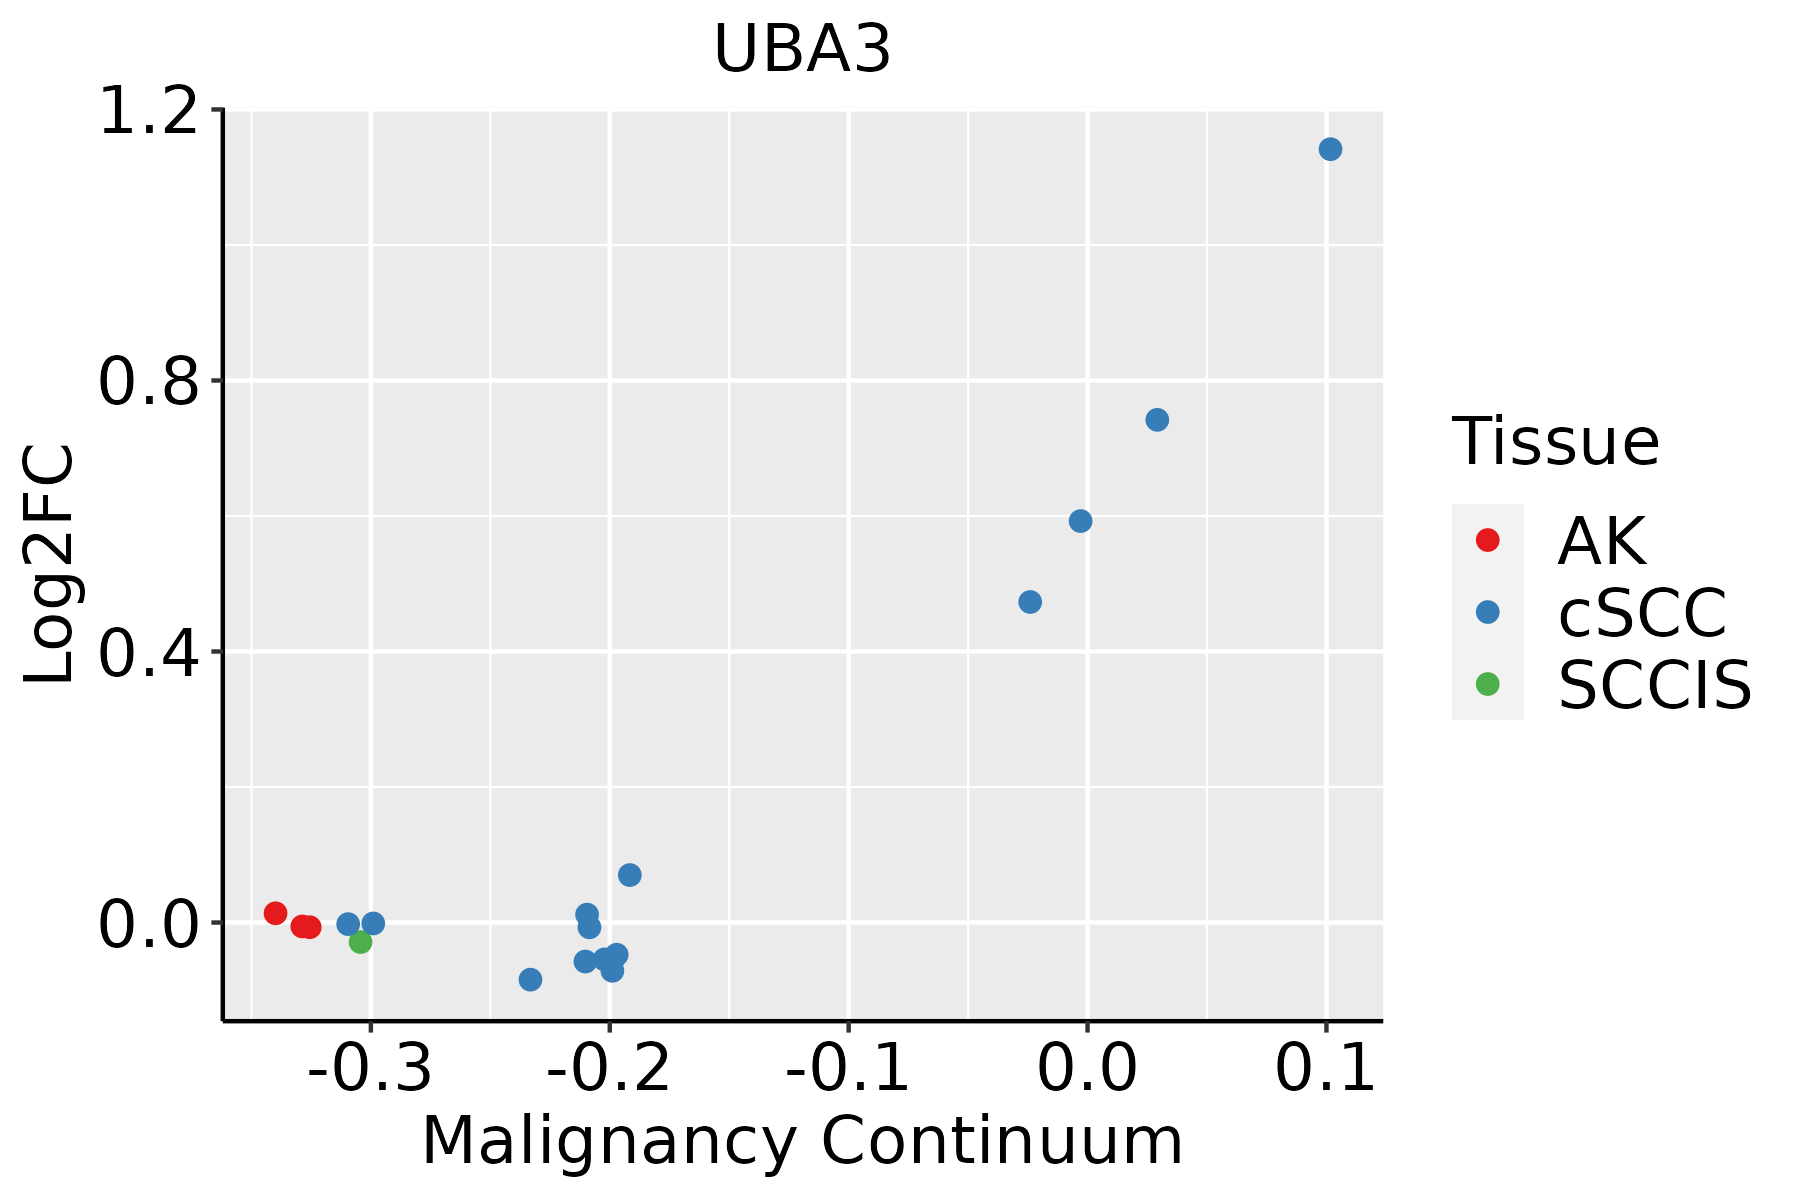 | AK: Actinic keratosis |
| cSCC: Cutaneous squamous cell carcinoma | ||
| SCCIS:squamous cell carcinoma in situ |
| ∗log2FC in expression of this searched gene in stem-like cells from each diseased tissue sample relative to stem-like cells in normal samples in each tissue plotted against the malignancy continuum. Samples are colored based on if they are from different disease stage. |
Top |
Malignant transformation related pathway analysis |
| Find out the enriched GO biological processes and KEGG pathways involved in transition from healthy to precancer to cancer |
| Tissue | Disease Stage | Enriched GO biological Processes |
| Colorectum | AD |  |
| Colorectum | SER |  |
| Colorectum | MSS |  |
| Colorectum | MSI-H |  |
| Colorectum | FAP |  |
| ∗Top 15 enriched GO BP terms are showed in the bar plot of each disease state in each tissue. Each row represents a significant GO biological process which is colored according to the -log10(p.adjust). |
| Page: 1 2 3 4 5 6 7 8 9 |
| GO ID | Tissue | Disease Stage | Description | Gene Ratio | Bg Ratio | pvalue | p.adjust | Count |
| GO:004511614 | Esophagus | ESCC | protein neddylation | 15/8552 | 18/18723 | 1.20e-03 | 5.88e-03 | 15 |
| GO:00451161 | Liver | HCC | protein neddylation | 15/7958 | 18/18723 | 4.74e-04 | 3.12e-03 | 15 |
| GO:0043687 | Liver | HCC | post-translational protein modification | 24/7958 | 37/18723 | 5.03e-03 | 2.11e-02 | 24 |
| GO:00451165 | Oral cavity | OSCC | protein neddylation | 13/7305 | 18/18723 | 4.45e-03 | 1.79e-02 | 13 |
| GO:004511615 | Skin | cSCC | protein neddylation | 14/4864 | 18/18723 | 6.37e-06 | 8.92e-05 | 14 |
| Page: 1 |
| Pathway ID | Tissue | Disease Stage | Description | Gene Ratio | Bg Ratio | pvalue | p.adjust | qvalue | Count |
| hsa0412027 | Esophagus | ESCC | Ubiquitin mediated proteolysis | 122/4205 | 142/8465 | 6.53e-20 | 7.29e-18 | 3.74e-18 | 122 |
| hsa0412036 | Esophagus | ESCC | Ubiquitin mediated proteolysis | 122/4205 | 142/8465 | 6.53e-20 | 7.29e-18 | 3.74e-18 | 122 |
| hsa0412041 | Liver | HCC | Ubiquitin mediated proteolysis | 110/4020 | 142/8465 | 1.67e-13 | 3.74e-12 | 2.08e-12 | 110 |
| hsa0412051 | Liver | HCC | Ubiquitin mediated proteolysis | 110/4020 | 142/8465 | 1.67e-13 | 3.74e-12 | 2.08e-12 | 110 |
| hsa0412020 | Oral cavity | OSCC | Ubiquitin mediated proteolysis | 105/3704 | 142/8465 | 1.83e-13 | 4.37e-12 | 2.23e-12 | 105 |
| hsa04120110 | Oral cavity | OSCC | Ubiquitin mediated proteolysis | 105/3704 | 142/8465 | 1.83e-13 | 4.37e-12 | 2.23e-12 | 105 |
| Page: 1 |
Top |
Cell-cell communication analysis |
| Identification of potential cell-cell interactions between two cell types and their ligand-receptor pairs for different disease states |
| Ligand | Receptor | LRpair | Pathway | Tissue | Disease Stage |
| Page: 1 |
Top |
Single-cell gene regulatory network inference analysis |
| Find out the significant the regulons (TFs) and the target genes of each regulon across cell types for different disease states |
| TF | Cell Type | Tissue | Disease Stage | Target Gene | RSS | Regulon Activity |
| ∗The dot plots of a searched regulon are shown for all cell subpopulations in each disease state of each tissue based on the regulon specific score inferred using pySCENIC and by calculating the average expression. |
| Page: 1 |
Top |
Somatic mutation of malignant transformation related genes |
| Annotation of somatic variants for genes involved in malignant transformation |
| Hugo Symbol | Variant Class | Variant Classification | dbSNP RS | HGVSc | HGVSp | HGVSp Short | SWISSPROT | BIOTYPE | SIFT | PolyPhen | Tumor Sample Barcode | Tissue | Histology | Sex | Age | Stage | Therapy Types | Drugs | Outcome |
| UBA3 | SNV | Missense_Mutation | c.448N>C | p.Asp150His | p.D150H | Q8TBC4 | protein_coding | deleterious(0) | possibly_damaging(0.863) | TCGA-A8-A09N-01 | Breast | breast invasive carcinoma | Female | <65 | III/IV | Unknown | Unknown | SD | |
| UBA3 | insertion | Nonsense_Mutation | novel | c.631_632insATTATGGGACTGGTCTTAACTTTAGATAATAGACTTCTGATAACTG | p.Arg211HisfsTer10 | p.R211Hfs*10 | Q8TBC4 | protein_coding | TCGA-A8-A06X-01 | Breast | breast invasive carcinoma | Female | >=65 | I/II | Unknown | Unknown | SD | ||
| UBA3 | SNV | Missense_Mutation | c.187C>G | p.Leu63Val | p.L63V | Q8TBC4 | protein_coding | tolerated(0.21) | benign(0.188) | TCGA-IR-A3LA-01 | Cervix | cervical & endocervical cancer | Female | <65 | I/II | Chemotherapy | cisplatin | CR | |
| UBA3 | insertion | Frame_Shift_Ins | novel | c.372_373insACTTT | p.Ala125ThrfsTer10 | p.A125Tfs*10 | Q8TBC4 | protein_coding | TCGA-DS-A1OB-01 | Cervix | cervical & endocervical cancer | Female | <65 | I/II | Chemotherapy | carboplatin | PD | ||
| UBA3 | SNV | Missense_Mutation | c.1003N>A | p.Ala335Thr | p.A335T | Q8TBC4 | protein_coding | tolerated(0.2) | benign(0.291) | TCGA-A6-3809-01 | Colorectum | colon adenocarcinoma | Female | >=65 | I/II | Unknown | Unknown | SD | |
| UBA3 | SNV | Missense_Mutation | rs373601125 | c.470N>A | p.Arg157Gln | p.R157Q | Q8TBC4 | protein_coding | tolerated(0.23) | benign(0.257) | TCGA-AA-3510-01 | Colorectum | colon adenocarcinoma | Male | >=65 | I/II | Unknown | Unknown | SD |
| UBA3 | SNV | Missense_Mutation | novel | c.1196N>T | p.Ser399Phe | p.S399F | Q8TBC4 | protein_coding | deleterious(0.01) | possibly_damaging(0.704) | TCGA-AA-3846-01 | Colorectum | colon adenocarcinoma | Female | >=65 | I/II | Unknown | Unknown | SD |
| UBA3 | SNV | Missense_Mutation | novel | c.140N>A | p.Arg47Gln | p.R47Q | Q8TBC4 | protein_coding | deleterious(0.01) | probably_damaging(0.989) | TCGA-AA-3984-01 | Colorectum | colon adenocarcinoma | Female | <65 | I/II | Unknown | Unknown | SD |
| UBA3 | SNV | Missense_Mutation | rs373601125 | c.470N>A | p.Arg157Gln | p.R157Q | Q8TBC4 | protein_coding | tolerated(0.23) | benign(0.257) | TCGA-CA-6717-01 | Colorectum | colon adenocarcinoma | Male | <65 | I/II | Chemotherapy | oxaliplatin | CR |
| UBA3 | SNV | Missense_Mutation | c.1250N>T | p.Ser417Leu | p.S417L | Q8TBC4 | protein_coding | tolerated(0.28) | benign(0.009) | TCGA-DM-A28M-01 | Colorectum | colon adenocarcinoma | Male | <65 | I/II | Unknown | Unknown | SD |
| Page: 1 2 3 4 5 |
Top |
Related drugs of malignant transformation related genes |
| Identification of chemicals and drugs interact with genes involved in malignant transfromation |
| (DGIdb 4.0) |
| Entrez ID | Symbol | Category | Interaction Types | Drug Claim Name | Drug Name | PMIDs |
| 9039 | UBA3 | TUMOR SUPPRESSOR, ENZYME | inhibitor | CHEMBL1231160 | PEVONEDISTAT | |
| 9039 | UBA3 | TUMOR SUPPRESSOR, ENZYME | MLN-4924 | PEVONEDISTAT |
| Page: 1 |

Copyright 2023-Present -The University of Texas Health Science Center at Houston |