| Tissue | Expression Dynamics | Abbreviation |
| Colorectum (GSE201348) |  | FAP: Familial adenomatous polyposis |
| CRC: Colorectal cancer |
| Colorectum (HTA11) |  | AD: Adenomas |
| SER: Sessile serrated lesions |
| MSI-H: Microsatellite-high colorectal cancer |
| MSS: Microsatellite stable colorectal cancer |
| Esophagus |  | ESCC: Esophageal squamous cell carcinoma |
| HGIN: High-grade intraepithelial neoplasias |
| LGIN: Low-grade intraepithelial neoplasias |
| Liver | 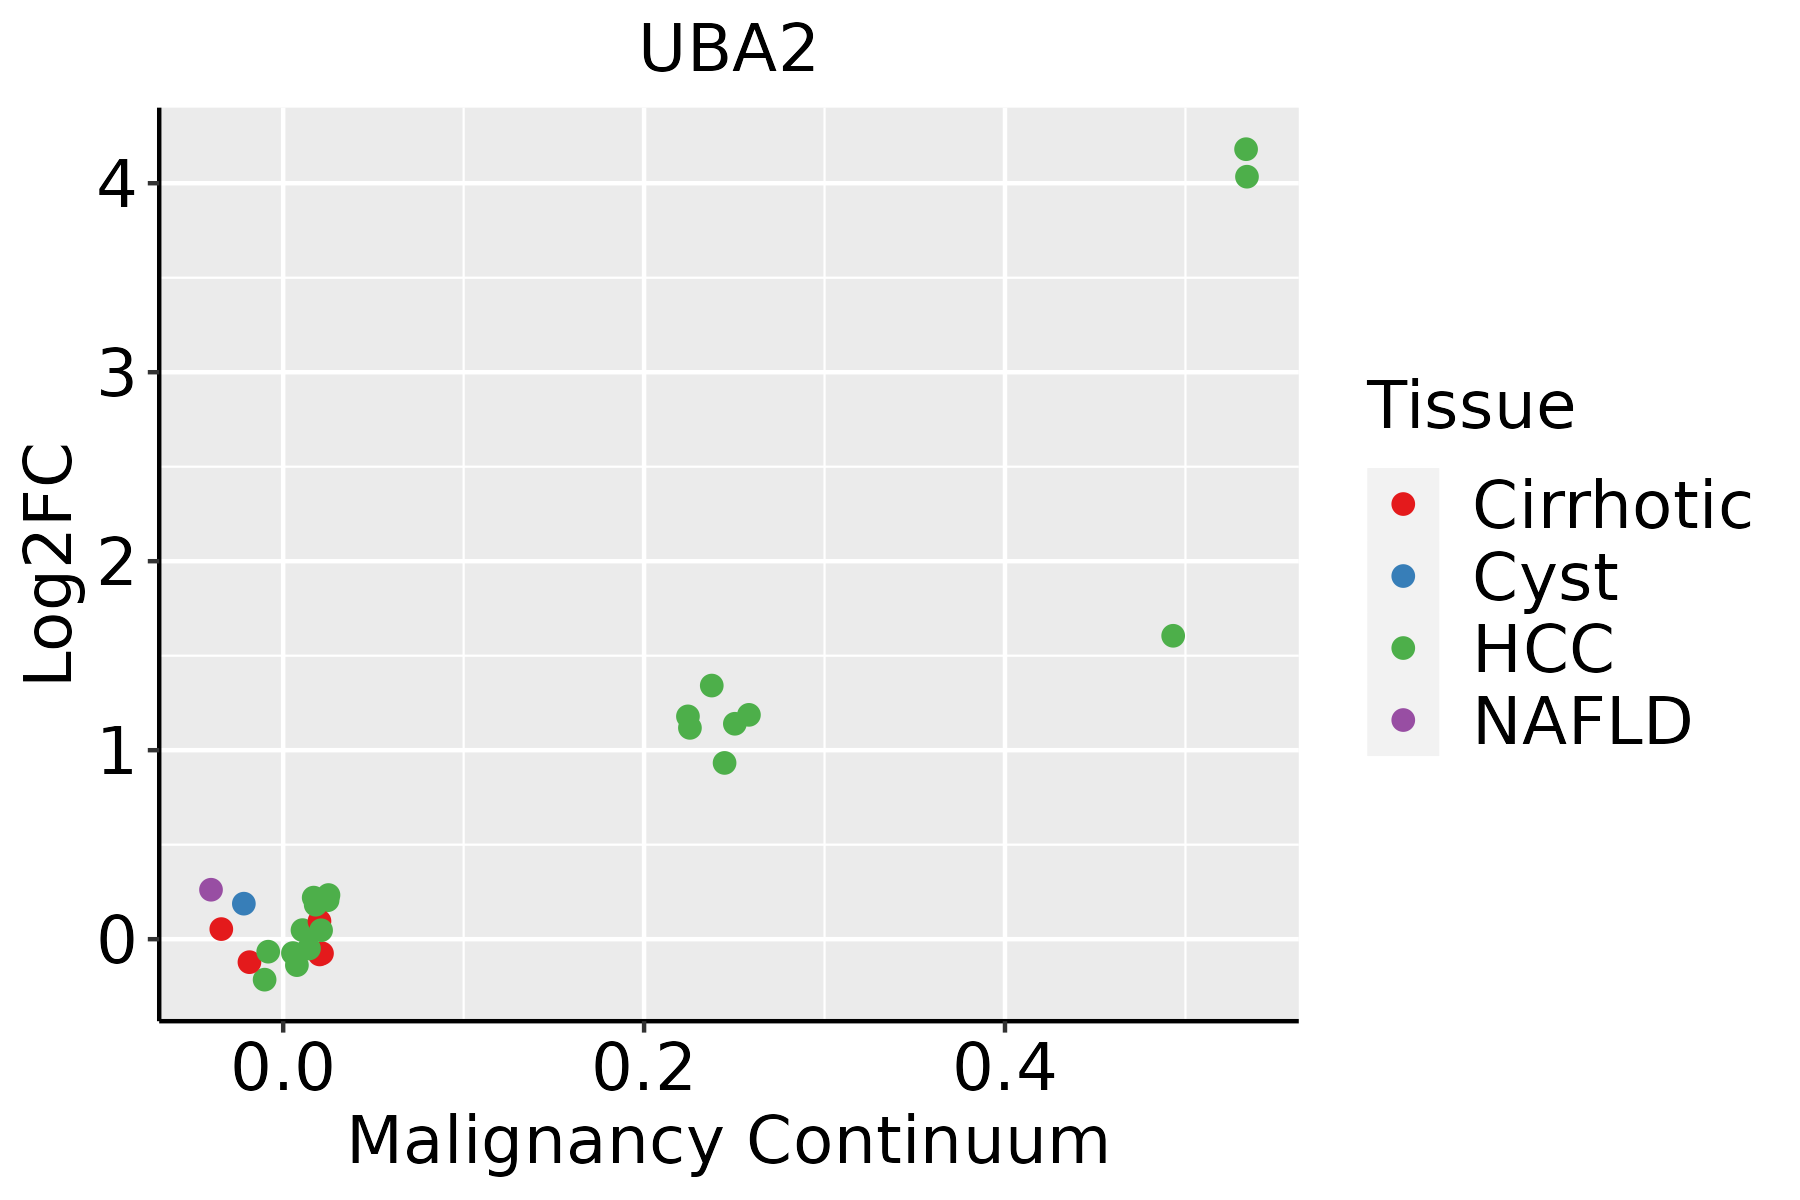 | HCC: Hepatocellular carcinoma |
| NAFLD: Non-alcoholic fatty liver disease |
| Oral Cavity |  | EOLP: Erosive Oral lichen planus |
| LP: leukoplakia |
| NEOLP: Non-erosive oral lichen planus |
| OSCC: Oral squamous cell carcinoma |
| Prostate |  | BPH: Benign Prostatic Hyperplasia |
| Skin |  | AK: Actinic keratosis |
| cSCC: Cutaneous squamous cell carcinoma |
| SCCIS:squamous cell carcinoma in situ |
| Thyroid | 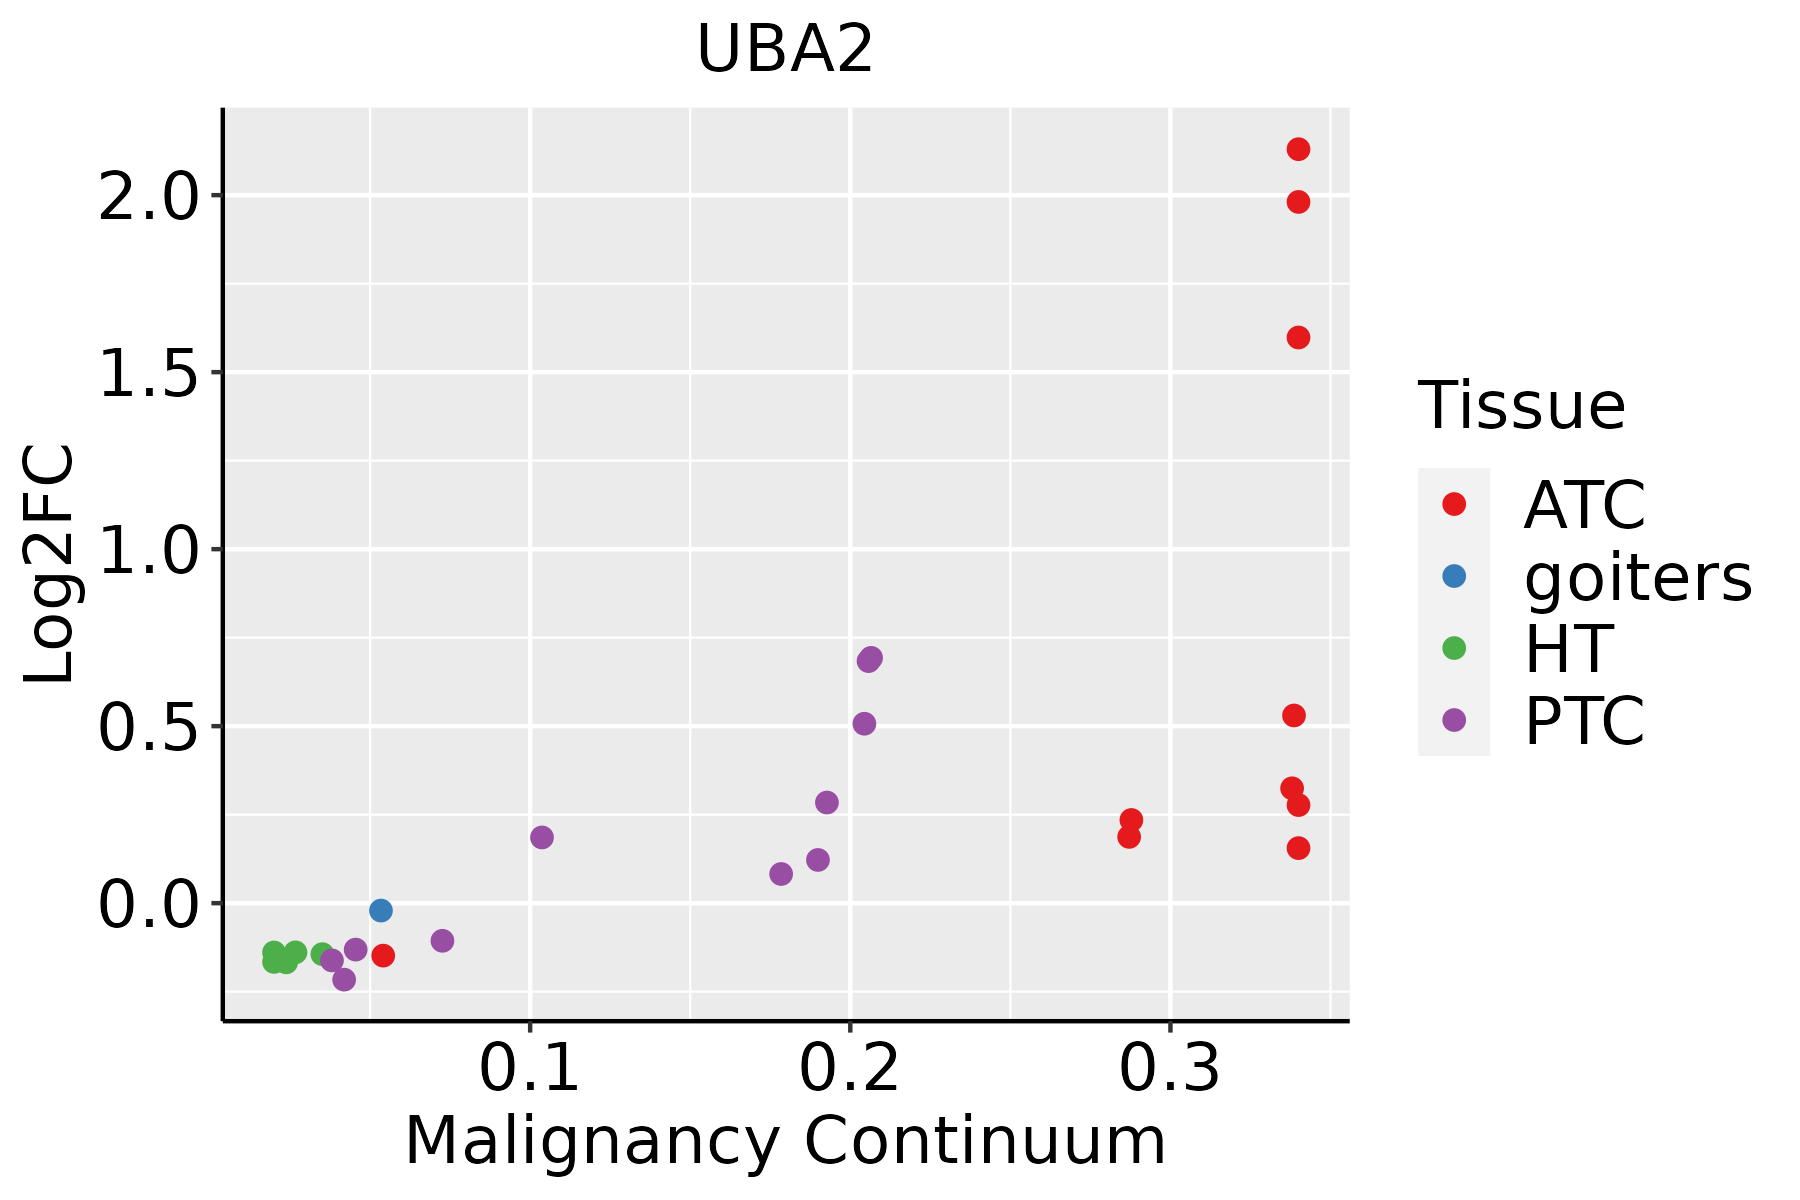 | ATC: Anaplastic thyroid cancer |
| HT: Hashimoto's thyroiditis |
| PTC: Papillary thyroid cancer |
| GO ID | Tissue | Disease Stage | Description | Gene Ratio | Bg Ratio | pvalue | p.adjust | Count |
| GO:1903320 | Colorectum | AD | regulation of protein modification by small protein conjugation or removal | 86/3918 | 242/18723 | 9.43e-08 | 4.65e-06 | 86 |
| GO:19033202 | Colorectum | MSS | regulation of protein modification by small protein conjugation or removal | 82/3467 | 242/18723 | 7.49e-09 | 4.63e-07 | 82 |
| GO:19033203 | Colorectum | MSI-H | regulation of protein modification by small protein conjugation or removal | 43/1319 | 242/18723 | 1.60e-08 | 1.85e-06 | 43 |
| GO:19033204 | Colorectum | FAP | regulation of protein modification by small protein conjugation or removal | 61/2622 | 242/18723 | 2.36e-06 | 9.21e-05 | 61 |
| GO:19033205 | Colorectum | CRC | regulation of protein modification by small protein conjugation or removal | 51/2078 | 242/18723 | 4.55e-06 | 1.87e-04 | 51 |
| GO:190332027 | Esophagus | HGIN | regulation of protein modification by small protein conjugation or removal | 78/2587 | 242/18723 | 1.40e-13 | 2.26e-11 | 78 |
| GO:00182057 | Esophagus | HGIN | peptidyl-lysine modification | 88/2587 | 376/18723 | 2.99e-07 | 1.39e-05 | 88 |
| GO:00169254 | Esophagus | HGIN | protein sumoylation | 18/2587 | 53/18723 | 1.64e-04 | 3.19e-03 | 18 |
| GO:19033228 | Esophagus | HGIN | positive regulation of protein modification by small protein conjugation or removal | 35/2587 | 138/18723 | 2.11e-04 | 3.88e-03 | 35 |
| GO:0033233 | Esophagus | HGIN | regulation of protein sumoylation | 9/2587 | 25/18723 | 4.57e-03 | 3.96e-02 | 9 |
| GO:1903320111 | Esophagus | ESCC | regulation of protein modification by small protein conjugation or removal | 181/8552 | 242/18723 | 1.80e-20 | 2.60e-18 | 181 |
| GO:001820514 | Esophagus | ESCC | peptidyl-lysine modification | 259/8552 | 376/18723 | 3.90e-20 | 5.26e-18 | 259 |
| GO:190332216 | Esophagus | ESCC | positive regulation of protein modification by small protein conjugation or removal | 99/8552 | 138/18723 | 4.39e-10 | 1.16e-08 | 99 |
| GO:001692512 | Esophagus | ESCC | protein sumoylation | 41/8552 | 53/18723 | 2.49e-06 | 2.86e-05 | 41 |
| GO:00332331 | Esophagus | ESCC | regulation of protein sumoylation | 18/8552 | 25/18723 | 7.04e-03 | 2.56e-02 | 18 |
| GO:0033235 | Esophagus | ESCC | positive regulation of protein sumoylation | 10/8552 | 12/18723 | 8.94e-03 | 3.12e-02 | 10 |
| GO:0018205 | Liver | NAFLD | peptidyl-lysine modification | 65/1882 | 376/18723 | 9.42e-06 | 3.02e-04 | 65 |
| GO:19033207 | Liver | NAFLD | regulation of protein modification by small protein conjugation or removal | 44/1882 | 242/18723 | 7.53e-05 | 1.56e-03 | 44 |
| GO:190332012 | Liver | Cirrhotic | regulation of protein modification by small protein conjugation or removal | 105/4634 | 242/18723 | 1.43e-10 | 7.43e-09 | 105 |
| GO:00182051 | Liver | Cirrhotic | peptidyl-lysine modification | 134/4634 | 376/18723 | 1.29e-06 | 2.59e-05 | 134 |
| Pathway ID | Tissue | Disease Stage | Description | Gene Ratio | Bg Ratio | pvalue | p.adjust | qvalue | Count |
| hsa04120 | Colorectum | AD | Ubiquitin mediated proteolysis | 58/2092 | 142/8465 | 1.46e-05 | 1.53e-04 | 9.76e-05 | 58 |
| hsa041201 | Colorectum | AD | Ubiquitin mediated proteolysis | 58/2092 | 142/8465 | 1.46e-05 | 1.53e-04 | 9.76e-05 | 58 |
| hsa041204 | Colorectum | MSS | Ubiquitin mediated proteolysis | 55/1875 | 142/8465 | 5.02e-06 | 6.00e-05 | 3.68e-05 | 55 |
| hsa041205 | Colorectum | MSS | Ubiquitin mediated proteolysis | 55/1875 | 142/8465 | 5.02e-06 | 6.00e-05 | 3.68e-05 | 55 |
| hsa041206 | Colorectum | FAP | Ubiquitin mediated proteolysis | 51/1404 | 142/8465 | 1.55e-08 | 5.84e-07 | 3.55e-07 | 51 |
| hsa041207 | Colorectum | FAP | Ubiquitin mediated proteolysis | 51/1404 | 142/8465 | 1.55e-08 | 5.84e-07 | 3.55e-07 | 51 |
| hsa041208 | Colorectum | CRC | Ubiquitin mediated proteolysis | 42/1091 | 142/8465 | 9.98e-08 | 6.67e-06 | 4.52e-06 | 42 |
| hsa041209 | Colorectum | CRC | Ubiquitin mediated proteolysis | 42/1091 | 142/8465 | 9.98e-08 | 6.67e-06 | 4.52e-06 | 42 |
| hsa0412026 | Esophagus | HGIN | Ubiquitin mediated proteolysis | 49/1383 | 142/8465 | 7.78e-08 | 1.33e-06 | 1.06e-06 | 49 |
| hsa04120111 | Esophagus | HGIN | Ubiquitin mediated proteolysis | 49/1383 | 142/8465 | 7.78e-08 | 1.33e-06 | 1.06e-06 | 49 |
| hsa0412027 | Esophagus | ESCC | Ubiquitin mediated proteolysis | 122/4205 | 142/8465 | 6.53e-20 | 7.29e-18 | 3.74e-18 | 122 |
| hsa0412036 | Esophagus | ESCC | Ubiquitin mediated proteolysis | 122/4205 | 142/8465 | 6.53e-20 | 7.29e-18 | 3.74e-18 | 122 |
| hsa0412010 | Liver | NAFLD | Ubiquitin mediated proteolysis | 44/1043 | 142/8465 | 2.59e-09 | 1.70e-07 | 1.37e-07 | 44 |
| hsa0412011 | Liver | NAFLD | Ubiquitin mediated proteolysis | 44/1043 | 142/8465 | 2.59e-09 | 1.70e-07 | 1.37e-07 | 44 |
| hsa0412021 | Liver | Cirrhotic | Ubiquitin mediated proteolysis | 72/2530 | 142/8465 | 1.32e-07 | 1.97e-06 | 1.21e-06 | 72 |
| hsa0412031 | Liver | Cirrhotic | Ubiquitin mediated proteolysis | 72/2530 | 142/8465 | 1.32e-07 | 1.97e-06 | 1.21e-06 | 72 |
| hsa0412041 | Liver | HCC | Ubiquitin mediated proteolysis | 110/4020 | 142/8465 | 1.67e-13 | 3.74e-12 | 2.08e-12 | 110 |
| hsa0412051 | Liver | HCC | Ubiquitin mediated proteolysis | 110/4020 | 142/8465 | 1.67e-13 | 3.74e-12 | 2.08e-12 | 110 |
| hsa0412020 | Oral cavity | OSCC | Ubiquitin mediated proteolysis | 105/3704 | 142/8465 | 1.83e-13 | 4.37e-12 | 2.23e-12 | 105 |
| hsa04120110 | Oral cavity | OSCC | Ubiquitin mediated proteolysis | 105/3704 | 142/8465 | 1.83e-13 | 4.37e-12 | 2.23e-12 | 105 |
| Hugo Symbol | Variant Class | Variant Classification | dbSNP RS | HGVSc | HGVSp | HGVSp Short | SWISSPROT | BIOTYPE | SIFT | PolyPhen | Tumor Sample Barcode | Tissue | Histology | Sex | Age | Stage | Therapy Types | Drugs | Outcome |
| UBA2 | SNV | Missense_Mutation | novel | c.91N>C | p.Glu31Gln | p.E31Q | Q9UBT2 | protein_coding | deleterious(0.03) | probably_damaging(0.998) | TCGA-5L-AAT1-01 | Breast | breast invasive carcinoma | Female | <65 | III/IV | Hormone Therapy | letrozol | SD |
| UBA2 | SNV | Missense_Mutation | | c.526N>T | p.Arg176Cys | p.R176C | Q9UBT2 | protein_coding | deleterious(0.02) | probably_damaging(1) | TCGA-AN-A046-01 | Breast | breast invasive carcinoma | Female | >=65 | I/II | Unknown | Unknown | SD |
| UBA2 | SNV | Missense_Mutation | | c.796C>A | p.Leu266Met | p.L266M | Q9UBT2 | protein_coding | deleterious(0) | probably_damaging(0.978) | TCGA-D8-A1J8-01 | Breast | breast invasive carcinoma | Female | >=65 | I/II | Hormone Therapy | nolvadex | SD |
| UBA2 | deletion | In_Frame_Del | | c.681_704delNNNNNNNNNNNNNNNNNNNNNNNN | p.Arg227_Ile235delinsSer | p.R227_I235delinsS | Q9UBT2 | protein_coding | | | TCGA-A8-A07L-01 | Breast | breast invasive carcinoma | Female | <65 | III/IV | Chemotherapy | | CR |
| UBA2 | insertion | Nonsense_Mutation | novel | c.1343_1344insTAGCTAGCCTAGCCTTTAGCTGATTAGAAA | p.Pro448_Glu449insSerTerProSerLeuTerLeuIleArgLys | p.P448_E449insS*PSL*LIRK | Q9UBT2 | protein_coding | | | TCGA-A8-A09E-01 | Breast | breast invasive carcinoma | Female | >=65 | III/IV | Hormone Therapy | anastrozole | SD |
| UBA2 | insertion | Frame_Shift_Ins | novel | c.1122_1123insATCTTGGCTTACTGCAGCCTCTGCGTCCCGG | p.Asp375IlefsTer27 | p.D375Ifs*27 | Q9UBT2 | protein_coding | | | TCGA-B6-A0RE-01 | Breast | breast invasive carcinoma | Female | <65 | I/II | Unknown | Unknown | SD |
| UBA2 | SNV | Missense_Mutation | | c.752N>T | p.Pro251Leu | p.P251L | Q9UBT2 | protein_coding | deleterious(0) | benign(0.362) | TCGA-EK-A2RB-01 | Cervix | cervical & endocervical cancer | Female | <65 | I/II | Unknown | Unknown | SD |
| UBA2 | insertion | Nonsense_Mutation | novel | c.341_342insAAAAACATAGTAAC | p.Asn114LysfsTer4 | p.N114Kfs*4 | Q9UBT2 | protein_coding | | | TCGA-DS-A1OB-01 | Cervix | cervical & endocervical cancer | Female | <65 | I/II | Chemotherapy | carboplatin | PD |
| UBA2 | SNV | Missense_Mutation | | c.365N>A | p.Arg122Gln | p.R122Q | Q9UBT2 | protein_coding | deleterious(0) | probably_damaging(0.999) | TCGA-A6-3809-01 | Colorectum | colon adenocarcinoma | Female | >=65 | I/II | Unknown | Unknown | SD |
| UBA2 | SNV | Missense_Mutation | novel | c.173N>G | p.Asn58Ser | p.N58S | Q9UBT2 | protein_coding | deleterious(0) | probably_damaging(1) | TCGA-AA-3509-01 | Colorectum | colon adenocarcinoma | Female | <65 | I/II | Unknown | Unknown | SD |


